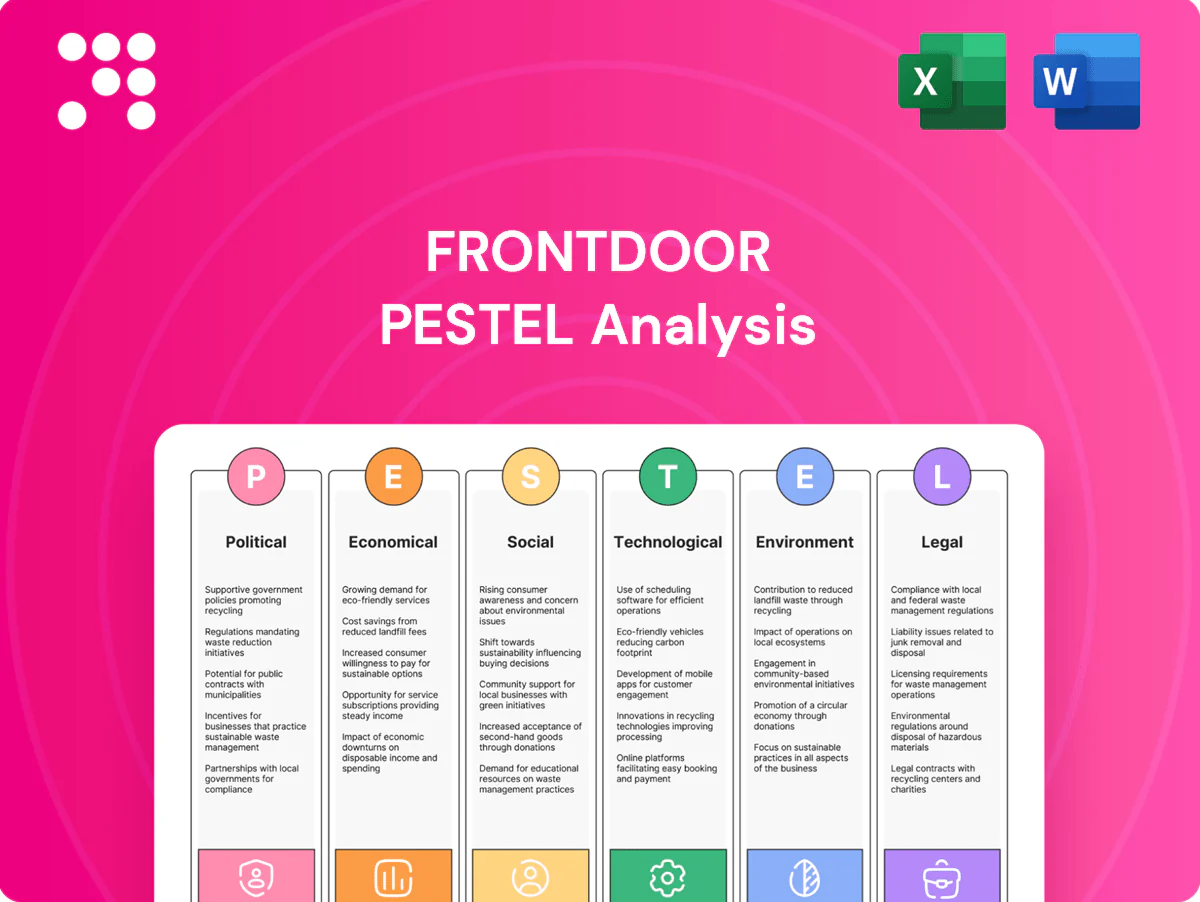
Frontdoor PESTLE Analysis

Make Smarter Strategic Decisions with a Complete PESTEL View
Gain a competitive edge with our focused PESTLE Analysis of Frontdoor that reveals how political, economic, social, technological, legal, and environmental forces shape its outlook. Perfect for investors and strategists, this concise report highlights risks and growth levers. Purchase the full version now for the complete, actionable breakdown.
Political factors

State-level regulation of service contracts
Frontdoor (NASDAQ: FTDR) operates under state-specific home service contract rules across all 50 states, which govern coverage terms, disclosures and reserve requirements.
Regulatory variability increases compliance complexity and operational costs and can force product redesigns when large states such as California and Texas (≈68.6 million residents combined) change policy.
Proactive engagement with state regulators helps mitigate rapid adverse rulemaking that would otherwise pressure pricing and capital reserves.
Housing and homeownership policy direction
Federal and state incentives shape demand for Frontdoor home warranties: the US homeownership rate was about 65.5% in 2024 (Census), while US home improvement spending was roughly $450B in 2023 (JCHS), both supporting warranty uptake. Programs that increase housing turnover expand addressable customers; conversely, affordability constraints or cuts to incentives can slow plan sales. Monitoring policy agendas helps align sales, pricing and partnership strategies.

Disaster relief and resilience funding
Public disaster relief and resilience funding shapes Frontdoor repair demand and contractor availability; FEMA's BRIC program awarded about $1.4 billion in FY2024 and federal disaster assistance exceeded $40 billion across recent major events, boosting large-scale recovery work. Subsidies and grant programs that cover portions of mitigation or repairs can materially lower out‑of‑pocket costs, supporting plan adoption. Extended relief timelines and federal/state coordination often delay private repairs, shifting claim timing and cash flow. Close collaboration with local authorities improves service continuity and access to prioritized contract work.

Trade and tariff impacts on parts
Tariffs on appliances and components (US Section 301 tariffs up to 25%) raise replacement costs and increase claim severities; higher input prices compress margins for plan providers. Import disruptions have extended repair timelines, with supply-chain delays persisting into 2024. Sourcing diversification is used as a political-risk hedge. Cost pass-through requires careful pricing and proactive customer communication.
- Tariffs: Section 301 up to 25%
- Repair delays: supply-chain disruptions into 2024
- Diversification: political-risk hedge
- Pricing: cautious cost pass-through, clear communication
Labor and immigration policy shaping contractor supply
Tighter labor and immigration policies can shrink skilled trades supply, pushing service costs up and slowing dispatch; US construction employment was about 7.5 million in 2024 (BLS), amplifying sensitivity to labor shifts. Expanded H-2B visas (cap 66,000) or DOL apprenticeship funding (about 1.35 billion USD in 2023) can relieve constraints. Political swings drive regional contractor variability, so capacity planning must model policy-risk scenarios.
- Policy tightening raises costs & delays
- H-2B cap 66,000 — limits seasonal hires
- $1.35B DOL apprenticeship grants (2023) ease shortages
- Plan capacity for regional policy variance
Warranty rules and political risks raise compliance costs, reshape US home-protection market
Frontdoor faces state-by-state warranty regulation (CA+TX ≈68.6M residents) that raises compliance costs and forces product redesigns.
Federal/state incentives and market size support demand (US homeownership 65.5% in 2024; US home improvement ≈$450B in 2023) but affordability shifts can reduce plan sales.
Political risks—tariffs up to 25%, FEMA BRIC $1.4B FY2024, disaster aid >$40B, H-2B cap 66,000—affect parts costs, claims timing and contractor availability.
| Metric | Value |
|---|---|
| CA+TX pop | ≈68.6M |
| Homeownership (2024) | 65.5% |
| Home improvement (2023) | $450B |
| Tariffs | up to 25% |
| BRIC FY2024 | $1.4B |
| H-2B cap | 66,000 |
What is included in the product
 Detailed Word Document
Explores how political, economic, social, technological, environmental and legal forces uniquely affect Frontdoor, with each section backed by data, trends and specific examples to identify threats and opportunities; designed for executives and investors with forward‑looking insights ready for plans and decks.

 Customizable Excel Spreadsheet
A concise, visually segmented PESTLE summary for Frontdoor that relieves time‑consuming external risk research, can be dropped into presentations or strategy packs, and is easily shared and edited with notes for regional or business‑line context.
Economic factors

Interest rates and housing turnover
Higher interest rates—30-year mortgage rates near 7% in mid-2025—suppress home sales and reduce warranty attach opportunities at closing, slowing Frontdoor plan growth. Lower refinance activity, with refinance applications still down over 60% versus 2020 peaks, cuts marketing touchpoints tied to refinancing cycles. When rates stabilize or fall, churn and new-plan growth historically rebound. Sales channels must adapt to housing-cycle timing and lender/refi flows.
Inflation in parts and labor
Materials and technician wage inflation have pushed claim costs higher—U.S. CPI averaged 3.4% in 2024 while average private-sector wage growth ran about 4.6% year-over-year, raising parts and labor expense burdens. Pricing and contract terms require more frequent updates to protect margins. Lag effects can compress profitability if not anticipated. Supplier agreements and hedges can dampen volatility.

Consumer confidence and discretionary spend
Home service plans compete with other household expenses and McKinsey 2023 found roughly 40% of consumers cut discretionary home services during downturns. Protection products can be deferred by some but valued by others for risk transfer, driving mixed demand elasticity. Clear ROI messaging boosts retention by making cost vs risk explicit, while flexible payment options (monthly/financing) support affordability and reduce churn.

Unemployment and household cash flow
Rising unemployment (US 4.0% June 2025, BLS) squeezes household cash flow, pressuring cancellations and bad debt for Frontdoor; deferred maintenance raises failure-driven claims. Proactive collections and hardship programs preserve lifetime value while targeted credit screening and segmentation cut loss exposure and reserve volatility.
- Unemployment: US 4.0% (Jun 2025, BLS)
- Saving rate: ~3.5% (BEA, 2025)
- Mitigation: hardship programs, proactive collections
- Risk controls: credit screening, segmentation
Contractor market dynamics
Local wage growth (~4–5% YoY in 2024) plus fuel price volatility (average diesel ~$3.80–4.20/gal in 2024) and contractor backlog drive service delivery costs; tight markets force 10–20% higher dispatch fees or incentive premiums. Multi‑market networks blunt regional shocks, while data‑driven routing can cut unit mileage and costs by ~12–18%.
- Wages ~4–5% YoY (2024)
- Diesel ~$3.80–4.20/gal (2024)
- Dispatch/incentive uplift 10–20%
- Routing cost cut ~12–18%
Warranty rules and political risks raise compliance costs, reshape US home-protection market
Higher rates (30‑yr ~7% mid‑2025) and low refinance activity cut new‑plan sales and marketing touchpoints, while wage and parts inflation (wages ~4–5% YoY, CPI ~3.4% in 2024) raise claim costs and dispatch fees. Unemployment (4.0% Jun‑2025) and low saving rates (~3.5%) pressure cancellations and bad debt, requiring hardship programs and tighter credit segmentation.
| Metric | Value |
|---|---|
| 30‑yr rate | ~7% |
| Unemployment | 4.0% |
| Wage growth | 4–5% |
What You See Is What You Get
Frontdoor PESTLE Analysis
The preview shown here is the exact Frontdoor PESTLE Analysis you’ll receive after purchase—fully formatted and ready to use. The content, layout, and insights are final with no placeholders or edits needed. After checkout you’ll instantly download this exact professionally structured document.

Original: $10.00
-65%$10.00
$3.50Product Information
Product Information
Shipping & Returns
Shipping & Returns
Description
Make Smarter Strategic Decisions with a Complete PESTEL View
Gain a competitive edge with our focused PESTLE Analysis of Frontdoor that reveals how political, economic, social, technological, legal, and environmental forces shape its outlook. Perfect for investors and strategists, this concise report highlights risks and growth levers. Purchase the full version now for the complete, actionable breakdown.
Political factors
State-level regulation of service contracts
Frontdoor (NASDAQ: FTDR) operates under state-specific home service contract rules across all 50 states, which govern coverage terms, disclosures and reserve requirements.
Regulatory variability increases compliance complexity and operational costs and can force product redesigns when large states such as California and Texas (≈68.6 million residents combined) change policy.
Proactive engagement with state regulators helps mitigate rapid adverse rulemaking that would otherwise pressure pricing and capital reserves.
Housing and homeownership policy direction
Federal and state incentives shape demand for Frontdoor home warranties: the US homeownership rate was about 65.5% in 2024 (Census), while US home improvement spending was roughly $450B in 2023 (JCHS), both supporting warranty uptake. Programs that increase housing turnover expand addressable customers; conversely, affordability constraints or cuts to incentives can slow plan sales. Monitoring policy agendas helps align sales, pricing and partnership strategies.
Disaster relief and resilience funding
Public disaster relief and resilience funding shapes Frontdoor repair demand and contractor availability; FEMA's BRIC program awarded about $1.4 billion in FY2024 and federal disaster assistance exceeded $40 billion across recent major events, boosting large-scale recovery work. Subsidies and grant programs that cover portions of mitigation or repairs can materially lower out‑of‑pocket costs, supporting plan adoption. Extended relief timelines and federal/state coordination often delay private repairs, shifting claim timing and cash flow. Close collaboration with local authorities improves service continuity and access to prioritized contract work.
Trade and tariff impacts on parts
Tariffs on appliances and components (US Section 301 tariffs up to 25%) raise replacement costs and increase claim severities; higher input prices compress margins for plan providers. Import disruptions have extended repair timelines, with supply-chain delays persisting into 2024. Sourcing diversification is used as a political-risk hedge. Cost pass-through requires careful pricing and proactive customer communication.
- Tariffs: Section 301 up to 25%
- Repair delays: supply-chain disruptions into 2024
- Diversification: political-risk hedge
- Pricing: cautious cost pass-through, clear communication
Labor and immigration policy shaping contractor supply
Tighter labor and immigration policies can shrink skilled trades supply, pushing service costs up and slowing dispatch; US construction employment was about 7.5 million in 2024 (BLS), amplifying sensitivity to labor shifts. Expanded H-2B visas (cap 66,000) or DOL apprenticeship funding (about 1.35 billion USD in 2023) can relieve constraints. Political swings drive regional contractor variability, so capacity planning must model policy-risk scenarios.
- Policy tightening raises costs & delays
- H-2B cap 66,000 — limits seasonal hires
- $1.35B DOL apprenticeship grants (2023) ease shortages
- Plan capacity for regional policy variance
Warranty rules and political risks raise compliance costs, reshape US home-protection market
Frontdoor faces state-by-state warranty regulation (CA+TX ≈68.6M residents) that raises compliance costs and forces product redesigns.
Federal/state incentives and market size support demand (US homeownership 65.5% in 2024; US home improvement ≈$450B in 2023) but affordability shifts can reduce plan sales.
Political risks—tariffs up to 25%, FEMA BRIC $1.4B FY2024, disaster aid >$40B, H-2B cap 66,000—affect parts costs, claims timing and contractor availability.
| Metric | Value |
|---|---|
| CA+TX pop | ≈68.6M |
| Homeownership (2024) | 65.5% |
| Home improvement (2023) | $450B |
| Tariffs | up to 25% |
| BRIC FY2024 | $1.4B |
| H-2B cap | 66,000 |
What is included in the product
Detailed Word Document
Explores how political, economic, social, technological, environmental and legal forces uniquely affect Frontdoor, with each section backed by data, trends and specific examples to identify threats and opportunities; designed for executives and investors with forward‑looking insights ready for plans and decks.
Customizable Excel Spreadsheet
A concise, visually segmented PESTLE summary for Frontdoor that relieves time‑consuming external risk research, can be dropped into presentations or strategy packs, and is easily shared and edited with notes for regional or business‑line context.
Economic factors
Interest rates and housing turnover
Higher interest rates—30-year mortgage rates near 7% in mid-2025—suppress home sales and reduce warranty attach opportunities at closing, slowing Frontdoor plan growth. Lower refinance activity, with refinance applications still down over 60% versus 2020 peaks, cuts marketing touchpoints tied to refinancing cycles. When rates stabilize or fall, churn and new-plan growth historically rebound. Sales channels must adapt to housing-cycle timing and lender/refi flows.
Inflation in parts and labor
Materials and technician wage inflation have pushed claim costs higher—U.S. CPI averaged 3.4% in 2024 while average private-sector wage growth ran about 4.6% year-over-year, raising parts and labor expense burdens. Pricing and contract terms require more frequent updates to protect margins. Lag effects can compress profitability if not anticipated. Supplier agreements and hedges can dampen volatility.
Consumer confidence and discretionary spend
Home service plans compete with other household expenses and McKinsey 2023 found roughly 40% of consumers cut discretionary home services during downturns. Protection products can be deferred by some but valued by others for risk transfer, driving mixed demand elasticity. Clear ROI messaging boosts retention by making cost vs risk explicit, while flexible payment options (monthly/financing) support affordability and reduce churn.
Unemployment and household cash flow
Rising unemployment (US 4.0% June 2025, BLS) squeezes household cash flow, pressuring cancellations and bad debt for Frontdoor; deferred maintenance raises failure-driven claims. Proactive collections and hardship programs preserve lifetime value while targeted credit screening and segmentation cut loss exposure and reserve volatility.
- Unemployment: US 4.0% (Jun 2025, BLS)
- Saving rate: ~3.5% (BEA, 2025)
- Mitigation: hardship programs, proactive collections
- Risk controls: credit screening, segmentation
Contractor market dynamics
Local wage growth (~4–5% YoY in 2024) plus fuel price volatility (average diesel ~$3.80–4.20/gal in 2024) and contractor backlog drive service delivery costs; tight markets force 10–20% higher dispatch fees or incentive premiums. Multi‑market networks blunt regional shocks, while data‑driven routing can cut unit mileage and costs by ~12–18%.
- Wages ~4–5% YoY (2024)
- Diesel ~$3.80–4.20/gal (2024)
- Dispatch/incentive uplift 10–20%
- Routing cost cut ~12–18%
Warranty rules and political risks raise compliance costs, reshape US home-protection market
Higher rates (30‑yr ~7% mid‑2025) and low refinance activity cut new‑plan sales and marketing touchpoints, while wage and parts inflation (wages ~4–5% YoY, CPI ~3.4% in 2024) raise claim costs and dispatch fees. Unemployment (4.0% Jun‑2025) and low saving rates (~3.5%) pressure cancellations and bad debt, requiring hardship programs and tighter credit segmentation.
| Metric | Value |
|---|---|
| 30‑yr rate | ~7% |
| Unemployment | 4.0% |
| Wage growth | 4–5% |
What You See Is What You Get
Frontdoor PESTLE Analysis
The preview shown here is the exact Frontdoor PESTLE Analysis you’ll receive after purchase—fully formatted and ready to use. The content, layout, and insights are final with no placeholders or edits needed. After checkout you’ll instantly download this exact professionally structured document.











