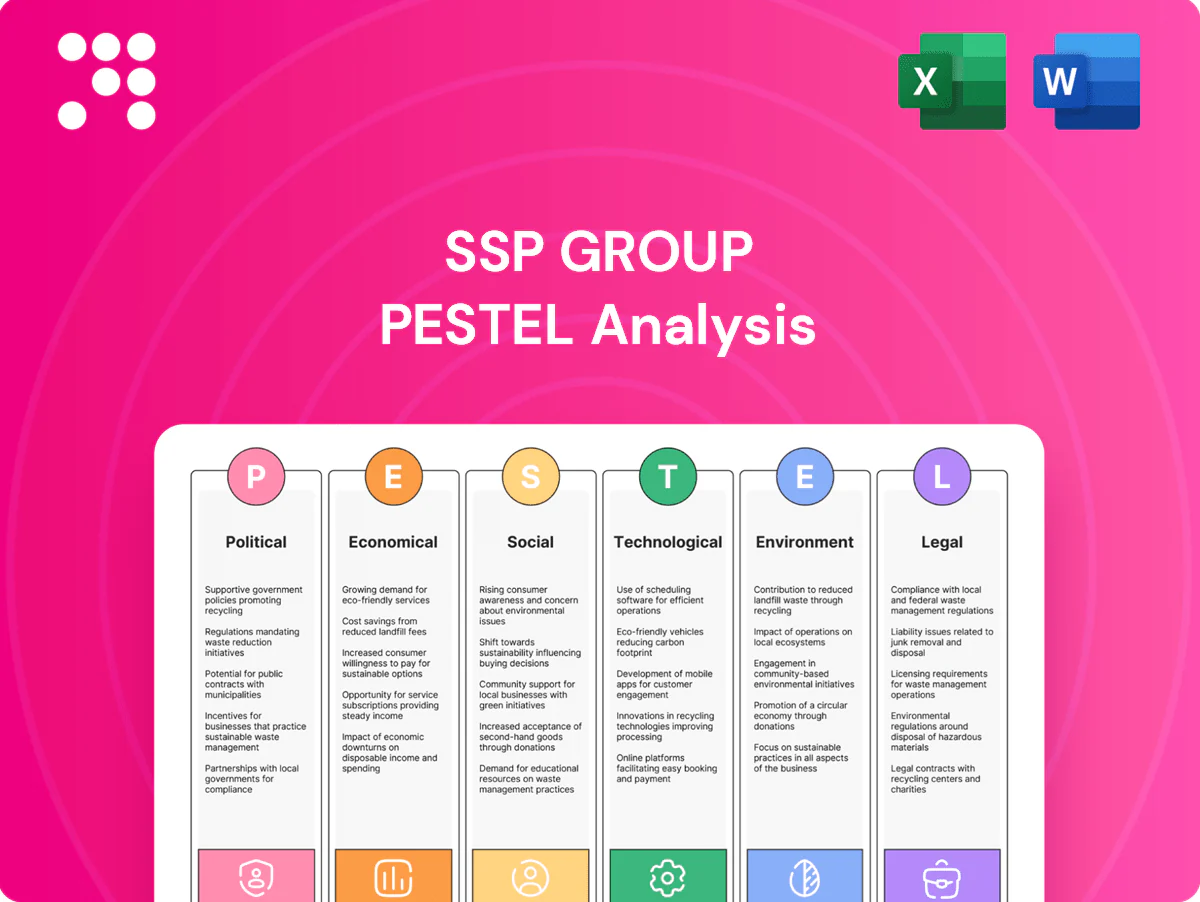
SSP Group PESTLE Analysis

Your Competitive Advantage Starts with This Report
Gain strategic advantage with our PESTLE analysis of SSP Group. We map political, economic, social, technological, legal and environmental forces shaping its travel-retail business. Ideal for investors and strategists seeking actionable insights. Purchase the full report for detailed, ready-to-use findings.
Political factors

Geopolitical stability
SSP’s volumes are highly sensitive to geopolitical shocks: IATA reported RPKs recovered to about 88% of 2019 in 2023, with further recovery into 2024, so regional tensions can swiftly reverse gains. Conflicts, sanctions or terror alerts trigger airport security escalations and demand shocks that cause sudden route suspensions and visa restrictions, producing sharp local revenue drops. SSP’s regional diversification cushions risk, while active scenario planning and flexible staffing reduce operational and cost volatility.
Airport authority policies
Concession terms, rent formulas and space allocations are typically set by public or quasi-public airport and rail authorities, with contracts increasingly specifying minimum annual guarantees (MAGs) alongside revenue-share models. Policy shifts toward MAGs or higher revenue-share tiers — sometimes exceeding 25% of gross sales in competitive hubs — can compress operator margins. Authorities may favor local brands or national champions in tender evaluations, affecting bid outcomes. Building strong authority relationships and proving passenger spend per head helps secure prime locations.

Government travel regulations
Government travel regulations — from health rules and visa regimes to customs controls — directly shape passenger throughput and dwell time; IATA reported global air traffic recovered to near 2019 levels by 2023–24, heightening sensitivity to policy shifts. Changes in security screening or liquids rules can depress convenience retail spend and complicate operations. Entry-exit digitization (eg EU EES rollout in 2024) speeds flows, cutting dwell-time-driven sales. SSP must reconfigure formats and staffing to match these policy-driven flow patterns.

Public procurement frameworks
Concessions are typically awarded via competitive tenders with direct political oversight; global public procurement equals roughly 12% of GDP (World Bank). Transparency and local-content expectations—frequently 20–40% in emerging markets—influence award criteria and partner structures, while electoral cycles commonly delay awards or renegotiations. Strong compliance and local joint ventures boost tender competitiveness.
- Competitive tenders with political oversight
- Public procurement ~12% of GDP
- Local content often 20–40%
- Political cycles can delay awards
- Compliance + local JVs improve odds
Subsidies and support schemes
Government relief such as airport fee waivers and crisis-specific support (IATA estimated $123bn to aviation in 2020) can cushion SSP Group's travel-dependent revenues; removal of subsidies or higher business rates would raise operating costs. Country-by-country food inflation varies—UK food inflation peaked at 19.1% in 2022—affecting input prices. Monitoring fiscal policy enables timely pricing and sourcing responses.
Airport retail: volatile demand ~88% RPKs, margin squeeze from revenue-shares & tenders
SSP faces rapid demand swings from geopolitical shocks (IATA RPKs ~88% of 2019 in 2023), while concession economics (MAGs, revenue-shares) and procurement rules drive margin pressure. Travel/health rules and entry-exit digitization change dwell times and spend. Local-content and electoral cycles affect tender timing and partner choice.
| Factor | Metric | Impact |
|---|---|---|
| RPKs | ~88% (2023) | Demand volatility |
| Revenue-share/MAGs | >25% in hubs | Margin compression |
| Procurement | ~12% GDP | Tender rules |
| Local content | 20–40% | Award criteria |
What is included in the product
 Detailed Word Document
Explores how Political, Economic, Social, Technological, Environmental, and Legal forces uniquely impact SSP Group’s travel-foodservice operations, linking industry trends, regional regulations, and consumer behavior to revenue and cost drivers. Each dimension includes data-backed risks, opportunities, and forward-looking insights to support strategic planning and investor communication.

 Customizable Excel Spreadsheet
A concise, visually segmented PESTLE summary of SSP Group for quick referencing in meetings or PowerPoints, easing alignment across teams. Editable notes let users localize risks and opportunities by region or business line, speeding strategic decisions.
Economic factors

Passenger traffic cycles
Macro growth, tourism demand and airline capacity jointly drive footfall: by mid-2024 IATA noted global passenger demand had broadly returned toward pre‑pandemic levels, underpinning higher airport retail spend. Economic slowdowns cut discretionary travel and per‑passenger spend, squeezing margins for food & beverage and retail. Recovery waves remain uneven across regions and segments, with leisure outpacing corporate travel; portfolio mix should prioritise resilient corridors and major hubs to stabilize revenue.
Inflation and input costs
Food inflation (~6% in 2024), labour inflation (~7% in 2024) and higher energy costs (c.15% y/y in 2023–24) compress SSP margins where concession pricing is fixed. Index-linked rents or contractual step-ups amplify cost pressure, risking 200–400 bps margin erosion. Menu engineering, procurement scale and automation can recoup costs; clear value propositions help sustain volumes during necessary price rises.

Currency fluctuations
SSP's multi-country footprint (around 33 countries and c.2,900 outlets) creates significant FX translation and transaction exposure, with reported revenues and margins sensitive to exchange-rate moves. Currency swings — GBP moved roughly 10% vs USD/EUR in 2022–24 — raise costs for imported ingredients and compress local-currency sales when translated. Natural hedging via local sourcing and local-currency cost bases reduces volatility, while treasury policies and selective hedging (typically short-term forward cover) are used to stabilise earnings.

Airline and rail capacity
Carrier schedule changes and route openings/closures directly shift terminal footfall; IATA reported global passenger traffic recovering to near 2019 levels in 2024, concentrating volumes at hub airports. Growth of low-cost carriers, which account for roughly 40 percent of short‑haul capacity in Europe, shifts spend toward value formats. Rail modernization and station upgrades concentrate flows in key stations and peak dayparts, increasing morning and evening spend windows; continuous demand sensing reduces stockouts and aligns staffing.
- Route churn drives hourly footfall volatility
- LCCs tilt spend to lower‑margin, high‑turn formats
- Station modernization concentrates dayparts
- Real‑time demand sensing improves inventory and staffing
Consumer spending power
Consumer spending power for SSP hinges on real-wage recovery and passenger confidence—post-2022 inflation, 2024–25 saw improving real incomes and returning travel demand, which drive average ticket size and premium format uptake; in downturns value and grab-and-go formats take share. Tiered offers and bundle pricing protect mix, while dynamic pricing within concession rules optimises yield across channels.
- Real-wage recovery boosts average spend
- Premium formats gain in expansions
- Value/grab-and-go win in downturns
- Tiered bundles + dynamic pricing protect yield
Airport retail: volatile demand ~88% RPKs, margin squeeze from revenue-shares & tenders
Macro recovery to near‑2019 air traffic in 2024 lifts volumes but uneven regional demand and rising costs—food inflation ~6% (2024), labour ~7% (2024) and energy ~15% (2023–24)—compress margins; FX swings (GBP ~10% vs USD/EUR 2022–24) add translation risk. Prioritise procurement scale, local sourcing and rent-index strategies to protect 200–400 bps.
| Metric | 2023–24 |
|---|---|
| Air traffic | ~pre‑2019 (mid‑2024) |
| Food inflation | ~6% |
| Labour inflation | ~7% |
| Energy rise | ~15% |
| GBP vs USD/EUR | ~10% move (2022–24) |
Preview the Actual Deliverable
SSP Group PESTLE Analysis
The preview shown here is the exact document you’ll receive after purchase—fully formatted and ready to use. It contains a comprehensive PESTLE analysis of SSP Group covering political, economic, social, technological, legal and environmental factors with actionable insights and strategic implications. No placeholders or teasers—this is the final, downloadable file you’ll get immediately after checkout.

Original: $10.00
-65%$10.00
$3.50Product Information
Product Information
Shipping & Returns
Shipping & Returns
Description
Your Competitive Advantage Starts with This Report
Gain strategic advantage with our PESTLE analysis of SSP Group. We map political, economic, social, technological, legal and environmental forces shaping its travel-retail business. Ideal for investors and strategists seeking actionable insights. Purchase the full report for detailed, ready-to-use findings.
Political factors
Geopolitical stability
SSP’s volumes are highly sensitive to geopolitical shocks: IATA reported RPKs recovered to about 88% of 2019 in 2023, with further recovery into 2024, so regional tensions can swiftly reverse gains. Conflicts, sanctions or terror alerts trigger airport security escalations and demand shocks that cause sudden route suspensions and visa restrictions, producing sharp local revenue drops. SSP’s regional diversification cushions risk, while active scenario planning and flexible staffing reduce operational and cost volatility.
Airport authority policies
Concession terms, rent formulas and space allocations are typically set by public or quasi-public airport and rail authorities, with contracts increasingly specifying minimum annual guarantees (MAGs) alongside revenue-share models. Policy shifts toward MAGs or higher revenue-share tiers — sometimes exceeding 25% of gross sales in competitive hubs — can compress operator margins. Authorities may favor local brands or national champions in tender evaluations, affecting bid outcomes. Building strong authority relationships and proving passenger spend per head helps secure prime locations.
Government travel regulations
Government travel regulations — from health rules and visa regimes to customs controls — directly shape passenger throughput and dwell time; IATA reported global air traffic recovered to near 2019 levels by 2023–24, heightening sensitivity to policy shifts. Changes in security screening or liquids rules can depress convenience retail spend and complicate operations. Entry-exit digitization (eg EU EES rollout in 2024) speeds flows, cutting dwell-time-driven sales. SSP must reconfigure formats and staffing to match these policy-driven flow patterns.
Public procurement frameworks
Concessions are typically awarded via competitive tenders with direct political oversight; global public procurement equals roughly 12% of GDP (World Bank). Transparency and local-content expectations—frequently 20–40% in emerging markets—influence award criteria and partner structures, while electoral cycles commonly delay awards or renegotiations. Strong compliance and local joint ventures boost tender competitiveness.
- Competitive tenders with political oversight
- Public procurement ~12% of GDP
- Local content often 20–40%
- Political cycles can delay awards
- Compliance + local JVs improve odds
Subsidies and support schemes
Government relief such as airport fee waivers and crisis-specific support (IATA estimated $123bn to aviation in 2020) can cushion SSP Group's travel-dependent revenues; removal of subsidies or higher business rates would raise operating costs. Country-by-country food inflation varies—UK food inflation peaked at 19.1% in 2022—affecting input prices. Monitoring fiscal policy enables timely pricing and sourcing responses.
Airport retail: volatile demand ~88% RPKs, margin squeeze from revenue-shares & tenders
SSP faces rapid demand swings from geopolitical shocks (IATA RPKs ~88% of 2019 in 2023), while concession economics (MAGs, revenue-shares) and procurement rules drive margin pressure. Travel/health rules and entry-exit digitization change dwell times and spend. Local-content and electoral cycles affect tender timing and partner choice.
| Factor | Metric | Impact |
|---|---|---|
| RPKs | ~88% (2023) | Demand volatility |
| Revenue-share/MAGs | >25% in hubs | Margin compression |
| Procurement | ~12% GDP | Tender rules |
| Local content | 20–40% | Award criteria |
What is included in the product
Detailed Word Document
Explores how Political, Economic, Social, Technological, Environmental, and Legal forces uniquely impact SSP Group’s travel-foodservice operations, linking industry trends, regional regulations, and consumer behavior to revenue and cost drivers. Each dimension includes data-backed risks, opportunities, and forward-looking insights to support strategic planning and investor communication.
Customizable Excel Spreadsheet
A concise, visually segmented PESTLE summary of SSP Group for quick referencing in meetings or PowerPoints, easing alignment across teams. Editable notes let users localize risks and opportunities by region or business line, speeding strategic decisions.
Economic factors
Passenger traffic cycles
Macro growth, tourism demand and airline capacity jointly drive footfall: by mid-2024 IATA noted global passenger demand had broadly returned toward pre‑pandemic levels, underpinning higher airport retail spend. Economic slowdowns cut discretionary travel and per‑passenger spend, squeezing margins for food & beverage and retail. Recovery waves remain uneven across regions and segments, with leisure outpacing corporate travel; portfolio mix should prioritise resilient corridors and major hubs to stabilize revenue.
Inflation and input costs
Food inflation (~6% in 2024), labour inflation (~7% in 2024) and higher energy costs (c.15% y/y in 2023–24) compress SSP margins where concession pricing is fixed. Index-linked rents or contractual step-ups amplify cost pressure, risking 200–400 bps margin erosion. Menu engineering, procurement scale and automation can recoup costs; clear value propositions help sustain volumes during necessary price rises.
Currency fluctuations
SSP's multi-country footprint (around 33 countries and c.2,900 outlets) creates significant FX translation and transaction exposure, with reported revenues and margins sensitive to exchange-rate moves. Currency swings — GBP moved roughly 10% vs USD/EUR in 2022–24 — raise costs for imported ingredients and compress local-currency sales when translated. Natural hedging via local sourcing and local-currency cost bases reduces volatility, while treasury policies and selective hedging (typically short-term forward cover) are used to stabilise earnings.
Airline and rail capacity
Carrier schedule changes and route openings/closures directly shift terminal footfall; IATA reported global passenger traffic recovering to near 2019 levels in 2024, concentrating volumes at hub airports. Growth of low-cost carriers, which account for roughly 40 percent of short‑haul capacity in Europe, shifts spend toward value formats. Rail modernization and station upgrades concentrate flows in key stations and peak dayparts, increasing morning and evening spend windows; continuous demand sensing reduces stockouts and aligns staffing.
- Route churn drives hourly footfall volatility
- LCCs tilt spend to lower‑margin, high‑turn formats
- Station modernization concentrates dayparts
- Real‑time demand sensing improves inventory and staffing
Consumer spending power
Consumer spending power for SSP hinges on real-wage recovery and passenger confidence—post-2022 inflation, 2024–25 saw improving real incomes and returning travel demand, which drive average ticket size and premium format uptake; in downturns value and grab-and-go formats take share. Tiered offers and bundle pricing protect mix, while dynamic pricing within concession rules optimises yield across channels.
- Real-wage recovery boosts average spend
- Premium formats gain in expansions
- Value/grab-and-go win in downturns
- Tiered bundles + dynamic pricing protect yield
Airport retail: volatile demand ~88% RPKs, margin squeeze from revenue-shares & tenders
Macro recovery to near‑2019 air traffic in 2024 lifts volumes but uneven regional demand and rising costs—food inflation ~6% (2024), labour ~7% (2024) and energy ~15% (2023–24)—compress margins; FX swings (GBP ~10% vs USD/EUR 2022–24) add translation risk. Prioritise procurement scale, local sourcing and rent-index strategies to protect 200–400 bps.
| Metric | 2023–24 |
|---|---|
| Air traffic | ~pre‑2019 (mid‑2024) |
| Food inflation | ~6% |
| Labour inflation | ~7% |
| Energy rise | ~15% |
| GBP vs USD/EUR | ~10% move (2022–24) |
Preview the Actual Deliverable
SSP Group PESTLE Analysis
The preview shown here is the exact document you’ll receive after purchase—fully formatted and ready to use. It contains a comprehensive PESTLE analysis of SSP Group covering political, economic, social, technological, legal and environmental factors with actionable insights and strategic implications. No placeholders or teasers—this is the final, downloadable file you’ll get immediately after checkout.











