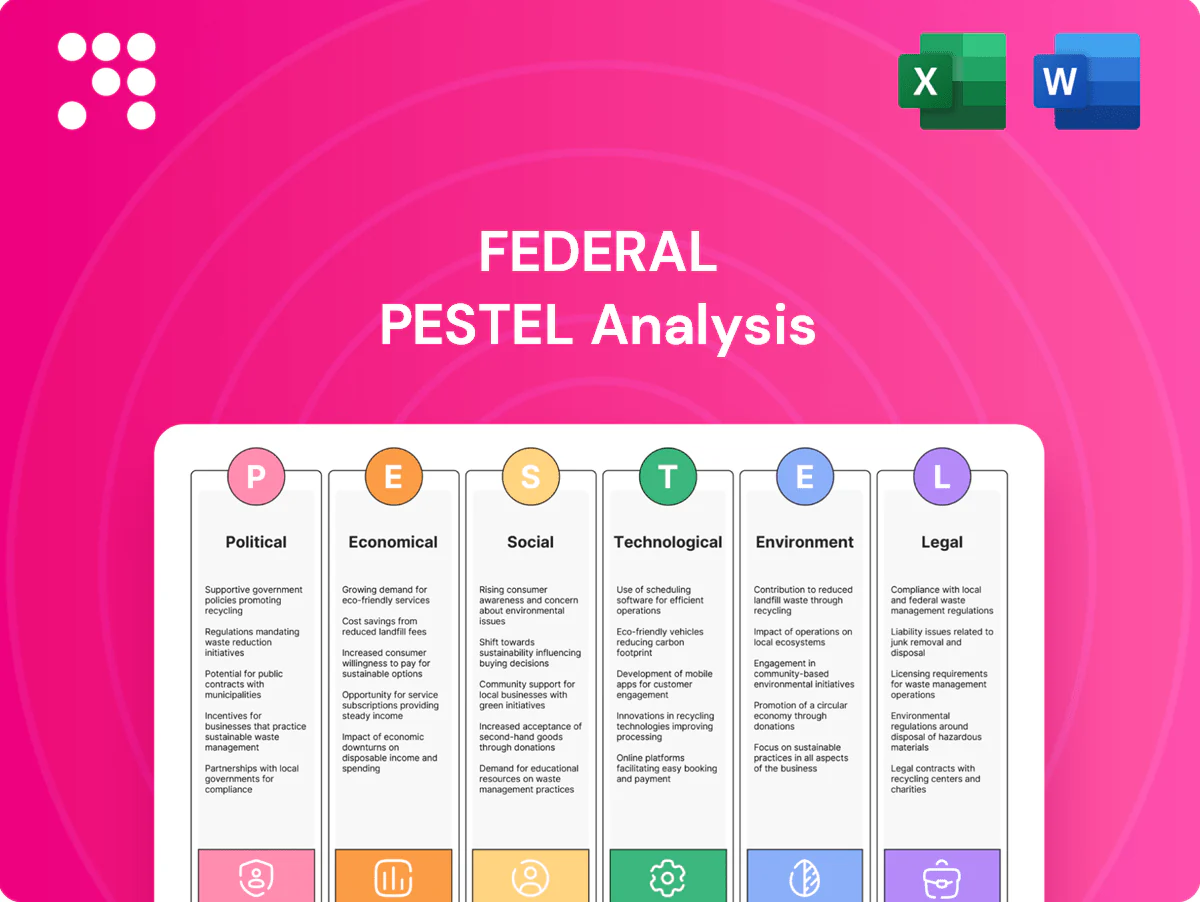
Federal PESTLE Analysis

Your Competitive Advantage Starts with This Report
Unlock competitive advantage with our concise PESTLE Analysis of Federal—revealing how political shifts, economic trends, and tech disruption will shape its trajectory. Ideal for investors and strategists seeking actionable context, this report distills risks and opportunities into clear, decision-ready insights. Purchase the full version to access the complete, editable analysis and make smarter strategic moves today.
Political factors

Zoning and land-use approvals
Entitlements for mixed-use projects hinge on municipal zoning boards and community review; approvals commonly take 12–36 months for major projects. Delays or denials raise carrying costs and can add months to years to timelines, often increasing financing costs materially. Proactive engagement and aligning projects with local comprehensive plans accelerates approvals. Political shifts can reset priorities mid-project, forcing redesigns or mitigation requirements.
Local incentives and redevelopment policies
TIFs, tax abatements and Main Street revitalization grants can lift project IRRs by roughly 2–10 percentage points, improving feasibility and lender metrics. Availability varies widely across coastal municipalities—New York, Los Angeles and Miami offer expansive packages while smaller coastal towns often do not. Demonstrating job creation and public-realm upgrades materially increases political support, but policy reversals or budget cuts can quickly remove anticipated benefits.

Public infrastructure and transit investment
Transit expansions and streetscape upgrades—backed by the Bipartisan Infrastructure Law’s $1.2 trillion package with tens of billions for transit—can boost foot traffic and tenant sales by up to 10–15%, but competing capital priorities often defer nearby improvements. Public-private partnerships have shortened delivery risk, and shifts in federal or state funding commonly delay project timelines by 1–3 years.

State and local tax regimes
- Property tax revenue: >$500B (Census 2022)
- High-rate example: New Jersey ~2.21% effective rate (2024)
- Key levers: assessments, appeals, transfer taxes, development fees
Public safety and urban governance
Perceptions of safety directly affect retailer demand and shopper visitation, with retailers citing organized retail crime losses exceeding about 94 billion annually in recent NRF surveys, driving tighter store formats and security spend. City policies on policing, homelessness and street vending reshape operating costs and footfall; over 1,000 US business improvement districts (BIDs) often partner with cities to mitigate risks. Political turnover alters enforcement intensity and can rapidly change compliance costs for retailers.
- Retailer losses ~94 billion (NRF recent survey)
- Over 1,000 US BIDs active in mitigation
- Policing/homelessness/street-vending rules shape operating conditions
- Political turnover → variable enforcement and compliance costs
Infra funding lifts retail 10–15%; entitlements 12–36 months can add 1–3 years
Entitlements often take 12–36 months; delays raise carrying costs and can add 1–3 years to timelines. Federal Bipartisan Infrastructure Law ($1.2T) and transit funding (tens of billions) can lift retail foot traffic 10–15% and project values; TIFs/abatements may boost IRRs ~2–10ppt. Property tax revenue >$500B (Census 2022); NJ effective rate ~2.21% (2024).
| Metric | Value/Range |
|---|---|
| Entitlement timeline | 12–36 months |
| Delay impact | +1–3 years |
| Infra funding | $1.2T BIL, transit tens of $B |
| Property tax revenue | >$500B (2022) |
| NJ effective rate | ~2.21% (2024) |
What is included in the product
 Detailed Word Document
Explores how Political, Economic, Social, Technological, Environmental and Legal forces uniquely impact the Federal, with data-backed trends and sector-specific examples to identify risks and opportunities; crafted to support executives, consultants and investors in strategic planning and funding decisions.

 Customizable Excel Spreadsheet
A concise, visually segmented Federal PESTLE summary that’s editable and shareable—ready to drop into presentations or planning sessions to align teams, inform external risk discussions, and speed decision-making.
Economic factors

Interest rates and capital costs
REIT valuations and development feasibility are highly rate-sensitive as higher borrowing costs compress project IRRs; the US federal funds target sat at 5.25–5.50% in July 2025 and the 10-year Treasury was near 4.1%, lifting cap‑rate floors. Rising debt costs squeeze spreads and push cap rates higher. Laddered maturities and fixed‑rate coverage improve cash‑flow stability. Ready access to equity markets dictates growth pacing and recapitalization options.
Consumer spending and retailer health
Discretionary spend drives tenant sales and occupancy—US retail sales rose 3.8% YoY in 2024 (Census Bureau), supporting malls but leaving boutique and luxury segments volatile. Inflation averaged about 3.4% in 2024 and average hourly earnings rose ~4.2% (BLS), squeezing retailer margins and credit quality. Curating category mix toward needs-based and experiential reduces cyclicality, while co-tenancy provisions can amplify shocks via rent reductions or closures.

Construction costs and supply chain
In 2024-25 materials and labor volatility continue to compress redevelopment yields as input price swings and labor shortages raise capex risk. Longer lead times for critical components can push back revenue start dates by months. GMP contracts and value engineering are widely used to protect returns. Periodic market slack offers cost-saving windows for phased execution.

E-commerce and omnichannel dynamics
E-commerce made up about 16% of US retail sales in 2024; click-and-collect and returns traffic now bolster footfall in prime nodes, sustaining physical retail demand. Commodity retailers face margin pressure—grocers' operating margins near 2–3% in 2024—driving potential downsizing. The mix-shift to services, dining and entertainment accounted for roughly 20% of shopping-center leasing in 2024, while proximity to logistics hubs can command rent premiums up to 10% per CBRE/MSCI 2024, enhancing leasing appeal.
- Click-and-collect/returns support footfall
- Commodity retail margins ~2–3% — downsizing risk
- Services/dining ~20% of leasing mix (2024)
- Logistics proximity → rent premium up to 10%
Market liquidity and transaction pricing
In the current macro regime with the Fed funds rate at roughly 5.25–5.50% (mid‑2024–2025), bid‑ask spreads have widened—often 20–60 bps for non‑core CRE—slowing acquisitions and dispositions while prime coastal assets retain relative pricing power with cap‑rate spreads ~100–150 bps tighter versus second‑tier markets.
- Recycling capital: needs stable buyer pools; transaction volumes remain constrained
- Appraisals: downward moves compress leverage capacity and tighten LTVs
- Pricing: prime coastal assets show resilience vs widening spreads
Infra funding lifts retail 10–15%; entitlements 12–36 months can add 1–3 years
Higher rates (Fed funds 5.25–5.50% Jul 2025; 10y ~4.1%) and elevated inflation (3.4% in 2024) raise cap‑rate floors and compress REIT/development IRRs, while retail sales (+3.8% YoY 2024) and wages (+4.2% avg hourly 2024) support demand but squeeze margins. E‑commerce ~16% of sales and services/dining ~20% of leasing shift mix; bid/ask spreads widened 20–60 bps for non‑core.
| Metric | Value |
|---|---|
| Fed funds (Jul 2025) | 5.25–5.50% |
| 10‑yr Treasury | ~4.1% |
| Inflation (2024) | 3.4% |
| Retail sales YoY (2024) | +3.8% |
| E‑commerce (2024) | ~16% |
| Services/dining leasing (2024) | ~20% |
| Grocery margins (2024) | ~2–3% |
What You See Is What You Get
Federal PESTLE Analysis
The preview shown here is the exact Federal PESTLE Analysis document you’ll receive after purchase—fully formatted, professionally structured, and ready to use. This is the real file with no placeholders or teasers, containing the full content and layout displayed. After payment you’ll be able to download this same finished document immediately.

Product Information
Product Information
Shipping & Returns
Shipping & Returns
Description
Your Competitive Advantage Starts with This Report
Unlock competitive advantage with our concise PESTLE Analysis of Federal—revealing how political shifts, economic trends, and tech disruption will shape its trajectory. Ideal for investors and strategists seeking actionable context, this report distills risks and opportunities into clear, decision-ready insights. Purchase the full version to access the complete, editable analysis and make smarter strategic moves today.
Political factors
Zoning and land-use approvals
Entitlements for mixed-use projects hinge on municipal zoning boards and community review; approvals commonly take 12–36 months for major projects. Delays or denials raise carrying costs and can add months to years to timelines, often increasing financing costs materially. Proactive engagement and aligning projects with local comprehensive plans accelerates approvals. Political shifts can reset priorities mid-project, forcing redesigns or mitigation requirements.
Local incentives and redevelopment policies
TIFs, tax abatements and Main Street revitalization grants can lift project IRRs by roughly 2–10 percentage points, improving feasibility and lender metrics. Availability varies widely across coastal municipalities—New York, Los Angeles and Miami offer expansive packages while smaller coastal towns often do not. Demonstrating job creation and public-realm upgrades materially increases political support, but policy reversals or budget cuts can quickly remove anticipated benefits.
Public infrastructure and transit investment
Transit expansions and streetscape upgrades—backed by the Bipartisan Infrastructure Law’s $1.2 trillion package with tens of billions for transit—can boost foot traffic and tenant sales by up to 10–15%, but competing capital priorities often defer nearby improvements. Public-private partnerships have shortened delivery risk, and shifts in federal or state funding commonly delay project timelines by 1–3 years.
State and local tax regimes
- Property tax revenue: >$500B (Census 2022)
- High-rate example: New Jersey ~2.21% effective rate (2024)
- Key levers: assessments, appeals, transfer taxes, development fees
Public safety and urban governance
Perceptions of safety directly affect retailer demand and shopper visitation, with retailers citing organized retail crime losses exceeding about 94 billion annually in recent NRF surveys, driving tighter store formats and security spend. City policies on policing, homelessness and street vending reshape operating costs and footfall; over 1,000 US business improvement districts (BIDs) often partner with cities to mitigate risks. Political turnover alters enforcement intensity and can rapidly change compliance costs for retailers.
- Retailer losses ~94 billion (NRF recent survey)
- Over 1,000 US BIDs active in mitigation
- Policing/homelessness/street-vending rules shape operating conditions
- Political turnover → variable enforcement and compliance costs
Infra funding lifts retail 10–15%; entitlements 12–36 months can add 1–3 years
Entitlements often take 12–36 months; delays raise carrying costs and can add 1–3 years to timelines. Federal Bipartisan Infrastructure Law ($1.2T) and transit funding (tens of billions) can lift retail foot traffic 10–15% and project values; TIFs/abatements may boost IRRs ~2–10ppt. Property tax revenue >$500B (Census 2022); NJ effective rate ~2.21% (2024).
| Metric | Value/Range |
|---|---|
| Entitlement timeline | 12–36 months |
| Delay impact | +1–3 years |
| Infra funding | $1.2T BIL, transit tens of $B |
| Property tax revenue | >$500B (2022) |
| NJ effective rate | ~2.21% (2024) |
What is included in the product
Detailed Word Document
Explores how Political, Economic, Social, Technological, Environmental and Legal forces uniquely impact the Federal, with data-backed trends and sector-specific examples to identify risks and opportunities; crafted to support executives, consultants and investors in strategic planning and funding decisions.
Customizable Excel Spreadsheet
A concise, visually segmented Federal PESTLE summary that’s editable and shareable—ready to drop into presentations or planning sessions to align teams, inform external risk discussions, and speed decision-making.
Economic factors
Interest rates and capital costs
REIT valuations and development feasibility are highly rate-sensitive as higher borrowing costs compress project IRRs; the US federal funds target sat at 5.25–5.50% in July 2025 and the 10-year Treasury was near 4.1%, lifting cap‑rate floors. Rising debt costs squeeze spreads and push cap rates higher. Laddered maturities and fixed‑rate coverage improve cash‑flow stability. Ready access to equity markets dictates growth pacing and recapitalization options.
Consumer spending and retailer health
Discretionary spend drives tenant sales and occupancy—US retail sales rose 3.8% YoY in 2024 (Census Bureau), supporting malls but leaving boutique and luxury segments volatile. Inflation averaged about 3.4% in 2024 and average hourly earnings rose ~4.2% (BLS), squeezing retailer margins and credit quality. Curating category mix toward needs-based and experiential reduces cyclicality, while co-tenancy provisions can amplify shocks via rent reductions or closures.
Construction costs and supply chain
In 2024-25 materials and labor volatility continue to compress redevelopment yields as input price swings and labor shortages raise capex risk. Longer lead times for critical components can push back revenue start dates by months. GMP contracts and value engineering are widely used to protect returns. Periodic market slack offers cost-saving windows for phased execution.
E-commerce and omnichannel dynamics
E-commerce made up about 16% of US retail sales in 2024; click-and-collect and returns traffic now bolster footfall in prime nodes, sustaining physical retail demand. Commodity retailers face margin pressure—grocers' operating margins near 2–3% in 2024—driving potential downsizing. The mix-shift to services, dining and entertainment accounted for roughly 20% of shopping-center leasing in 2024, while proximity to logistics hubs can command rent premiums up to 10% per CBRE/MSCI 2024, enhancing leasing appeal.
- Click-and-collect/returns support footfall
- Commodity retail margins ~2–3% — downsizing risk
- Services/dining ~20% of leasing mix (2024)
- Logistics proximity → rent premium up to 10%
Market liquidity and transaction pricing
In the current macro regime with the Fed funds rate at roughly 5.25–5.50% (mid‑2024–2025), bid‑ask spreads have widened—often 20–60 bps for non‑core CRE—slowing acquisitions and dispositions while prime coastal assets retain relative pricing power with cap‑rate spreads ~100–150 bps tighter versus second‑tier markets.
- Recycling capital: needs stable buyer pools; transaction volumes remain constrained
- Appraisals: downward moves compress leverage capacity and tighten LTVs
- Pricing: prime coastal assets show resilience vs widening spreads
Infra funding lifts retail 10–15%; entitlements 12–36 months can add 1–3 years
Higher rates (Fed funds 5.25–5.50% Jul 2025; 10y ~4.1%) and elevated inflation (3.4% in 2024) raise cap‑rate floors and compress REIT/development IRRs, while retail sales (+3.8% YoY 2024) and wages (+4.2% avg hourly 2024) support demand but squeeze margins. E‑commerce ~16% of sales and services/dining ~20% of leasing shift mix; bid/ask spreads widened 20–60 bps for non‑core.
| Metric | Value |
|---|---|
| Fed funds (Jul 2025) | 5.25–5.50% |
| 10‑yr Treasury | ~4.1% |
| Inflation (2024) | 3.4% |
| Retail sales YoY (2024) | +3.8% |
| E‑commerce (2024) | ~16% |
| Services/dining leasing (2024) | ~20% |
| Grocery margins (2024) | ~2–3% |
What You See Is What You Get
Federal PESTLE Analysis
The preview shown here is the exact Federal PESTLE Analysis document you’ll receive after purchase—fully formatted, professionally structured, and ready to use. This is the real file with no placeholders or teasers, containing the full content and layout displayed. After payment you’ll be able to download this same finished document immediately.











