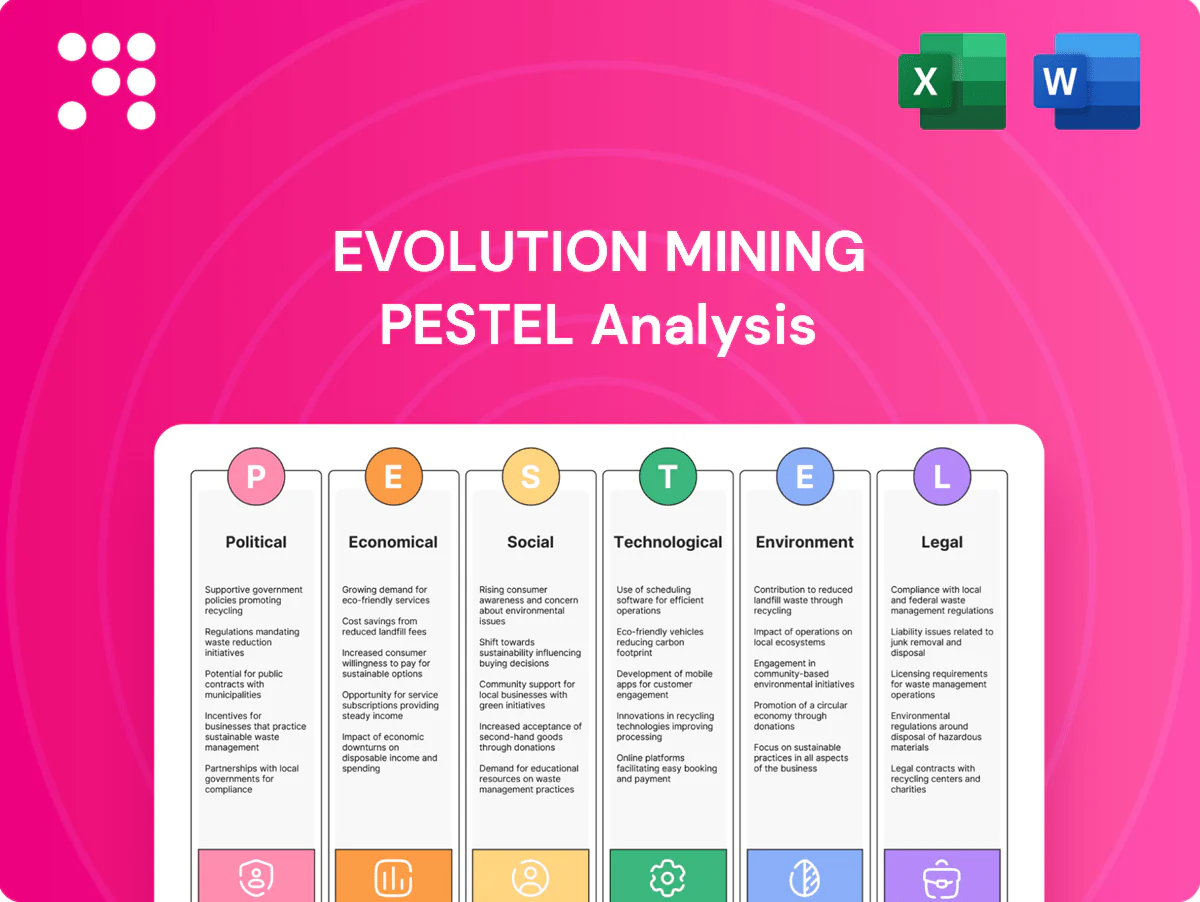
Evolution Mining PESTLE Analysis

Skip the Research. Get the Strategy.
Unlock strategic clarity with our PESTLE analysis of Evolution Mining—three decades of regulatory, economic, and environmental trends distilled into actionable insights. See how external forces will shape operations, costs, and growth opportunities. Purchase the full report for the complete, editable breakdown and make smarter, faster decisions.
Political factors

Stability of Australia/Canada regimes
Stable, mining-friendly democracies in Australia and Canada lower sovereign risk for Evolution Mining’s multi-year projects, supporting planning and permitting; Evolution produced about 1.13Moz of gold in FY2024 and had a market cap near AU$8.2bn in mid-2025. Predictable policy signals aid capital allocation and project timelines, though elections and state/provincial shifts can change royalty or permitting settings. Evolution benefits from regulatory clarity but must sustain active government relations and monitoring.
Royalties and taxation settings
Royalty rates and resource-rent style top-ups directly compress Evolution Mining margins and project NPV; Australian gold royalties typically sit in a 2–5% range and modelling shows a 1 percentage-point royalty rise can reduce NPV by roughly 5–15% on greenfield projects. Periodic fiscal reviews have historically increased effective take by 1–2 ppt, raising cutoff grades and shortening mine lives. Targeted incentives for critical minerals or regional development (grants/credits often A$5–20m) can partially offset costs, and proactive industry advocacy helps shape balanced frameworks.

Permitting timelines and approvals
Environmental and land-access approvals are a key schedule risk for Evolution Mining, with Commonwealth EPBC Act referral decisions generally due within 20 business days, but full assessments often extending months and delaying cash flows. Delays inflate pre-production costs and defer revenue, pressuring project economics; parallel processing of state and federal approvals can help preserve project IRR. Early engagement and robust baseline studies shorten timelines and reduce rework during assessment.

Indigenous and community engagement policy
Evolution Mining’s access to assets such as Cowal (NSW) and Mungari (WA) is shaped by government expectations for First Nations agreements; Australia’s Indigenous population was 3.8% in the 2021 census.
Robust co-benefit agreements lower disruption risk and bolster social licence; evolving state policies raise consent and benefit-sharing standards, while strategic partnerships can unlock exploration corridors.
- Government expectations: access continuity
- Co-benefits: lower disruption, stronger social licence
- Policy trend: higher consent/benefit requirements
- Strategy: partnerships to open corridors
Trade, energy, and infrastructure policies
Energy transition incentives under Australia s net zero by 2050 commitment are accelerating grid connections and onsite renewable uptake at mining sites, improving scope for hybrid diesel-solar systems at Evolution s operations.
Trade policies and tariff settings drive equipment import costs and supply reliability, while targeted public infrastructure funding for regional roads and ports enhances logistics to remote mines; policy volatility forces more flexible procurement and supply contracts.
- net zero by 2050
- renewable-ready grid access
- tariff and trade risk
- infrastructure improves logistics
- flexible procurement required
Stable Australia/Canada policy, royalties risk NPV; FY24 output 1.13Moz
Stable Australia/Canada policy supports Evolution (FY2024 production 1.13Moz; market cap ~AU$8.2bn mid-2025) but elections and royalty shifts (typical 2–5%) can cut NPV (1ppt ≈5–15%). EPBC referrals target 20 business days; full assessments often take months. Net zero by 2050 drives renewables uptake; A$5–20m incentives can offset costs.
| Indicator | Value |
|---|---|
| Production FY2024 | 1.13Moz |
| Market cap (mid‑2025) | AU$8.2bn |
| Royalty range | 2–5% |
| NPV sensitivity | 1ppt ≈5–15% |
| EPBC referral | 20 business days |
| Indigenous pop | 3.8% |
| Incentives | A$5–20m |
What is included in the product
 Detailed Word Document
Explores how external macro-environmental factors uniquely affect the Evolution Mining across six dimensions—Political, Economic, Social, Technological, Environmental, and Legal—linking each to regional market and regulatory dynamics. Backed by data and forward-looking insights, it helps executives and investors identify actionable risks and opportunities for strategic planning.

 Customizable Excel Spreadsheet
Provides a clean, visually segmented PESTLE summary of Evolution Mining that’s easy to drop into presentations or share across teams, helping stakeholders quickly assess external risks and market positioning while allowing notes for regional or business-line context.
Economic factors

Gold price volatility
Evolution's revenue is highly sensitive to USD gold prices—gold traded near US$2,300/oz in mid‑2025 while Evolution produced ~640 koz in FY2024, so price swings materially impact free cash flow and hedging needs. Volatility alters reserve economics and timing of expansions; downside cycles force strict cost discipline, while sustained upside supports organic growth and M&A. Scenario planning underpins resilient budgeting and capital allocation.
FX movements AUD/USD and CAD/USD
Costs are largely in AUD and CAD while gold sales are USD-priced; with AUD/USD ≈0.66 and CAD/USD ≈0.75 (July 2025), Evolution has partial natural hedges but remains exposed. Depreciation of AUD/CAD versus USD cushions local costs, lowering USD unit costs. Sharp FX moves can swing unit costs and reported AUD earnings materially. Prudent hedging programs smooth cash flows and protect margins.

Inflation and input costs
Mining inflation in labor, reagents, steel and explosives rose c.10–15% in 2023–24, putting upward pressure on AISC; energy and diesel swings (±~25% year-on-year) materially influence operating costs. Evolution uses long-term supply contracts and hedges plus efficiency programs to dampen price spikes. Ongoing continuous improvement and productivity gains have helped sustain margins through cyclical volatility.

Interest rates and capital access
Higher interest rates (RBA cash rate about 4.35% in 2024; 10‑year Aus. bond yields near 4%) raise discount rates and financing costs, reducing project NPVs and deferring marginal deposits even as gold trades around US$2,200–2,400/oz in 2024–25.
- Higher rates → lower NPVs
- Equity risk appetite drives M&A funding
- Strong balance sheet enables countercyclical buys
- Staged development limits capital at risk
M&A and portfolio optimization
M&A and portfolio optimization allow Evolution to buy tier-1 ounces or divest non-core assets during market dislocations, leveraging mid-2025 gold at ~US$2,300/oz to justify accretive deals.
Processing-hub synergies and regional consolidation lower unit costs; discipline on valuation and integration preserves returns.
Portfolio rotation can lift average mine life and improve cost-curve position for Evolution (production ≈700–800kozpa range).
- Acquire tier-1 ounces in dislocations
- Drive synergies via hubs/regional consolidation
- Strict valuation and integration discipline
- Rotate portfolio to extend mine life, lower costs
Stable Australia/Canada policy, royalties risk NPV; FY24 output 1.13Moz
Evolution’s cash flow is highly sensitive to USD gold (~US$2,300/oz mid‑2025) and ~640 koz FY2024 production, so price and FX (AUD/USD 0.66, CAD/USD 0.75) swings materially affect AISC and earnings. Mining inflation (10–15%) and diesel volatility (~±25%) raise costs; RBA cash rate ~4.35% increases discount rates and financing costs. M&A and hub synergies mitigate risk.
| Metric | Value |
|---|---|
| Gold price | US$2,300/oz |
| Production | 640 koz (FY2024) |
| AUD/USD | 0.66 |
| RBA cash rate | 4.35% |
What You See Is What You Get
Evolution Mining PESTLE Analysis
The preview shown here is the exact Evolution Mining PESTLE Analysis you’ll receive after purchase—fully formatted and ready to use. This file is the final version with complete political, economic, social, technological, legal and environmental insights. No placeholders or teasers—what you see is what you’ll download instantly after payment.

Product Information
Product Information
Shipping & Returns
Shipping & Returns
Description
Skip the Research. Get the Strategy.
Unlock strategic clarity with our PESTLE analysis of Evolution Mining—three decades of regulatory, economic, and environmental trends distilled into actionable insights. See how external forces will shape operations, costs, and growth opportunities. Purchase the full report for the complete, editable breakdown and make smarter, faster decisions.
Political factors
Stability of Australia/Canada regimes
Stable, mining-friendly democracies in Australia and Canada lower sovereign risk for Evolution Mining’s multi-year projects, supporting planning and permitting; Evolution produced about 1.13Moz of gold in FY2024 and had a market cap near AU$8.2bn in mid-2025. Predictable policy signals aid capital allocation and project timelines, though elections and state/provincial shifts can change royalty or permitting settings. Evolution benefits from regulatory clarity but must sustain active government relations and monitoring.
Royalties and taxation settings
Royalty rates and resource-rent style top-ups directly compress Evolution Mining margins and project NPV; Australian gold royalties typically sit in a 2–5% range and modelling shows a 1 percentage-point royalty rise can reduce NPV by roughly 5–15% on greenfield projects. Periodic fiscal reviews have historically increased effective take by 1–2 ppt, raising cutoff grades and shortening mine lives. Targeted incentives for critical minerals or regional development (grants/credits often A$5–20m) can partially offset costs, and proactive industry advocacy helps shape balanced frameworks.
Permitting timelines and approvals
Environmental and land-access approvals are a key schedule risk for Evolution Mining, with Commonwealth EPBC Act referral decisions generally due within 20 business days, but full assessments often extending months and delaying cash flows. Delays inflate pre-production costs and defer revenue, pressuring project economics; parallel processing of state and federal approvals can help preserve project IRR. Early engagement and robust baseline studies shorten timelines and reduce rework during assessment.
Indigenous and community engagement policy
Evolution Mining’s access to assets such as Cowal (NSW) and Mungari (WA) is shaped by government expectations for First Nations agreements; Australia’s Indigenous population was 3.8% in the 2021 census.
Robust co-benefit agreements lower disruption risk and bolster social licence; evolving state policies raise consent and benefit-sharing standards, while strategic partnerships can unlock exploration corridors.
- Government expectations: access continuity
- Co-benefits: lower disruption, stronger social licence
- Policy trend: higher consent/benefit requirements
- Strategy: partnerships to open corridors
Trade, energy, and infrastructure policies
Energy transition incentives under Australia s net zero by 2050 commitment are accelerating grid connections and onsite renewable uptake at mining sites, improving scope for hybrid diesel-solar systems at Evolution s operations.
Trade policies and tariff settings drive equipment import costs and supply reliability, while targeted public infrastructure funding for regional roads and ports enhances logistics to remote mines; policy volatility forces more flexible procurement and supply contracts.
- net zero by 2050
- renewable-ready grid access
- tariff and trade risk
- infrastructure improves logistics
- flexible procurement required
Stable Australia/Canada policy, royalties risk NPV; FY24 output 1.13Moz
Stable Australia/Canada policy supports Evolution (FY2024 production 1.13Moz; market cap ~AU$8.2bn mid-2025) but elections and royalty shifts (typical 2–5%) can cut NPV (1ppt ≈5–15%). EPBC referrals target 20 business days; full assessments often take months. Net zero by 2050 drives renewables uptake; A$5–20m incentives can offset costs.
| Indicator | Value |
|---|---|
| Production FY2024 | 1.13Moz |
| Market cap (mid‑2025) | AU$8.2bn |
| Royalty range | 2–5% |
| NPV sensitivity | 1ppt ≈5–15% |
| EPBC referral | 20 business days |
| Indigenous pop | 3.8% |
| Incentives | A$5–20m |
What is included in the product
Detailed Word Document
Explores how external macro-environmental factors uniquely affect the Evolution Mining across six dimensions—Political, Economic, Social, Technological, Environmental, and Legal—linking each to regional market and regulatory dynamics. Backed by data and forward-looking insights, it helps executives and investors identify actionable risks and opportunities for strategic planning.
Customizable Excel Spreadsheet
Provides a clean, visually segmented PESTLE summary of Evolution Mining that’s easy to drop into presentations or share across teams, helping stakeholders quickly assess external risks and market positioning while allowing notes for regional or business-line context.
Economic factors
Gold price volatility
Evolution's revenue is highly sensitive to USD gold prices—gold traded near US$2,300/oz in mid‑2025 while Evolution produced ~640 koz in FY2024, so price swings materially impact free cash flow and hedging needs. Volatility alters reserve economics and timing of expansions; downside cycles force strict cost discipline, while sustained upside supports organic growth and M&A. Scenario planning underpins resilient budgeting and capital allocation.
FX movements AUD/USD and CAD/USD
Costs are largely in AUD and CAD while gold sales are USD-priced; with AUD/USD ≈0.66 and CAD/USD ≈0.75 (July 2025), Evolution has partial natural hedges but remains exposed. Depreciation of AUD/CAD versus USD cushions local costs, lowering USD unit costs. Sharp FX moves can swing unit costs and reported AUD earnings materially. Prudent hedging programs smooth cash flows and protect margins.
Inflation and input costs
Mining inflation in labor, reagents, steel and explosives rose c.10–15% in 2023–24, putting upward pressure on AISC; energy and diesel swings (±~25% year-on-year) materially influence operating costs. Evolution uses long-term supply contracts and hedges plus efficiency programs to dampen price spikes. Ongoing continuous improvement and productivity gains have helped sustain margins through cyclical volatility.
Interest rates and capital access
Higher interest rates (RBA cash rate about 4.35% in 2024; 10‑year Aus. bond yields near 4%) raise discount rates and financing costs, reducing project NPVs and deferring marginal deposits even as gold trades around US$2,200–2,400/oz in 2024–25.
- Higher rates → lower NPVs
- Equity risk appetite drives M&A funding
- Strong balance sheet enables countercyclical buys
- Staged development limits capital at risk
M&A and portfolio optimization
M&A and portfolio optimization allow Evolution to buy tier-1 ounces or divest non-core assets during market dislocations, leveraging mid-2025 gold at ~US$2,300/oz to justify accretive deals.
Processing-hub synergies and regional consolidation lower unit costs; discipline on valuation and integration preserves returns.
Portfolio rotation can lift average mine life and improve cost-curve position for Evolution (production ≈700–800kozpa range).
- Acquire tier-1 ounces in dislocations
- Drive synergies via hubs/regional consolidation
- Strict valuation and integration discipline
- Rotate portfolio to extend mine life, lower costs
Stable Australia/Canada policy, royalties risk NPV; FY24 output 1.13Moz
Evolution’s cash flow is highly sensitive to USD gold (~US$2,300/oz mid‑2025) and ~640 koz FY2024 production, so price and FX (AUD/USD 0.66, CAD/USD 0.75) swings materially affect AISC and earnings. Mining inflation (10–15%) and diesel volatility (~±25%) raise costs; RBA cash rate ~4.35% increases discount rates and financing costs. M&A and hub synergies mitigate risk.
| Metric | Value |
|---|---|
| Gold price | US$2,300/oz |
| Production | 640 koz (FY2024) |
| AUD/USD | 0.66 |
| RBA cash rate | 4.35% |
What You See Is What You Get
Evolution Mining PESTLE Analysis
The preview shown here is the exact Evolution Mining PESTLE Analysis you’ll receive after purchase—fully formatted and ready to use. This file is the final version with complete political, economic, social, technological, legal and environmental insights. No placeholders or teasers—what you see is what you’ll download instantly after payment.











