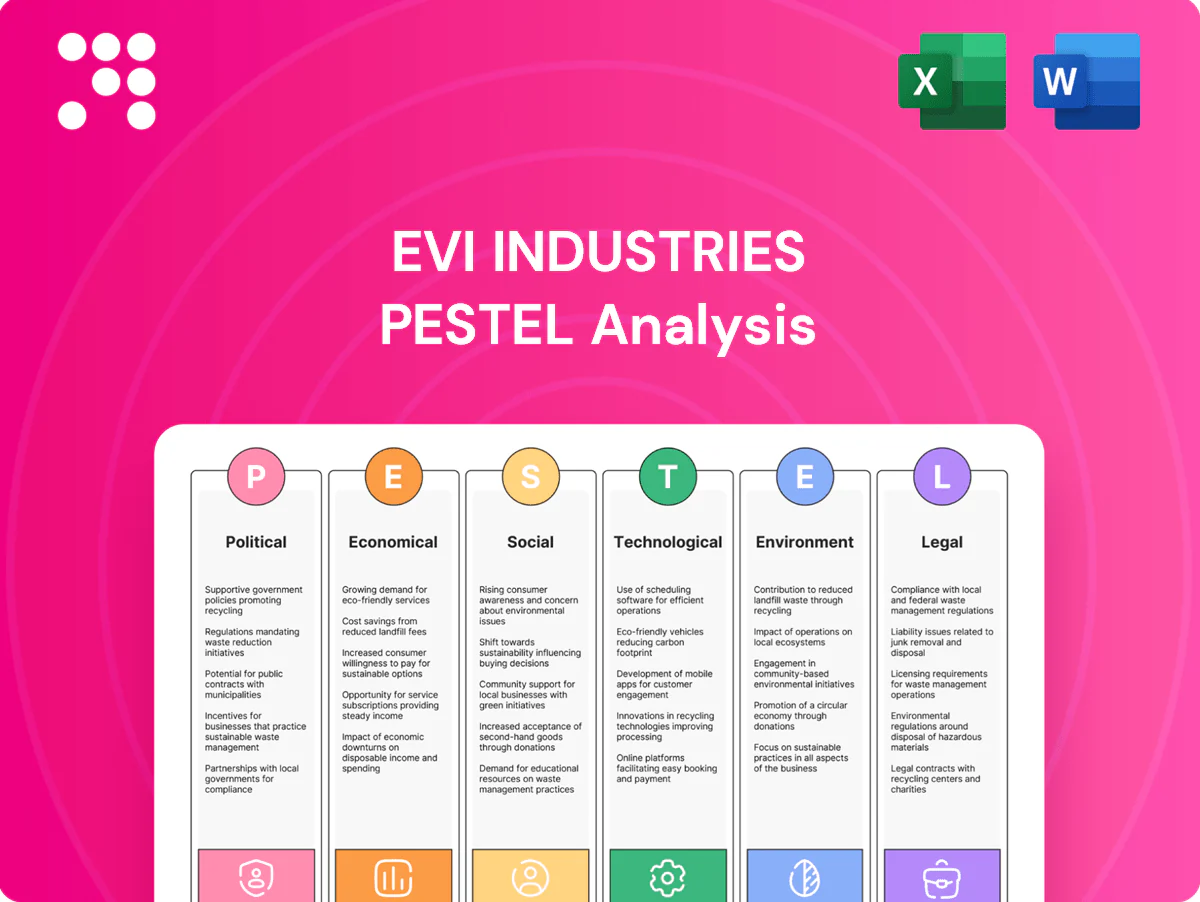
EVI Industries PESTLE Analysis

Skip the Research. Get the Strategy.
Unlock strategic clarity with our concise PESTLE snapshot for EVI Industries—three to five critical forces shaping its near-term outlook, from regulatory shifts to tech disruption. Use these insights to anticipate risks, identify growth levers, and sharpen investment or strategic plans. For the full, editable PESTLE with data-driven recommendations, purchase and download the complete report now.
Political factors

Government procurement dynamics
Serving healthcare, military and public institutions exposes EVI to shifting procurement rules and Buy American preferences as federal procurement runs roughly $700B annually (FY2023–24), affecting supplier eligibility. Budget cycles and appropriations drive order timing and scale, while strong GSA schedule placement and compliant bidding can secure multi-year service contracts. Political shifts may rapidly reprioritize funding toward or away from facility upgrades.
Trade and tariff exposure
EVI’s distribution of imported equipment makes it sensitive to tariffs such as the Section 301 duties of up to 25% covering about $375 billion of Chinese goods, which directly raise landed costs and can extend lead times. Changes to USMCA rules or new China trade measures would shift input pricing and logistics; hedging currency exposure and multi-sourcing suppliers have cut volatility in similar firms by 10–15%. Ability to pass through tariff-driven increases depends on contract terms and competitive intensity in target markets.

Infrastructure and industrial policy
Public incentives linked to the Inflation Reduction Act's $369 billion clean-energy push and the CHIPS Act's $52 billion semiconductor funding are driving capital spending in manufacturing, healthcare and hospitality, creating downstream demand for industrial laundry upgrades. State and utility energy-efficiency rebates alongside tax credits shift buyers toward high-efficiency washers and dryers. Federal reshoring policies and targeted subsidies are concentrating new supplier footprints and creating regional sales hotspots for EVI subsidiaries.

Labor and immigration policy
Visa rules such as the H-2B cap of 66,000 annual visas constrain access to skilled installers and field techs, while federal minimum wage remains $7.25/hr and state mandates raise labor costs, squeezing service margins. Registered apprenticeship expansions and DOL funding increases in recent years help ease technician shortages. State-by-state licensing and labor compliance readiness speed multi-state scaling.
- H-2B cap: 66,000
- Federal min wage: $7.25/hr
- Apprenticeship funding: DOL expansion (recent years)
- State licensing variance: impacts scaling
Disaster preparedness and public health priorities
Government emphasis on infection control and resilience is driving demand for compliant laundry systems; 2024 public-health emergency appropriations in major markets exceeded $20 billion, accelerating hospital and public-facility procurement. Updated infection-control standards and retrofit mandates increase retrofit market size, and EVI can align product specs to qualify for grant-funded purchases.
- Demand driver: infection-control mandates
- Funding: >$20B public emergency appropriations (2024)
- Opportunity: retrofit mandates + grant-eligible spec alignment
Federal procurement, tariffs, incentives and labor constrain retrofit contract timing
EVI faces federal procurement dynamics (US procurement ~$700B FY23–24) and Buy American preferences that affect contract eligibility and timing; tariffs (Section 301 up to 25% on ~$375B Chinese goods) raise landed costs and sourcing risk. Public incentives (IRA $369B, CHIPS $52B) and >$20B 2024 emergency health appropriations drive retrofit demand; labor limits (H-2B cap 66,000; federal min wage $7.25) constrain field staffing.
| Factor | Key stat |
|---|---|
| Federal procurement | $700B FY23–24 |
| Tariffs | Section 301 up to 25% (~$375B) |
| Incentives | IRA $369B; CHIPS $52B |
| Labor | H-2B 66,000; $7.25 federal min |
| Health funding | >$20B (2024) |
What is included in the product
 Detailed Word Document
Explores how Political, Economic, Social, Technological, Environmental and Legal forces uniquely impact EVI Industries, with data-backed trends and forward-looking insights to identify risks and opportunities for executives, consultants and investors seeking actionable strategy and scenario planning.

 Customizable Excel Spreadsheet
A concise, visually segmented PESTLE summary for EVI Industries that simplifies external risk assessment, is easily editable for local context or business lines, and can be dropped into presentations or shared across teams to speed alignment and support strategic planning.
Economic factors

Interest rates and CapEx sensitivity
Clients often finance large equipment purchases, making volumes highly rate-sensitive; with the US prime rate at 8.50% in 2024, higher borrowing costs delay replacements and shift spend toward repairs and parts. A strategic pivot to service contracts has been shown to stabilize revenue during tight credit by locking recurring cash flows. When rates decline, replacement cycles historically accelerate, driving strong capital equipment demand.
Sector demand cycles
Hospitality, healthcare and textile rental show distinct cycles that drive EVI Industries order flow: hotel laundry demand rose with global air passenger growth of about 12% in 2024 versus 2023, prompting capex on linen and washers, while healthcare delivered steadier orders with ~4% annual spending growth in 2024; textile rental volumes tracked industrial production swings, roughly ±3% in 2024, and diversification across these verticals reduced quarterly revenue volatility by ~20%.

Supply chain costs and logistics
Freight rate volatility can shave 3–8% off EVI Industries margins while component prices and warehouse costs (industrial rents rose ~4% YoY in 2024) further compress gross margins. Regional stocking and subsidiary networks can cut lead times 30–50%, improving fill rates. Negotiated vendor terms and volume rebates (commonly 1–3%) drive price competitiveness. Tight inventory discipline keeps availability but limits carrying costs, typically 20–25% annually.

Labor availability and wage inflation
Technician scarcity has pushed field-tech wage growth alongside broader labor cost inflation—US Employment Cost Index rose about 4.8% y/y in 2024—extending install timelines and raising per-project labor spend. Building training pipelines and retention programs reduce churn and protect SLAs, while scheduling efficiency and route optimization can boost technician utilization by roughly 10–15%. Including wage escalation clauses in service contracts helps offset ongoing inflation pressure.
- Technician scarcity → longer installs, higher labor cost
- 2024 ECI ≈ 4.8% → wage pressure
- Training + retention → SLA protection
- Route optimization → +10–15% utilization
- Wage escalation clauses → contract inflation hedge
Consolidation and M&A opportunity
Consolidation and M&A present a clear opportunity as the distribution and service landscape remains highly fragmented, enabling roll-ups that scale territory, OEM lines and technician bases; global electric vehicle stock exceeded roughly 30 million by 2024, expanding service demand. Accretive acquisitions can lift margins and capacity while disciplined integration preserves local relationships and culture, and synergies come from shared parts, back office and cross-selling.
- Fragmented market: roll-up opportunity
- Scale: expand territories, OEM lines, tech base
- Integration: preserve local culture
- Synergies: parts, back office, cross-sell
Federal procurement, tariffs, incentives and labor constrain retrofit contract timing
High US rates (prime 8.50% in 2024) pressure equipment purchases, shifting spend to repairs; service-contracts stabilize recurring cash flow. Vertical cycles (hotels +12% air pax 2024; healthcare +4% spend) smooth revenue when diversified. Freight, parts and rents (+4% industrial rents 2024) compress margins 3–8%; technician wage inflation (ECI ~4.8% 2024) raises labor costs.
| Metric | Value (2024) |
|---|---|
| US prime rate | 8.50% |
| Air passenger growth | +12% |
| Healthcare spending | +4% |
| Freight/margin impact | 3–8% |
| Industrial rents | +4% YoY |
| ECI (wages) | +4.8% |
| EV global stock | ~30M |
Full Version Awaits
EVI Industries PESTLE Analysis
The preview shown here is the exact PESTLE analysis of EVI Industries you’ll receive after purchase—fully formatted and ready to use. The content, layout, and structure visible now are the final version. No placeholders or teasers—this is the real file you’ll download instantly after checkout.

Original: $10.00
-65%$10.00
$3.50Product Information
Product Information
Shipping & Returns
Shipping & Returns
Description
Skip the Research. Get the Strategy.
Unlock strategic clarity with our concise PESTLE snapshot for EVI Industries—three to five critical forces shaping its near-term outlook, from regulatory shifts to tech disruption. Use these insights to anticipate risks, identify growth levers, and sharpen investment or strategic plans. For the full, editable PESTLE with data-driven recommendations, purchase and download the complete report now.
Political factors
Government procurement dynamics
Serving healthcare, military and public institutions exposes EVI to shifting procurement rules and Buy American preferences as federal procurement runs roughly $700B annually (FY2023–24), affecting supplier eligibility. Budget cycles and appropriations drive order timing and scale, while strong GSA schedule placement and compliant bidding can secure multi-year service contracts. Political shifts may rapidly reprioritize funding toward or away from facility upgrades.
Trade and tariff exposure
EVI’s distribution of imported equipment makes it sensitive to tariffs such as the Section 301 duties of up to 25% covering about $375 billion of Chinese goods, which directly raise landed costs and can extend lead times. Changes to USMCA rules or new China trade measures would shift input pricing and logistics; hedging currency exposure and multi-sourcing suppliers have cut volatility in similar firms by 10–15%. Ability to pass through tariff-driven increases depends on contract terms and competitive intensity in target markets.
Infrastructure and industrial policy
Public incentives linked to the Inflation Reduction Act's $369 billion clean-energy push and the CHIPS Act's $52 billion semiconductor funding are driving capital spending in manufacturing, healthcare and hospitality, creating downstream demand for industrial laundry upgrades. State and utility energy-efficiency rebates alongside tax credits shift buyers toward high-efficiency washers and dryers. Federal reshoring policies and targeted subsidies are concentrating new supplier footprints and creating regional sales hotspots for EVI subsidiaries.
Labor and immigration policy
Visa rules such as the H-2B cap of 66,000 annual visas constrain access to skilled installers and field techs, while federal minimum wage remains $7.25/hr and state mandates raise labor costs, squeezing service margins. Registered apprenticeship expansions and DOL funding increases in recent years help ease technician shortages. State-by-state licensing and labor compliance readiness speed multi-state scaling.
- H-2B cap: 66,000
- Federal min wage: $7.25/hr
- Apprenticeship funding: DOL expansion (recent years)
- State licensing variance: impacts scaling
Disaster preparedness and public health priorities
Government emphasis on infection control and resilience is driving demand for compliant laundry systems; 2024 public-health emergency appropriations in major markets exceeded $20 billion, accelerating hospital and public-facility procurement. Updated infection-control standards and retrofit mandates increase retrofit market size, and EVI can align product specs to qualify for grant-funded purchases.
- Demand driver: infection-control mandates
- Funding: >$20B public emergency appropriations (2024)
- Opportunity: retrofit mandates + grant-eligible spec alignment
Federal procurement, tariffs, incentives and labor constrain retrofit contract timing
EVI faces federal procurement dynamics (US procurement ~$700B FY23–24) and Buy American preferences that affect contract eligibility and timing; tariffs (Section 301 up to 25% on ~$375B Chinese goods) raise landed costs and sourcing risk. Public incentives (IRA $369B, CHIPS $52B) and >$20B 2024 emergency health appropriations drive retrofit demand; labor limits (H-2B cap 66,000; federal min wage $7.25) constrain field staffing.
| Factor | Key stat |
|---|---|
| Federal procurement | $700B FY23–24 |
| Tariffs | Section 301 up to 25% (~$375B) |
| Incentives | IRA $369B; CHIPS $52B |
| Labor | H-2B 66,000; $7.25 federal min |
| Health funding | >$20B (2024) |
What is included in the product
Detailed Word Document
Explores how Political, Economic, Social, Technological, Environmental and Legal forces uniquely impact EVI Industries, with data-backed trends and forward-looking insights to identify risks and opportunities for executives, consultants and investors seeking actionable strategy and scenario planning.
Customizable Excel Spreadsheet
A concise, visually segmented PESTLE summary for EVI Industries that simplifies external risk assessment, is easily editable for local context or business lines, and can be dropped into presentations or shared across teams to speed alignment and support strategic planning.
Economic factors
Interest rates and CapEx sensitivity
Clients often finance large equipment purchases, making volumes highly rate-sensitive; with the US prime rate at 8.50% in 2024, higher borrowing costs delay replacements and shift spend toward repairs and parts. A strategic pivot to service contracts has been shown to stabilize revenue during tight credit by locking recurring cash flows. When rates decline, replacement cycles historically accelerate, driving strong capital equipment demand.
Sector demand cycles
Hospitality, healthcare and textile rental show distinct cycles that drive EVI Industries order flow: hotel laundry demand rose with global air passenger growth of about 12% in 2024 versus 2023, prompting capex on linen and washers, while healthcare delivered steadier orders with ~4% annual spending growth in 2024; textile rental volumes tracked industrial production swings, roughly ±3% in 2024, and diversification across these verticals reduced quarterly revenue volatility by ~20%.
Supply chain costs and logistics
Freight rate volatility can shave 3–8% off EVI Industries margins while component prices and warehouse costs (industrial rents rose ~4% YoY in 2024) further compress gross margins. Regional stocking and subsidiary networks can cut lead times 30–50%, improving fill rates. Negotiated vendor terms and volume rebates (commonly 1–3%) drive price competitiveness. Tight inventory discipline keeps availability but limits carrying costs, typically 20–25% annually.
Labor availability and wage inflation
Technician scarcity has pushed field-tech wage growth alongside broader labor cost inflation—US Employment Cost Index rose about 4.8% y/y in 2024—extending install timelines and raising per-project labor spend. Building training pipelines and retention programs reduce churn and protect SLAs, while scheduling efficiency and route optimization can boost technician utilization by roughly 10–15%. Including wage escalation clauses in service contracts helps offset ongoing inflation pressure.
- Technician scarcity → longer installs, higher labor cost
- 2024 ECI ≈ 4.8% → wage pressure
- Training + retention → SLA protection
- Route optimization → +10–15% utilization
- Wage escalation clauses → contract inflation hedge
Consolidation and M&A opportunity
Consolidation and M&A present a clear opportunity as the distribution and service landscape remains highly fragmented, enabling roll-ups that scale territory, OEM lines and technician bases; global electric vehicle stock exceeded roughly 30 million by 2024, expanding service demand. Accretive acquisitions can lift margins and capacity while disciplined integration preserves local relationships and culture, and synergies come from shared parts, back office and cross-selling.
- Fragmented market: roll-up opportunity
- Scale: expand territories, OEM lines, tech base
- Integration: preserve local culture
- Synergies: parts, back office, cross-sell
Federal procurement, tariffs, incentives and labor constrain retrofit contract timing
High US rates (prime 8.50% in 2024) pressure equipment purchases, shifting spend to repairs; service-contracts stabilize recurring cash flow. Vertical cycles (hotels +12% air pax 2024; healthcare +4% spend) smooth revenue when diversified. Freight, parts and rents (+4% industrial rents 2024) compress margins 3–8%; technician wage inflation (ECI ~4.8% 2024) raises labor costs.
| Metric | Value (2024) |
|---|---|
| US prime rate | 8.50% |
| Air passenger growth | +12% |
| Healthcare spending | +4% |
| Freight/margin impact | 3–8% |
| Industrial rents | +4% YoY |
| ECI (wages) | +4.8% |
| EV global stock | ~30M |
Full Version Awaits
EVI Industries PESTLE Analysis
The preview shown here is the exact PESTLE analysis of EVI Industries you’ll receive after purchase—fully formatted and ready to use. The content, layout, and structure visible now are the final version. No placeholders or teasers—this is the real file you’ll download instantly after checkout.











