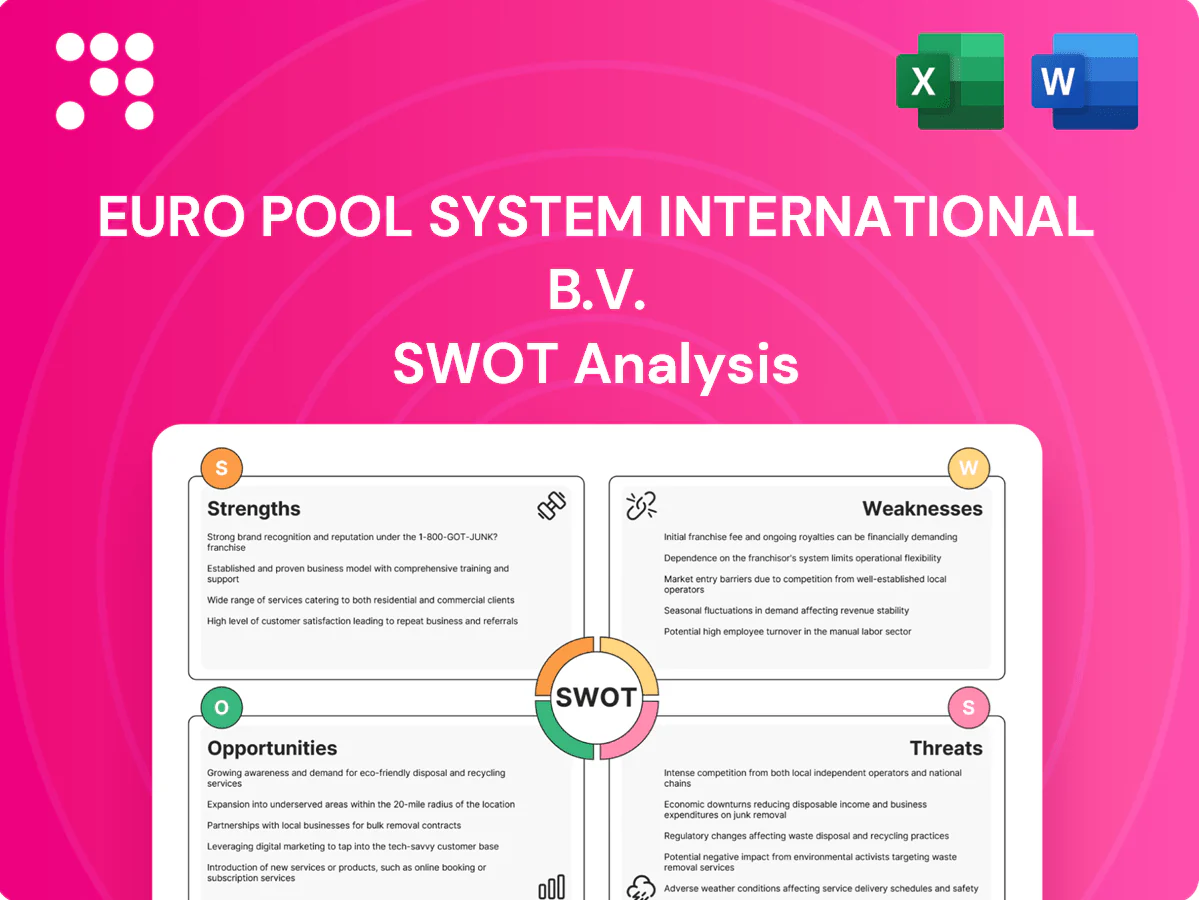
Euro Pool System International B.V. SWOT Analysis

Elevate Your Analysis with the Complete SWOT Report
Euro Pool System International B.V. leverages a strong reusable packaging network and sustainability credentials, but faces logistical complexity and regulatory exposure across Europe. Competitive pressure from alternative pooling systems and digital disruptors challenges margin expansion. Strategic investments in tech and partnerships could unlock scalable growth.
Discover the full SWOT analysis—professionally formatted Word and Excel deliverables with research-backed insights and actionable recommendations. Purchase now to customize, present, and plan with confidence.
Strengths

Pan-European network and scale
Operating across 17 European countries, Euro Pool System’s pan‑European network drives high asset utilization and consistent service levels. Scale lowers per‑trip washing, transport and handling costs, supporting unit economics across millions of pooled crate movements annually. Standardized flows create meaningful switching costs for retailers and producers, while dense routes improve backhaul utilization and cut empty miles.
Standardized reusable tray portfolio
Uniform tray formats streamline handling from farm to retail, reducing damage and dwell time through consistent stacking and protection. Standardization simplifies automation and compatibility with conveyors and pallets, lowering integration costs and downtime. It enhances predictability in pooling cycles and forecasting, while customers benefit from fewer SKUs and faster throughput.

Closed-loop logistics and washing expertise
Closed-loop logistics, sanitation, and rapid turnaround form Euro Pool System's core operational moat, with reverse-logistics protocols and validated wash processes that are difficult for competitors to replicate. High hygiene standards make the system well-suited for fresh produce, meat, poultry, seafood, and bakery flows. Efficient automated washing lines support rapid cycling and consistent quality assurance. Process excellence underpins reliable service delivery and regulatory compliance.

Sustainability and waste reduction value
Reusable packaging by Euro Pool System cuts single-use plastics and corrugate waste, lowering lifecycle CO2 per trip to help retailers meet ESG targets and regulatory reporting; their data-driven claims (traceable pool logistics and GHG reporting) strengthen customer trust and support circular-economy positioning across fresh produce supply chains.
- Reusable RPCs reduce single-use packaging
- Lower CO2 per trip aids ESG compliance
- Data-backed claims build customer trust
- Circular economy alignment
Strong retailer and producer relationships
Long-term contracts and embedded returnable packaging processes create high customer stickiness and reduce churn. Joint demand planning with retailers and producers improves SKU availability during peaks and seasonal shifts. Deep integration with customers’ DCs and transport partners raises switching costs, while referenceability with major retail chains strengthens credibility in new bids.
- Long-term contracts
- Joint planning → peak availability
- DC/transport integration → high dependence
- Major-chain referenceability
RPC pooling in 17 countries — lower per-trip costs, higher asset utilization
Pan‑European scale (17 countries) yields high asset utilization and lower per‑trip costs across millions of pooled crate movements annually. Standardized RPCs streamline handling and automation, reducing damage and dwell time. Closed‑loop washing and fast turnaround ensure hygiene for fresh categories. Long‑term contracts and DC integration create strong customer stickiness.
| Metric | Value |
|---|---|
| Countries | 17 |
| Throughput | Millions of crate movements/yr |
| Core strength | Closed‑loop RPC pooling & washing |
What is included in the product
 Detailed Word Document
Provides a clear SWOT framework analyzing Euro Pool System International B.V.’s internal strengths and weaknesses alongside market opportunities and external threats, outlining its operational efficiency in pooled container logistics and areas for improvement. Examines strategic levers and risks shaping the company’s competitive position and growth potential.

 Customizable Excel Spreadsheet
Provides a concise, editable SWOT matrix for Euro Pool System International B.V., streamlining strategic alignment and quick edits to relieve stakeholder reporting and decision-making pain points.
Weaknesses

Capital-intensive asset base
Large investments in reusable trays, washing centers and logistics infrastructure tie up capital across Euro Pool System, which operates in over 20 European countries.
Depreciation and maintenance of extensive fixed assets are material fixed costs that reduce operating leverage.
Utilization dips, such as seasonal declines in produce flows, directly pressure margins, while geographic expansion demands significant upfront cash outlays for equipment and sites.
Exposure to operational complexity
Reverse logistics, sanitation and loss management create high operational strain for Euro Pool System, which operates in 30+ countries and manages over 100 million pooling units annually, making coordination complex and costly.
Misbalances in pool circulation can cause localized shortages or surpluses, with industry loss rates for reusable crates estimated at roughly 2–4%, amplifying replacement costs.
Peak seasonality can double throughput needs, stressing washing and transport capacity and risking KPI breaches; process disruptions quickly degrade service levels and on-time delivery metrics.

Customer concentration risk
Reliance on a limited number of large retailers or producers gives those customers outsized bargaining power; Euro Pool System is privately held and does not disclose customer concentration ratios, limiting transparency. Contract renewals can directly pressure pricing and margins. Loss of a key customer would reduce volume density and increase unit costs. Negotiations can force changes to service terms and higher capex commitments.

Price sensitivity versus one-way packaging
Price-sensitive lanes expose Euro Pool to undercutting by cheap corrugate or single-use alternatives, as some customers focus on per-trip landed cost; benefits from reduced damage and faster turnaround are often hard to quantify across all SKU categories, leaving pooled pricing vulnerable during competitive tenders that compress margins.
- Undercut risk: cheap single-use alternatives
- Customer focus: total landed cost per trip
- Hard-to-quantify: damage reduction & speed
- Margin pressure: aggressive competitive tenders
Asset loss and damage
Tray attrition of an estimated 5-10% annually from theft, misuse or non-return erodes pooled asset returns, forcing Euro Pool to increase replacements and capex while raising the system's environmental footprint. Tracking and deposit systems add measurable administrative burden (roughly 2-4% of operating costs by industry benchmarks), and quality downgrades shorten cycle life and uptime, lowering utilization and revenue per tray.
- Attrition rate: 5-10% annually
- Admin overhead: ~2-4% of operating costs
- Higher capex and emissions from replacements
- Reduced cycle life → lower uptime and utilization
Trays across 30+ countries lock capital; over 100M units, attrition 5-10%
High capital tied in reusable trays, washing centers and logistics across 30+ countries limits financial flexibility; Euro Pool manages over 100 million pooling units annually. Depreciation, maintenance and seasonality (peak throughput ≈2x) raise fixed costs and margin volatility. Attrition (5–10%), industry loss rates (2–4%) and admin overhead (~2–4%) increase replacement capex and operating strain.
| Metric | Value |
|---|---|
| Pooling units managed | >100 million |
| Countries | 30+ |
| Attrition | 5–10% |
| Industry loss rate | 2–4% |
| Admin overhead | ~2–4% of Opex |
| Peak throughput | ~2x base |
Preview the Actual Deliverable
Euro Pool System International B.V. SWOT Analysis
This is the actual SWOT analysis document for Euro Pool System International B.V.—the preview below is taken directly from the full report you'll receive upon purchase. No placeholders or summaries: buy to unlock the complete, editable, professionally structured analysis ready for immediate use.

Original: $10.00
-65%$10.00
$3.50Product Information
Product Information
Shipping & Returns
Shipping & Returns
Description
Elevate Your Analysis with the Complete SWOT Report
Euro Pool System International B.V. leverages a strong reusable packaging network and sustainability credentials, but faces logistical complexity and regulatory exposure across Europe. Competitive pressure from alternative pooling systems and digital disruptors challenges margin expansion. Strategic investments in tech and partnerships could unlock scalable growth.
Discover the full SWOT analysis—professionally formatted Word and Excel deliverables with research-backed insights and actionable recommendations. Purchase now to customize, present, and plan with confidence.
Strengths
Pan-European network and scale
Operating across 17 European countries, Euro Pool System’s pan‑European network drives high asset utilization and consistent service levels. Scale lowers per‑trip washing, transport and handling costs, supporting unit economics across millions of pooled crate movements annually. Standardized flows create meaningful switching costs for retailers and producers, while dense routes improve backhaul utilization and cut empty miles.
Standardized reusable tray portfolio
Uniform tray formats streamline handling from farm to retail, reducing damage and dwell time through consistent stacking and protection. Standardization simplifies automation and compatibility with conveyors and pallets, lowering integration costs and downtime. It enhances predictability in pooling cycles and forecasting, while customers benefit from fewer SKUs and faster throughput.
Closed-loop logistics and washing expertise
Closed-loop logistics, sanitation, and rapid turnaround form Euro Pool System's core operational moat, with reverse-logistics protocols and validated wash processes that are difficult for competitors to replicate. High hygiene standards make the system well-suited for fresh produce, meat, poultry, seafood, and bakery flows. Efficient automated washing lines support rapid cycling and consistent quality assurance. Process excellence underpins reliable service delivery and regulatory compliance.
Sustainability and waste reduction value
Reusable packaging by Euro Pool System cuts single-use plastics and corrugate waste, lowering lifecycle CO2 per trip to help retailers meet ESG targets and regulatory reporting; their data-driven claims (traceable pool logistics and GHG reporting) strengthen customer trust and support circular-economy positioning across fresh produce supply chains.
- Reusable RPCs reduce single-use packaging
- Lower CO2 per trip aids ESG compliance
- Data-backed claims build customer trust
- Circular economy alignment
Strong retailer and producer relationships
Long-term contracts and embedded returnable packaging processes create high customer stickiness and reduce churn. Joint demand planning with retailers and producers improves SKU availability during peaks and seasonal shifts. Deep integration with customers’ DCs and transport partners raises switching costs, while referenceability with major retail chains strengthens credibility in new bids.
- Long-term contracts
- Joint planning → peak availability
- DC/transport integration → high dependence
- Major-chain referenceability
RPC pooling in 17 countries — lower per-trip costs, higher asset utilization
Pan‑European scale (17 countries) yields high asset utilization and lower per‑trip costs across millions of pooled crate movements annually. Standardized RPCs streamline handling and automation, reducing damage and dwell time. Closed‑loop washing and fast turnaround ensure hygiene for fresh categories. Long‑term contracts and DC integration create strong customer stickiness.
| Metric | Value |
|---|---|
| Countries | 17 |
| Throughput | Millions of crate movements/yr |
| Core strength | Closed‑loop RPC pooling & washing |
What is included in the product
Detailed Word Document
Provides a clear SWOT framework analyzing Euro Pool System International B.V.’s internal strengths and weaknesses alongside market opportunities and external threats, outlining its operational efficiency in pooled container logistics and areas for improvement. Examines strategic levers and risks shaping the company’s competitive position and growth potential.
Customizable Excel Spreadsheet
Provides a concise, editable SWOT matrix for Euro Pool System International B.V., streamlining strategic alignment and quick edits to relieve stakeholder reporting and decision-making pain points.
Weaknesses
Capital-intensive asset base
Large investments in reusable trays, washing centers and logistics infrastructure tie up capital across Euro Pool System, which operates in over 20 European countries.
Depreciation and maintenance of extensive fixed assets are material fixed costs that reduce operating leverage.
Utilization dips, such as seasonal declines in produce flows, directly pressure margins, while geographic expansion demands significant upfront cash outlays for equipment and sites.
Exposure to operational complexity
Reverse logistics, sanitation and loss management create high operational strain for Euro Pool System, which operates in 30+ countries and manages over 100 million pooling units annually, making coordination complex and costly.
Misbalances in pool circulation can cause localized shortages or surpluses, with industry loss rates for reusable crates estimated at roughly 2–4%, amplifying replacement costs.
Peak seasonality can double throughput needs, stressing washing and transport capacity and risking KPI breaches; process disruptions quickly degrade service levels and on-time delivery metrics.
Customer concentration risk
Reliance on a limited number of large retailers or producers gives those customers outsized bargaining power; Euro Pool System is privately held and does not disclose customer concentration ratios, limiting transparency. Contract renewals can directly pressure pricing and margins. Loss of a key customer would reduce volume density and increase unit costs. Negotiations can force changes to service terms and higher capex commitments.
Price sensitivity versus one-way packaging
Price-sensitive lanes expose Euro Pool to undercutting by cheap corrugate or single-use alternatives, as some customers focus on per-trip landed cost; benefits from reduced damage and faster turnaround are often hard to quantify across all SKU categories, leaving pooled pricing vulnerable during competitive tenders that compress margins.
- Undercut risk: cheap single-use alternatives
- Customer focus: total landed cost per trip
- Hard-to-quantify: damage reduction & speed
- Margin pressure: aggressive competitive tenders
Asset loss and damage
Tray attrition of an estimated 5-10% annually from theft, misuse or non-return erodes pooled asset returns, forcing Euro Pool to increase replacements and capex while raising the system's environmental footprint. Tracking and deposit systems add measurable administrative burden (roughly 2-4% of operating costs by industry benchmarks), and quality downgrades shorten cycle life and uptime, lowering utilization and revenue per tray.
- Attrition rate: 5-10% annually
- Admin overhead: ~2-4% of operating costs
- Higher capex and emissions from replacements
- Reduced cycle life → lower uptime and utilization
Trays across 30+ countries lock capital; over 100M units, attrition 5-10%
High capital tied in reusable trays, washing centers and logistics across 30+ countries limits financial flexibility; Euro Pool manages over 100 million pooling units annually. Depreciation, maintenance and seasonality (peak throughput ≈2x) raise fixed costs and margin volatility. Attrition (5–10%), industry loss rates (2–4%) and admin overhead (~2–4%) increase replacement capex and operating strain.
| Metric | Value |
|---|---|
| Pooling units managed | >100 million |
| Countries | 30+ |
| Attrition | 5–10% |
| Industry loss rate | 2–4% |
| Admin overhead | ~2–4% of Opex |
| Peak throughput | ~2x base |
Preview the Actual Deliverable
Euro Pool System International B.V. SWOT Analysis
This is the actual SWOT analysis document for Euro Pool System International B.V.—the preview below is taken directly from the full report you'll receive upon purchase. No placeholders or summaries: buy to unlock the complete, editable, professionally structured analysis ready for immediate use.











