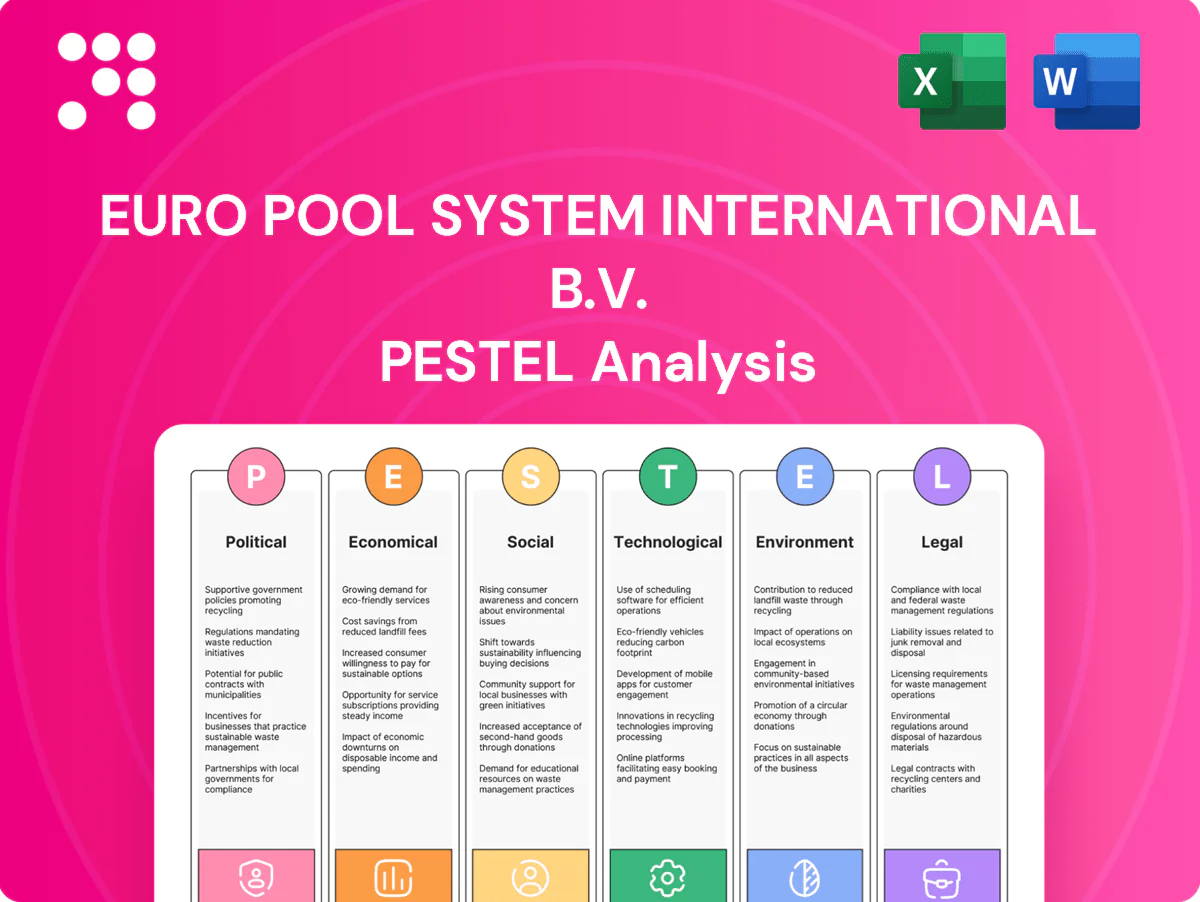
Euro Pool System International B.V. PESTLE Analysis

Skip the Research. Get the Strategy.
Discover how political shifts, supply-chain economics, and sustainability regulations are reshaping Euro Pool System International B.V.'s strategic landscape in this concise PESTLE snapshot. Our full analysis delivers actionable insights and risk forecasts tailored for investors, consultants, and executives. Purchase the complete report to access detailed drivers, scenarios, and ready-to-use recommendations.
Political factors

EU circular economy and reuse mandates
The EU Circular Economy Action Plan (2020) and the Packaging and Packaging Waste Regulation (PPWR, proposed Nov 2022; provisional agreement Dec 2023) prioritize reuse over single‑use, directly aligning with pooled tray models and boosting public/policy support for standardized crates. Design‑for‑reuse criteria and expanded reporting under PPWR will increase compliance workload and costs for operators. Monitoring member‑state transposition timelines is critical for rollout planning.
Agriculture and food policy influence volumes
CAP incentives under the 2023–27 budget of about EUR 387 billion and Farm to Fork targets (50% pesticide reduction, 25% organic land by 2030) shift fresh-produce output and seasonality, driving tray demand. Policy moves toward local sourcing or specialty crops change lane density and crate turns. Food-security measures encourage regionalized, resilient logistics. Euro Pool must flex asset allocation as policy steers crop mix and flows.

Cross-border logistics and customs friction
Schengen (26 states) and the EU single market (27 members) ease multi-country pooling and cross-border crate circulation. UK-EU post-Brexit customs controls from 2021 have added clearance steps and paperwork, increasing logistical costs and lead times. Divergent sanitary and phytosanitary rules complicate reverse logistics of crates, and ad-hoc political border measures can disrupt cycle times. Network buffers and localized washing hubs are used to mitigate these risks.

Energy and transport policy
Energy and transport policy raises last-mile costs through fuel taxation, road tolls and the spread of low-emission zones (over 300 European cities by 2024), while Fit for 55 (EU target: -55% GHG by 2030) and national incentives for e-trucks and rail can cut pool carbon intensity and operating cost per trip. Policy-driven electricity decarbonization reduces washing emissions over time; timing fleet and site investments to subsidy windows materially improves ROI.
- Fuel taxation: increases variable cost
- Road tolls/LEZs: raise last-mile prices
- E-truck/rail incentives: lower tCO2e/km
- Grid decarbonization: cuts washing emissions
- Subsidy alignment: improves payback
Public procurement and municipal waste priorities
Cities and public buyers increasingly specify reusable packaging in tenders, driven by EU procurement guidance encouraging circular criteria. Municipal waste reduction targets — EU target 65% municipal waste recycling by 2035 — push retailers from single‑use to pooled systems. Collaboration with public waste agencies can unlock shared logistics and collection infrastructure and measurable kg diverted strengthens policy alignment.
- Public tenders favor reuse
- 65% recycling target by 2035
- Shared infrastructure via agencies
- Measure kg diverted to prove impact
EU reuse rules, CAP and Fit for 55 reshape pooled tray costs and cross-border pooling demand
EU PPWR provisional agreement (Dec 2023) and Circular Economy Action Plan strongly favor reuse, raising compliance and reporting costs for pooled trays. CAP budget ~EUR 387bn (2023–27) plus Farm to Fork targets (50% pesticide cut, 25% organic by 2030) shift produce flows and tray demand. Schengen/EU single market ease cross‑border pooling but UK‑EU post‑Brexit controls, >300 LEZs (2024) and Fit for 55 (-55% GHG by 2030) alter costs and investment timing.
| Metric | Value |
|---|---|
| PPWR agreement | Dec 2023 |
| CAP budget | ~EUR 387bn (2023–27) |
| Farm to Fork | -50% pesticides; 25% organic by 2030 |
| Recycling target | 65% municipal by 2035 |
| LEZs | >300 cities (2024) |
What is included in the product
 Detailed Word Document
Explores how macro-environmental factors uniquely affect Euro Pool System International B.V. across Political, Economic, Social, Technological, Environmental and Legal dimensions; each section is data‑backed, industry‑specific, forward‑looking and designed for executives, investors and strategists to spot risks and opportunities.

 Customizable Excel Spreadsheet
A clean, summarized PESTLE of Euro Pool System International B.V., visually segmented by category for quick interpretation and easily dropped into presentations or shared across teams to support planning and external risk discussions.
Economic factors

Food inflation and retailer margin pressure
Euro area food inflation averaged about 6.1% in 2024 (Eurostat), squeezing grocer margins and shifting retailer focus to total landed cost rather than list price. Pooled trays that cut shrink, damage and labour can lower cost-to-serve by up to 10–15% in operator case studies, improving margin resilience. Conversely, customers often resist pooling fee hikes, so transparent value proof and performance SLAs (typical payback under 12 months) are critical for retention.
Energy and water cost volatility
Washing centers face exposure to electricity, gas and water tariffs, with European gas TTF peaking near €300/MWh in 2022 and averaging around €30–40/MWh in 2024, driving sharp per-trip cost swings and straining fixed-price service contracts. Efficiency upgrades and on-site renewables (solar+storage) are used to hedge volatility and reduce grid consumption. Contractual pass-through clauses for energy/water keep cash flows stable.

Utilization rates and asset productivity
Pool economics hinge on turns per year, loss rates and dwell time, with demand shocks or seasonal imbalances lowering utilization and ROIC; dynamic repositioning and predictive planning lift turns while deposit schemes and customer incentives reduce loss and damage.

Interest rates and capex intensity
Crate manufacturing, RFID rollout and washing hubs require significant upfront capex, and with the ECB policy rate around 4.0% (mid‑2024) higher rates lift hurdle returns; leasing, green finance and EU subsidies can trim funding costs by roughly 25–75 bps, while phased deployment tied to signed volumes limits idle assets and robust capex governance preserves margins in cyclical markets.
- Capex intensity: high for hubs and RFID
- Funding cost: ~4.0% policy rate
- Cost relief: leasing/green finance −25–75 bps
- Mitigant: phased rollouts + strict capex governance
Labor availability and logistics costs
Driver shortages—IRU estimated a c.400,000 HGV shortfall in Europe (2022–23)—and wage inflation (driver pay rises up to c.10%–15% in hotspots) lift transport and handling costs for Euro Pool System; automation in depots and wash plants reduces headcount pressure and error rates, while nearshoring washing capacity shortens hauls and overtime; strong 3PL partnerships and flexible contracts smooth peak demand.
- driver_shortage: c.400,000 (IRU 2022–23)
- wage_inflation: up to c.10%–15% in hotspots
- automation: lower headcount, higher throughput
- nearshoring: shorter hauls, less overtime
- 3PL_partnerships: flexible peak capacity
EU reuse rules, CAP and Fit for 55 reshape pooled tray costs and cross-border pooling demand
Euro area food inflation ~6.1% (2024) and ECB policy rate ~4.0% (mid‑2024) compress retailer margins and raise capital costs; pooling cuts cost-to-serve 10–15% in operator cases. Energy tariff volatility and water costs drive per-trip swings; on-site renewables and pass-through clauses mitigate. Driver shortfall ~400,000 (IRU 2022–23) and wage rises up to 10–15% increase transport costs; automation and 3PL partnerships reduce exposure.
| Metric | Value | Source/Year |
|---|---|---|
| Food inflation | 6.1% | Eurostat 2024 |
| ECB policy rate | ~4.0% | Mid‑2024 |
| Energy peak | ~€300/MWh (2022) | TTF 2022 |
| Driver shortfall | ~400,000 | IRU 2022–23 |
| Pooling benefit | 10–15% cost-to-serve | Operator case studies |
Preview Before You Purchase
Euro Pool System International B.V. PESTLE Analysis
The Euro Pool System International B.V. PESTLE Analysis preview shown here is the exact document you’ll receive after purchase—fully formatted and ready to use. It covers political, economic, social, technological, legal and environmental factors relevant to EPS and its pooling operations. No placeholders or teasers; the file you see is the final, downloadable report delivered immediately after payment.

Product Information
Product Information
Shipping & Returns
Shipping & Returns
Description
Skip the Research. Get the Strategy.
Discover how political shifts, supply-chain economics, and sustainability regulations are reshaping Euro Pool System International B.V.'s strategic landscape in this concise PESTLE snapshot. Our full analysis delivers actionable insights and risk forecasts tailored for investors, consultants, and executives. Purchase the complete report to access detailed drivers, scenarios, and ready-to-use recommendations.
Political factors
EU circular economy and reuse mandates
The EU Circular Economy Action Plan (2020) and the Packaging and Packaging Waste Regulation (PPWR, proposed Nov 2022; provisional agreement Dec 2023) prioritize reuse over single‑use, directly aligning with pooled tray models and boosting public/policy support for standardized crates. Design‑for‑reuse criteria and expanded reporting under PPWR will increase compliance workload and costs for operators. Monitoring member‑state transposition timelines is critical for rollout planning.
Agriculture and food policy influence volumes
CAP incentives under the 2023–27 budget of about EUR 387 billion and Farm to Fork targets (50% pesticide reduction, 25% organic land by 2030) shift fresh-produce output and seasonality, driving tray demand. Policy moves toward local sourcing or specialty crops change lane density and crate turns. Food-security measures encourage regionalized, resilient logistics. Euro Pool must flex asset allocation as policy steers crop mix and flows.
Cross-border logistics and customs friction
Schengen (26 states) and the EU single market (27 members) ease multi-country pooling and cross-border crate circulation. UK-EU post-Brexit customs controls from 2021 have added clearance steps and paperwork, increasing logistical costs and lead times. Divergent sanitary and phytosanitary rules complicate reverse logistics of crates, and ad-hoc political border measures can disrupt cycle times. Network buffers and localized washing hubs are used to mitigate these risks.
Energy and transport policy
Energy and transport policy raises last-mile costs through fuel taxation, road tolls and the spread of low-emission zones (over 300 European cities by 2024), while Fit for 55 (EU target: -55% GHG by 2030) and national incentives for e-trucks and rail can cut pool carbon intensity and operating cost per trip. Policy-driven electricity decarbonization reduces washing emissions over time; timing fleet and site investments to subsidy windows materially improves ROI.
- Fuel taxation: increases variable cost
- Road tolls/LEZs: raise last-mile prices
- E-truck/rail incentives: lower tCO2e/km
- Grid decarbonization: cuts washing emissions
- Subsidy alignment: improves payback
Public procurement and municipal waste priorities
Cities and public buyers increasingly specify reusable packaging in tenders, driven by EU procurement guidance encouraging circular criteria. Municipal waste reduction targets — EU target 65% municipal waste recycling by 2035 — push retailers from single‑use to pooled systems. Collaboration with public waste agencies can unlock shared logistics and collection infrastructure and measurable kg diverted strengthens policy alignment.
- Public tenders favor reuse
- 65% recycling target by 2035
- Shared infrastructure via agencies
- Measure kg diverted to prove impact
EU reuse rules, CAP and Fit for 55 reshape pooled tray costs and cross-border pooling demand
EU PPWR provisional agreement (Dec 2023) and Circular Economy Action Plan strongly favor reuse, raising compliance and reporting costs for pooled trays. CAP budget ~EUR 387bn (2023–27) plus Farm to Fork targets (50% pesticide cut, 25% organic by 2030) shift produce flows and tray demand. Schengen/EU single market ease cross‑border pooling but UK‑EU post‑Brexit controls, >300 LEZs (2024) and Fit for 55 (-55% GHG by 2030) alter costs and investment timing.
| Metric | Value |
|---|---|
| PPWR agreement | Dec 2023 |
| CAP budget | ~EUR 387bn (2023–27) |
| Farm to Fork | -50% pesticides; 25% organic by 2030 |
| Recycling target | 65% municipal by 2035 |
| LEZs | >300 cities (2024) |
What is included in the product
Detailed Word Document
Explores how macro-environmental factors uniquely affect Euro Pool System International B.V. across Political, Economic, Social, Technological, Environmental and Legal dimensions; each section is data‑backed, industry‑specific, forward‑looking and designed for executives, investors and strategists to spot risks and opportunities.
Customizable Excel Spreadsheet
A clean, summarized PESTLE of Euro Pool System International B.V., visually segmented by category for quick interpretation and easily dropped into presentations or shared across teams to support planning and external risk discussions.
Economic factors
Food inflation and retailer margin pressure
Euro area food inflation averaged about 6.1% in 2024 (Eurostat), squeezing grocer margins and shifting retailer focus to total landed cost rather than list price. Pooled trays that cut shrink, damage and labour can lower cost-to-serve by up to 10–15% in operator case studies, improving margin resilience. Conversely, customers often resist pooling fee hikes, so transparent value proof and performance SLAs (typical payback under 12 months) are critical for retention.
Energy and water cost volatility
Washing centers face exposure to electricity, gas and water tariffs, with European gas TTF peaking near €300/MWh in 2022 and averaging around €30–40/MWh in 2024, driving sharp per-trip cost swings and straining fixed-price service contracts. Efficiency upgrades and on-site renewables (solar+storage) are used to hedge volatility and reduce grid consumption. Contractual pass-through clauses for energy/water keep cash flows stable.
Utilization rates and asset productivity
Pool economics hinge on turns per year, loss rates and dwell time, with demand shocks or seasonal imbalances lowering utilization and ROIC; dynamic repositioning and predictive planning lift turns while deposit schemes and customer incentives reduce loss and damage.
Interest rates and capex intensity
Crate manufacturing, RFID rollout and washing hubs require significant upfront capex, and with the ECB policy rate around 4.0% (mid‑2024) higher rates lift hurdle returns; leasing, green finance and EU subsidies can trim funding costs by roughly 25–75 bps, while phased deployment tied to signed volumes limits idle assets and robust capex governance preserves margins in cyclical markets.
- Capex intensity: high for hubs and RFID
- Funding cost: ~4.0% policy rate
- Cost relief: leasing/green finance −25–75 bps
- Mitigant: phased rollouts + strict capex governance
Labor availability and logistics costs
Driver shortages—IRU estimated a c.400,000 HGV shortfall in Europe (2022–23)—and wage inflation (driver pay rises up to c.10%–15% in hotspots) lift transport and handling costs for Euro Pool System; automation in depots and wash plants reduces headcount pressure and error rates, while nearshoring washing capacity shortens hauls and overtime; strong 3PL partnerships and flexible contracts smooth peak demand.
- driver_shortage: c.400,000 (IRU 2022–23)
- wage_inflation: up to c.10%–15% in hotspots
- automation: lower headcount, higher throughput
- nearshoring: shorter hauls, less overtime
- 3PL_partnerships: flexible peak capacity
EU reuse rules, CAP and Fit for 55 reshape pooled tray costs and cross-border pooling demand
Euro area food inflation ~6.1% (2024) and ECB policy rate ~4.0% (mid‑2024) compress retailer margins and raise capital costs; pooling cuts cost-to-serve 10–15% in operator cases. Energy tariff volatility and water costs drive per-trip swings; on-site renewables and pass-through clauses mitigate. Driver shortfall ~400,000 (IRU 2022–23) and wage rises up to 10–15% increase transport costs; automation and 3PL partnerships reduce exposure.
| Metric | Value | Source/Year |
|---|---|---|
| Food inflation | 6.1% | Eurostat 2024 |
| ECB policy rate | ~4.0% | Mid‑2024 |
| Energy peak | ~€300/MWh (2022) | TTF 2022 |
| Driver shortfall | ~400,000 | IRU 2022–23 |
| Pooling benefit | 10–15% cost-to-serve | Operator case studies |
Preview Before You Purchase
Euro Pool System International B.V. PESTLE Analysis
The Euro Pool System International B.V. PESTLE Analysis preview shown here is the exact document you’ll receive after purchase—fully formatted and ready to use. It covers political, economic, social, technological, legal and environmental factors relevant to EPS and its pooling operations. No placeholders or teasers; the file you see is the final, downloadable report delivered immediately after payment.











