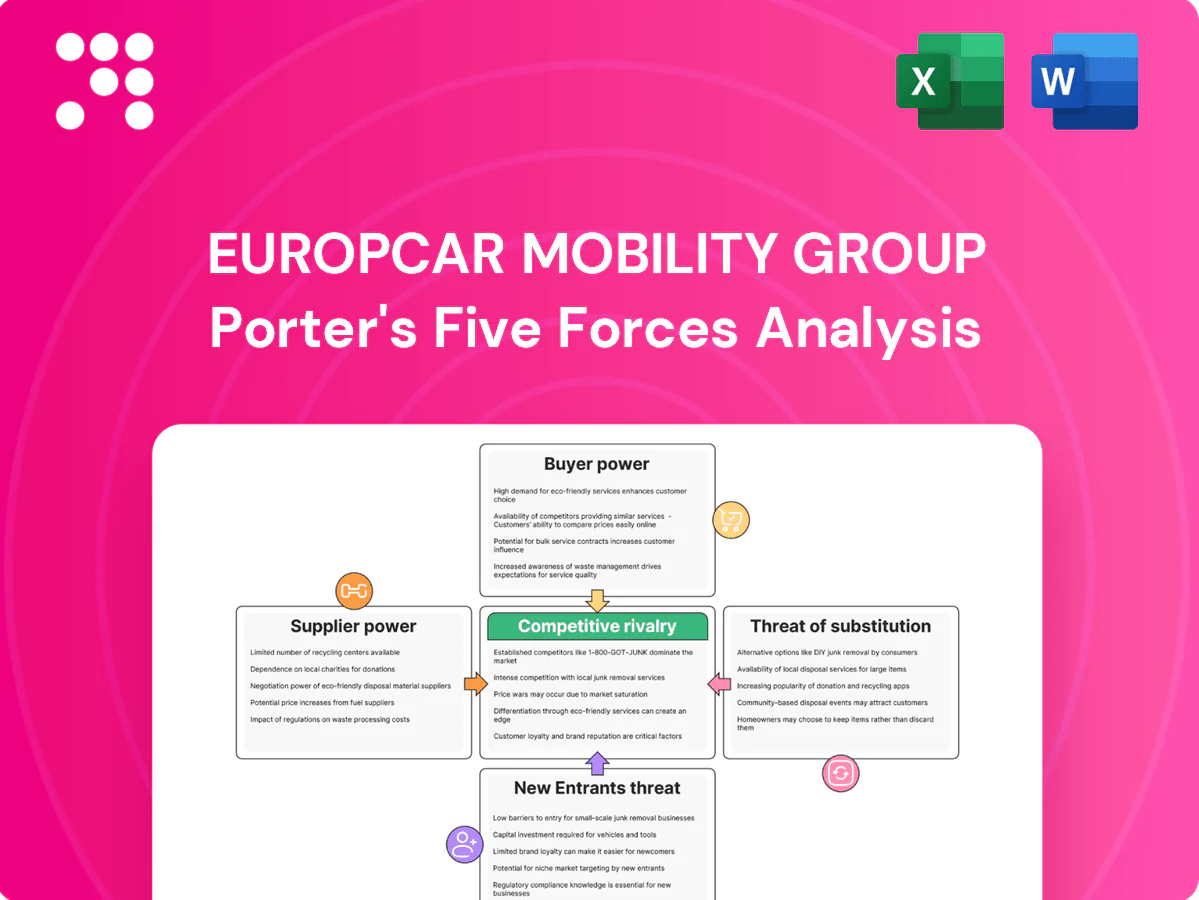
Europcar Mobility Group Porter's Five Forces Analysis

Elevate Your Analysis with the Complete Porter's Five Forces Analysis
Europcar Mobility Group faces intense competitive rivalry, moderate supplier leverage, growing buyer expectations, and a rising threat from mobility substitutes and new entrants disrupting traditional rental models. This snapshot highlights key pressures and strategic levers. Unlock the full Porter's Five Forces Analysis for force-by-force ratings, visuals, and actionable recommendations to inform investment or strategic decisions.
Suppliers Bargaining Power

Concentrated OEM dependence
Europcar's fleet of about 300,000 vehicles in 2024 depends on a small number of OEMs, giving those suppliers leverage over pricing, delivery timing and model mix during tight production cycles.
That concentration elevates supplier power and can compress margins — Europcar noted higher fleet procurement costs in 2024 versus 2023.
Long-term purchase agreements and volume commitments partially mitigate this risk but do not fully eliminate exposure to OEM supply constraints.
Airport and real-estate concessions
Prime airport and rail-station locations are controlled by a few landlords and authorities, giving them outsized leverage over allocation and concession terms. Concession fees and strict allocation rules can be binding, and losing or repricing a concession can cut capture of on‑site demand by roughly 33% at affected hubs. Diversifying into off‑airport sites and digital delivery channels reduces exposure and preserves revenue resilience.

Financing and leasing partners
Europcar’s fleet CAPEX and refinancing needs keep it dependent on banks and lessors, especially for ~multi-year vehicle replacement cycles; Europe’s ECB policy rate averaged about 4% in 2024, directly lifting funding costs and lease rates. Covenant terms and interest-rate cycles therefore materially affect cost-to-serve and fleet flexibility. Firms with stronger balance sheets or asset-backed funding negotiate lower spreads and longer tenors. Market volatility tightens capital, increasing supplier bargaining power.

Telematics, IT, and distribution platforms
Reservation systems, telematics and GDS/OTA channels form critical infrastructure for Europcar Mobility Group; with c.€2.1bn revenue in 2023 and a ~230,000-vehicle fleet, outages or unfavorable vendor terms can directly reduce utilization and pricing control. High switching costs and integration complexity increase supplier leverage, while building proprietary platforms and multi-sourcing telematics vendors reduces dependency and risk.
- Reservation systems: single points of failure
- Telematics: fleet visibility vs vendor lock-in
- GDS/OTA: significant channel share, pricing exposure
- Mitigants: proprietary tech, multi-sourcing
Energy and maintenance ecosystems
Fuel providers, charging network operators and maintenance partners materially drive Europcar Mobility Group operating costs and uptime; in 2024 Europe had an estimated 650,000 public charge points, concentrating supplier leverage in EV-heavy markets where fragmented access raises costs and downtime. Service-level agreements and bulk fuel/energy procurement narrow price volatility, while growing in-house maintenance capacity lowers supplier dependency.
- Charging density 2024: ~650,000 public points (EU)
- SLA and bulk buys reduce cost volatility
- In-house maintenance cuts supplier power and downtime
OEM concentration and airport fees compress margins; funding at ~4%
OEM concentration for Europcar’s ~300,000-vehicle fleet in 2024 gives suppliers pricing and delivery leverage, compressing margins despite long-term purchase agreements. Airport/rail concession landlords exert outsized allocation and fee power, risking ~33% on-site demand losses if repriced. Funding dependence (ECB avg rate ~4% in 2024) and critical IT/telematics vendors amplify supplier bargaining power; 2024 EU public charge points ~650,000.
| Metric | 2024 value | Impact |
|---|---|---|
| Fleet size | ~300,000 vehicles | High OEM leverage |
| ECB policy rate | ~4% avg | Higher funding/lease costs |
| Public charge points (EU) | ~650,000 | Charging access variability |
| Revenue | €2.1bn (2023) | Funding/negotiation strength |
What is included in the product
 Detailed Word Document
Tailored exclusively for Europcar Mobility Group, this Porter’s Five Forces analysis uncovers key drivers of competition, customer and supplier influence, entry barriers, substitutes and disruptive threats that impact pricing, profitability and market share.

 Customizable Excel Spreadsheet
A concise, one-sheet Porter’s Five Forces analysis for Europcar Mobility Group that highlights supplier and buyer power, rivalry, substitutes, and entry threats—speeding strategic decisions and eliminating lengthy research bottlenecks for decks and boardroom use.
Customers Bargaining Power

Highly price-sensitive leisure segment
Leisure renters heavily compare rates across OTAs and metasearch, driving price transparency and forcing Europcar to match market offers; Europcar Mobility Group reported roughly €2.0bn revenue in 2023, highlighting the segment's scale. Low switching costs amplify customer bargaining power, so promotions and dynamic pricing are required to convert price-sensitive buyers. Strong brand trust and valuable ancillaries (GPS, insurance) can partially reduce elasticity and win bookings.
Large corporate accounts
Enterprise clients negotiate volume discounts and SLAs, using predictable demand to push down rates and tighten contractual terms. Multi-year contracts stabilize utilization but often compress margins through guaranteed pricing. Europcar Mobility Group's cross-border network and reporting tools across over 140 countries help retain these accounts by offering centralized billing and consistent service metrics.

Intermediaries and brokers
OTAs, brokers and TMCs bundle demand and commonly charge commissions of 15–30%, allowing them to divert traffic rapidly and push Europcar’s acquisition costs higher; preferential placement on OTA platforms depends heavily on price and availability algorithms, while strengthening direct channels and loyalty programs has proven to reclaim bargaining power by shifting bookings off commission-bearing intermediaries.

Service quality and reviews
Customers weigh NPS, queue times and damage policies heavily; negative reviews can divert demand to rivals almost immediately, pressuring Europcar to prioritize service consistency. Transparent pricing and frictionless pickup/return reduce churn, while digital check-in and clear insurance options rebuild trust and shorten handling times.
- NPS impact on loyalty
- Queue times drive defections
- Damage policies affect booking risk
- Digital check-in increases trust
- Transparent pricing lowers churn
Substitution-ready urban users
Urban customers can pivot to car-sharing, ride-hailing or public transit, giving them strong leverage; Europcar Mobility Group reported about €1.9bn revenue in 2023, highlighting competitive pressure in core markets.
Bundled mobility passes and hourly pricing help retain users since convenience often outweighs small price gaps—urban consumers value time and ease over marginal savings.
- High outside options: car-sharing/ride-hail/public transit
- 2023 benchmark: Europcar ~€1.9bn revenue
- Retention tools: bundles, hourly rates; convenience > slight price cuts
Leisure renters force dynamic pricing; OTAs take 15–30%, direct channels win
Leisure renters price-compare across OTAs/metasearch, forcing dynamic pricing; Europcar Mobility Group reported roughly €2.0bn revenue in 2023. Low switching costs and urban alternatives (car‑share, ride‑hail) raise customer bargaining power, while ancillaries and brand trust reduce elasticity. OTAs/TMCs take 15–30% commissions, so direct channels and loyalty rebuild margin.
| Metric | Value |
|---|---|
| Revenue (2023) | ~€2.0bn |
| OTA/TMC commission | 15–30% |
| Geographic reach | ~140 countries |
Same Document Delivered
Europcar Mobility Group Porter's Five Forces Analysis
This preview is the actual Europcar Mobility Group Porter's Five Forces analysis you’ll receive after purchase—fully formatted, complete, and ready to use. It examines competitive rivalry, supplier and buyer power, threat of substitutes, and barriers to entry. No placeholders or samples; buy and download this exact file instantly.

Original: $10.00
-65%$10.00
$3.50Product Information
Product Information
Shipping & Returns
Shipping & Returns
Description
Elevate Your Analysis with the Complete Porter's Five Forces Analysis
Europcar Mobility Group faces intense competitive rivalry, moderate supplier leverage, growing buyer expectations, and a rising threat from mobility substitutes and new entrants disrupting traditional rental models. This snapshot highlights key pressures and strategic levers. Unlock the full Porter's Five Forces Analysis for force-by-force ratings, visuals, and actionable recommendations to inform investment or strategic decisions.
Suppliers Bargaining Power
Concentrated OEM dependence
Europcar's fleet of about 300,000 vehicles in 2024 depends on a small number of OEMs, giving those suppliers leverage over pricing, delivery timing and model mix during tight production cycles.
That concentration elevates supplier power and can compress margins — Europcar noted higher fleet procurement costs in 2024 versus 2023.
Long-term purchase agreements and volume commitments partially mitigate this risk but do not fully eliminate exposure to OEM supply constraints.
Airport and real-estate concessions
Prime airport and rail-station locations are controlled by a few landlords and authorities, giving them outsized leverage over allocation and concession terms. Concession fees and strict allocation rules can be binding, and losing or repricing a concession can cut capture of on‑site demand by roughly 33% at affected hubs. Diversifying into off‑airport sites and digital delivery channels reduces exposure and preserves revenue resilience.
Financing and leasing partners
Europcar’s fleet CAPEX and refinancing needs keep it dependent on banks and lessors, especially for ~multi-year vehicle replacement cycles; Europe’s ECB policy rate averaged about 4% in 2024, directly lifting funding costs and lease rates. Covenant terms and interest-rate cycles therefore materially affect cost-to-serve and fleet flexibility. Firms with stronger balance sheets or asset-backed funding negotiate lower spreads and longer tenors. Market volatility tightens capital, increasing supplier bargaining power.
Telematics, IT, and distribution platforms
Reservation systems, telematics and GDS/OTA channels form critical infrastructure for Europcar Mobility Group; with c.€2.1bn revenue in 2023 and a ~230,000-vehicle fleet, outages or unfavorable vendor terms can directly reduce utilization and pricing control. High switching costs and integration complexity increase supplier leverage, while building proprietary platforms and multi-sourcing telematics vendors reduces dependency and risk.
- Reservation systems: single points of failure
- Telematics: fleet visibility vs vendor lock-in
- GDS/OTA: significant channel share, pricing exposure
- Mitigants: proprietary tech, multi-sourcing
Energy and maintenance ecosystems
Fuel providers, charging network operators and maintenance partners materially drive Europcar Mobility Group operating costs and uptime; in 2024 Europe had an estimated 650,000 public charge points, concentrating supplier leverage in EV-heavy markets where fragmented access raises costs and downtime. Service-level agreements and bulk fuel/energy procurement narrow price volatility, while growing in-house maintenance capacity lowers supplier dependency.
- Charging density 2024: ~650,000 public points (EU)
- SLA and bulk buys reduce cost volatility
- In-house maintenance cuts supplier power and downtime
OEM concentration and airport fees compress margins; funding at ~4%
OEM concentration for Europcar’s ~300,000-vehicle fleet in 2024 gives suppliers pricing and delivery leverage, compressing margins despite long-term purchase agreements. Airport/rail concession landlords exert outsized allocation and fee power, risking ~33% on-site demand losses if repriced. Funding dependence (ECB avg rate ~4% in 2024) and critical IT/telematics vendors amplify supplier bargaining power; 2024 EU public charge points ~650,000.
| Metric | 2024 value | Impact |
|---|---|---|
| Fleet size | ~300,000 vehicles | High OEM leverage |
| ECB policy rate | ~4% avg | Higher funding/lease costs |
| Public charge points (EU) | ~650,000 | Charging access variability |
| Revenue | €2.1bn (2023) | Funding/negotiation strength |
What is included in the product
Detailed Word Document
Tailored exclusively for Europcar Mobility Group, this Porter’s Five Forces analysis uncovers key drivers of competition, customer and supplier influence, entry barriers, substitutes and disruptive threats that impact pricing, profitability and market share.
Customizable Excel Spreadsheet
A concise, one-sheet Porter’s Five Forces analysis for Europcar Mobility Group that highlights supplier and buyer power, rivalry, substitutes, and entry threats—speeding strategic decisions and eliminating lengthy research bottlenecks for decks and boardroom use.
Customers Bargaining Power
Highly price-sensitive leisure segment
Leisure renters heavily compare rates across OTAs and metasearch, driving price transparency and forcing Europcar to match market offers; Europcar Mobility Group reported roughly €2.0bn revenue in 2023, highlighting the segment's scale. Low switching costs amplify customer bargaining power, so promotions and dynamic pricing are required to convert price-sensitive buyers. Strong brand trust and valuable ancillaries (GPS, insurance) can partially reduce elasticity and win bookings.
Large corporate accounts
Enterprise clients negotiate volume discounts and SLAs, using predictable demand to push down rates and tighten contractual terms. Multi-year contracts stabilize utilization but often compress margins through guaranteed pricing. Europcar Mobility Group's cross-border network and reporting tools across over 140 countries help retain these accounts by offering centralized billing and consistent service metrics.
Intermediaries and brokers
OTAs, brokers and TMCs bundle demand and commonly charge commissions of 15–30%, allowing them to divert traffic rapidly and push Europcar’s acquisition costs higher; preferential placement on OTA platforms depends heavily on price and availability algorithms, while strengthening direct channels and loyalty programs has proven to reclaim bargaining power by shifting bookings off commission-bearing intermediaries.
Service quality and reviews
Customers weigh NPS, queue times and damage policies heavily; negative reviews can divert demand to rivals almost immediately, pressuring Europcar to prioritize service consistency. Transparent pricing and frictionless pickup/return reduce churn, while digital check-in and clear insurance options rebuild trust and shorten handling times.
- NPS impact on loyalty
- Queue times drive defections
- Damage policies affect booking risk
- Digital check-in increases trust
- Transparent pricing lowers churn
Substitution-ready urban users
Urban customers can pivot to car-sharing, ride-hailing or public transit, giving them strong leverage; Europcar Mobility Group reported about €1.9bn revenue in 2023, highlighting competitive pressure in core markets.
Bundled mobility passes and hourly pricing help retain users since convenience often outweighs small price gaps—urban consumers value time and ease over marginal savings.
- High outside options: car-sharing/ride-hail/public transit
- 2023 benchmark: Europcar ~€1.9bn revenue
- Retention tools: bundles, hourly rates; convenience > slight price cuts
Leisure renters force dynamic pricing; OTAs take 15–30%, direct channels win
Leisure renters price-compare across OTAs/metasearch, forcing dynamic pricing; Europcar Mobility Group reported roughly €2.0bn revenue in 2023. Low switching costs and urban alternatives (car‑share, ride‑hail) raise customer bargaining power, while ancillaries and brand trust reduce elasticity. OTAs/TMCs take 15–30% commissions, so direct channels and loyalty rebuild margin.
| Metric | Value |
|---|---|
| Revenue (2023) | ~€2.0bn |
| OTA/TMC commission | 15–30% |
| Geographic reach | ~140 countries |
Same Document Delivered
Europcar Mobility Group Porter's Five Forces Analysis
This preview is the actual Europcar Mobility Group Porter's Five Forces analysis you’ll receive after purchase—fully formatted, complete, and ready to use. It examines competitive rivalry, supplier and buyer power, threat of substitutes, and barriers to entry. No placeholders or samples; buy and download this exact file instantly.