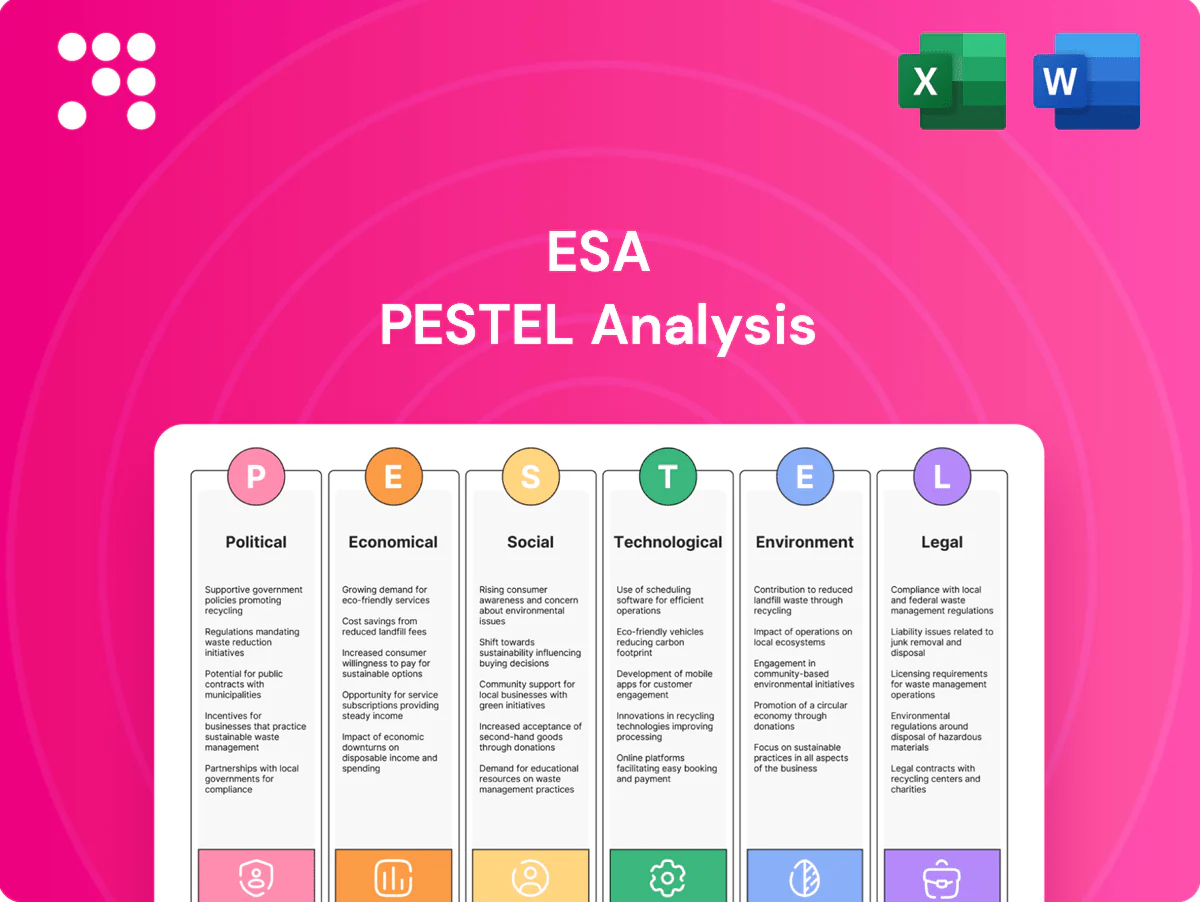
ESA PESTLE Analysis

Plan Smarter. Present Sharper. Compete Stronger.
Gain a strategic advantage with our focused PESTLE Analysis of ESA—uncover how political, economic, social, technological, legal, and environmental forces are reshaping its trajectory. Ideal for investors and strategists, this concise brief points to risks and opportunities; buy the full analysis to access the complete, actionable intelligence instantly.
Political factors

Federal infrastructure funding priorities
The IIJA's $1.2 trillion package, including roughly $65 billion targeted at grid resilience and modernization, directly feeds utility capex pipelines and grid-hardening programs. Congressional or administration shifts can reallocate those funds or push timelines, creating execution risk. ESA would gain if Mid-Atlantic/Southeast award cycles accelerate given regional demand for grid upgrades. Reduced or delayed federal outlays tighten bid pipelines and compress near-term revenue visibility.
Energy transition policy direction
Policies favoring electrification and renewables shift spend from gas pipelines toward grid upgrades, reinforced by the Inflation Reduction Act’s expanded clean-energy tax credits;
conversely, federal and state support for natural gas as a bridge fuel sustains pipeline maintenance while natural gas supplied about 38% of US electricity in 2023 (EIA);
state RPS rules, e.g., California 60% by 2030 and 100% by 2045, shape utility plans in ESA territories and policy volatility complicates long-term resource planning.

Permitting and siting regimes
NEPA and state siting boards materially affect project lead times and costs; GAO data show full EIS processes averaged about 4.5 years. Streamlining federal or state reviews can pull forward construction schedules and cashflow; tightening requirements increases delay and mobilization risk. Local county approval timelines vary widely across ESA’s footprint, and more predictable permitting measurably improves bid accuracy and margins.

Trade and procurement politics
Tariffs such as the 25% Section 232 steel duties and strengthened Buy America rules tied to the $550bn federal infrastructure program raise costs for steel, transformers and specialty equipment, while limiting foreign competition. Transformer lead times hit ~18 months in 2023–24, straining supplier contracts and bid accuracy. ESA must align bids to evolving sourcing mandates and waiver risks.
- Tariffs: 25% steel duty
- Infrastructure spend: $550bn federal
- Lead times: ~18 months for transformers
Labor and apprenticeship incentives
Prevailing wage and apprenticeship rules tie to federally funded utility projects and IRA-era clean energy tax incentives (roughly $369 billion in decarbonization incentives), and meeting those thresholds can raise award competitiveness by unlocking bonus credits and contracts.
- Prevailing wage linkage
- Apprenticeship bonus eligibility
- Higher compliance/admin burden
- Political support strengthens skilled-trades pipelines
Federal electrification surge reshapes grid investments; tariffs, lead times squeeze margins
IIJA $1.2T with ~$65B for grid plus IRA ~$369B shifts spend to electrification; natural gas was ~38% of US generation in 2023 so pipeline work persists. Tariffs (25% steel), Buy America and transformer ~18-month lead times raise costs and margin risk. Prevailing wage/apprenticeship rules boost award competitiveness but increase compliance burden.
| Item | Value |
|---|---|
| IIJA | $1.2T |
| Grid funding | $65B |
| IRA incentives | $369B |
| Gas share (2023) | 38% |
| Steel tariff | 25% |
| Transformer LT | ~18 mo |
What is included in the product
 Detailed Word Document
Explores how Political, Economic, Social, Technological, Environmental and Legal forces uniquely affect the ESA, with data-backed trends and sector-specific subpoints; designed for executives and investors, it delivers forward-looking insights, scenario support and clean formatting ready for plans or decks.

 Customizable Excel Spreadsheet
ESA PESTLE Analysis delivers a concise, visually segmented summary of external factors that can be dropped into presentations or shared across teams, with editable notes for local context—streamlining risk discussions and strategic alignment.
Economic factors

Utility capex cycles and rate cases
Regulated utilities plan multi-year capex that anchor ESA backlog, with EEI reporting investor-owned utilities projecting roughly $1.2 trillion in electric infrastructure investment 2024–2033, underpinning long-duration project pipelines. Approved rate recovery drives project flow and timing, while adverse rate case outcomes can defer or reprioritize work. Stable RAB growth in target states supports steady demand for ESA services.
Interest rates and financing costs
Higher benchmark rates (Fed funds 5.25–5.50% and US 10-year ~4.3% in mid‑2025) push utility WACC higher, reprioritizing CAPEX and delaying marginal projects. ESA’s bond yields and equipment financing costs rise in lockstep, increasing service cost. Easing rates could unlock grid and pipeline upgrades by lowering capital hurdles. Bid strategies must model capital‑cost sensitivity and scenario WACC shifts.

Materials inflation and supply chain volatility
Steel pipe, conductors and transformers have seen pronounced price swings and extended lead times, pressuring project margins and schedules. Escalation clauses and disciplined inventory planning are being used to protect margins and stabilize delivery. Supplier diversification and dual-sourcing reduce disruption risk across critical components. Accurate passthrough mechanisms are essential when negotiating fixed-price contracts to avoid absorbing raw-material volatility.

Skilled labor availability and wages
Tight craft labor markets pushed wages up an estimated 6–9% YoY in 2024, compressing ESA margins and reducing utilization. Overtime and training mitigate shortages but raise per-technician costs ~10–25%. Regional labor pools vary, with construction unemployment ~2.5–6% across ESA service areas in 2024. Productivity tools and smarter scheduling can lift output 10–20%, stabilizing unit economics.
- Wage inflation: 6–9% YoY (2024)
- Overtime/training cost impact: +10–25%
- Regional unemployment range: 2.5–6%
- Productivity uplift: +10–20%
Macro slowdown or storm-driven spikes
Recessions delay discretionary upgrades while routine maintenance stays resilient; IMF projected global growth around 3.0% in 2024, signaling cyclical pressure on capex. Severe weather and catastrophes drove insured losses near USD 100bn in 2023 (Swiss Re sigma 2024), producing sharp emergency-repair spikes. Firms need 6–12 months cash runway to bridge cyclical and event-driven swings; a diversified customer mix lowers revenue volatility.
- Recession pressure on capex: IMF 2024 global growth ~3.0%
- Weather spike: insured losses ≈ USD 100bn in 2023 (Swiss Re)
- Cash runway: maintain 6–12 months working capital
- Diversification reduces revenue volatility
Federal electrification surge reshapes grid investments; tariffs, lead times squeeze margins
Regulated utilities' $1.2T 2024–33 capex anchors long ESA pipelines; approved rate recovery dictates timing. Fed funds 5.25–5.50% and US 10y ~4.3% (mid‑2025) raise WACC, delaying marginal projects. Wage inflation 6–9% (2024) and material/lead‑time swings squeeze margins; insured losses ≈ $100bn (2023) create emergency-repair spikes.
| Metric | Value |
|---|---|
| Utility capex (2024–33) | $1.2T |
| Fed funds / US10y | 5.25–5.50% / ~4.3% |
| Wage inflation (2024) | 6–9% |
| Insured losses (2023) | $100bn |
Preview Before You Purchase
ESA PESTLE Analysis
The preview shown here is the exact ESA PESTLE Analysis document you’ll receive after purchase—fully formatted and ready to use. The layout, content, and structure visible match the downloadable file. No placeholders or teasers; this is the final, professional report you’ll own immediately after checkout.

Original: $10.00
-65%$10.00
$3.50Product Information
Product Information
Shipping & Returns
Shipping & Returns
Description
Plan Smarter. Present Sharper. Compete Stronger.
Gain a strategic advantage with our focused PESTLE Analysis of ESA—uncover how political, economic, social, technological, legal, and environmental forces are reshaping its trajectory. Ideal for investors and strategists, this concise brief points to risks and opportunities; buy the full analysis to access the complete, actionable intelligence instantly.
Political factors
Federal infrastructure funding priorities
The IIJA's $1.2 trillion package, including roughly $65 billion targeted at grid resilience and modernization, directly feeds utility capex pipelines and grid-hardening programs. Congressional or administration shifts can reallocate those funds or push timelines, creating execution risk. ESA would gain if Mid-Atlantic/Southeast award cycles accelerate given regional demand for grid upgrades. Reduced or delayed federal outlays tighten bid pipelines and compress near-term revenue visibility.
Energy transition policy direction
Policies favoring electrification and renewables shift spend from gas pipelines toward grid upgrades, reinforced by the Inflation Reduction Act’s expanded clean-energy tax credits;
conversely, federal and state support for natural gas as a bridge fuel sustains pipeline maintenance while natural gas supplied about 38% of US electricity in 2023 (EIA);
state RPS rules, e.g., California 60% by 2030 and 100% by 2045, shape utility plans in ESA territories and policy volatility complicates long-term resource planning.
Permitting and siting regimes
NEPA and state siting boards materially affect project lead times and costs; GAO data show full EIS processes averaged about 4.5 years. Streamlining federal or state reviews can pull forward construction schedules and cashflow; tightening requirements increases delay and mobilization risk. Local county approval timelines vary widely across ESA’s footprint, and more predictable permitting measurably improves bid accuracy and margins.
Trade and procurement politics
Tariffs such as the 25% Section 232 steel duties and strengthened Buy America rules tied to the $550bn federal infrastructure program raise costs for steel, transformers and specialty equipment, while limiting foreign competition. Transformer lead times hit ~18 months in 2023–24, straining supplier contracts and bid accuracy. ESA must align bids to evolving sourcing mandates and waiver risks.
- Tariffs: 25% steel duty
- Infrastructure spend: $550bn federal
- Lead times: ~18 months for transformers
Labor and apprenticeship incentives
Prevailing wage and apprenticeship rules tie to federally funded utility projects and IRA-era clean energy tax incentives (roughly $369 billion in decarbonization incentives), and meeting those thresholds can raise award competitiveness by unlocking bonus credits and contracts.
- Prevailing wage linkage
- Apprenticeship bonus eligibility
- Higher compliance/admin burden
- Political support strengthens skilled-trades pipelines
Federal electrification surge reshapes grid investments; tariffs, lead times squeeze margins
IIJA $1.2T with ~$65B for grid plus IRA ~$369B shifts spend to electrification; natural gas was ~38% of US generation in 2023 so pipeline work persists. Tariffs (25% steel), Buy America and transformer ~18-month lead times raise costs and margin risk. Prevailing wage/apprenticeship rules boost award competitiveness but increase compliance burden.
| Item | Value |
|---|---|
| IIJA | $1.2T |
| Grid funding | $65B |
| IRA incentives | $369B |
| Gas share (2023) | 38% |
| Steel tariff | 25% |
| Transformer LT | ~18 mo |
What is included in the product
Detailed Word Document
Explores how Political, Economic, Social, Technological, Environmental and Legal forces uniquely affect the ESA, with data-backed trends and sector-specific subpoints; designed for executives and investors, it delivers forward-looking insights, scenario support and clean formatting ready for plans or decks.
Customizable Excel Spreadsheet
ESA PESTLE Analysis delivers a concise, visually segmented summary of external factors that can be dropped into presentations or shared across teams, with editable notes for local context—streamlining risk discussions and strategic alignment.
Economic factors
Utility capex cycles and rate cases
Regulated utilities plan multi-year capex that anchor ESA backlog, with EEI reporting investor-owned utilities projecting roughly $1.2 trillion in electric infrastructure investment 2024–2033, underpinning long-duration project pipelines. Approved rate recovery drives project flow and timing, while adverse rate case outcomes can defer or reprioritize work. Stable RAB growth in target states supports steady demand for ESA services.
Interest rates and financing costs
Higher benchmark rates (Fed funds 5.25–5.50% and US 10-year ~4.3% in mid‑2025) push utility WACC higher, reprioritizing CAPEX and delaying marginal projects. ESA’s bond yields and equipment financing costs rise in lockstep, increasing service cost. Easing rates could unlock grid and pipeline upgrades by lowering capital hurdles. Bid strategies must model capital‑cost sensitivity and scenario WACC shifts.
Materials inflation and supply chain volatility
Steel pipe, conductors and transformers have seen pronounced price swings and extended lead times, pressuring project margins and schedules. Escalation clauses and disciplined inventory planning are being used to protect margins and stabilize delivery. Supplier diversification and dual-sourcing reduce disruption risk across critical components. Accurate passthrough mechanisms are essential when negotiating fixed-price contracts to avoid absorbing raw-material volatility.
Skilled labor availability and wages
Tight craft labor markets pushed wages up an estimated 6–9% YoY in 2024, compressing ESA margins and reducing utilization. Overtime and training mitigate shortages but raise per-technician costs ~10–25%. Regional labor pools vary, with construction unemployment ~2.5–6% across ESA service areas in 2024. Productivity tools and smarter scheduling can lift output 10–20%, stabilizing unit economics.
- Wage inflation: 6–9% YoY (2024)
- Overtime/training cost impact: +10–25%
- Regional unemployment range: 2.5–6%
- Productivity uplift: +10–20%
Macro slowdown or storm-driven spikes
Recessions delay discretionary upgrades while routine maintenance stays resilient; IMF projected global growth around 3.0% in 2024, signaling cyclical pressure on capex. Severe weather and catastrophes drove insured losses near USD 100bn in 2023 (Swiss Re sigma 2024), producing sharp emergency-repair spikes. Firms need 6–12 months cash runway to bridge cyclical and event-driven swings; a diversified customer mix lowers revenue volatility.
- Recession pressure on capex: IMF 2024 global growth ~3.0%
- Weather spike: insured losses ≈ USD 100bn in 2023 (Swiss Re)
- Cash runway: maintain 6–12 months working capital
- Diversification reduces revenue volatility
Federal electrification surge reshapes grid investments; tariffs, lead times squeeze margins
Regulated utilities' $1.2T 2024–33 capex anchors long ESA pipelines; approved rate recovery dictates timing. Fed funds 5.25–5.50% and US 10y ~4.3% (mid‑2025) raise WACC, delaying marginal projects. Wage inflation 6–9% (2024) and material/lead‑time swings squeeze margins; insured losses ≈ $100bn (2023) create emergency-repair spikes.
| Metric | Value |
|---|---|
| Utility capex (2024–33) | $1.2T |
| Fed funds / US10y | 5.25–5.50% / ~4.3% |
| Wage inflation (2024) | 6–9% |
| Insured losses (2023) | $100bn |
Preview Before You Purchase
ESA PESTLE Analysis
The preview shown here is the exact ESA PESTLE Analysis document you’ll receive after purchase—fully formatted and ready to use. The layout, content, and structure visible match the downloadable file. No placeholders or teasers; this is the final, professional report you’ll own immediately after checkout.











