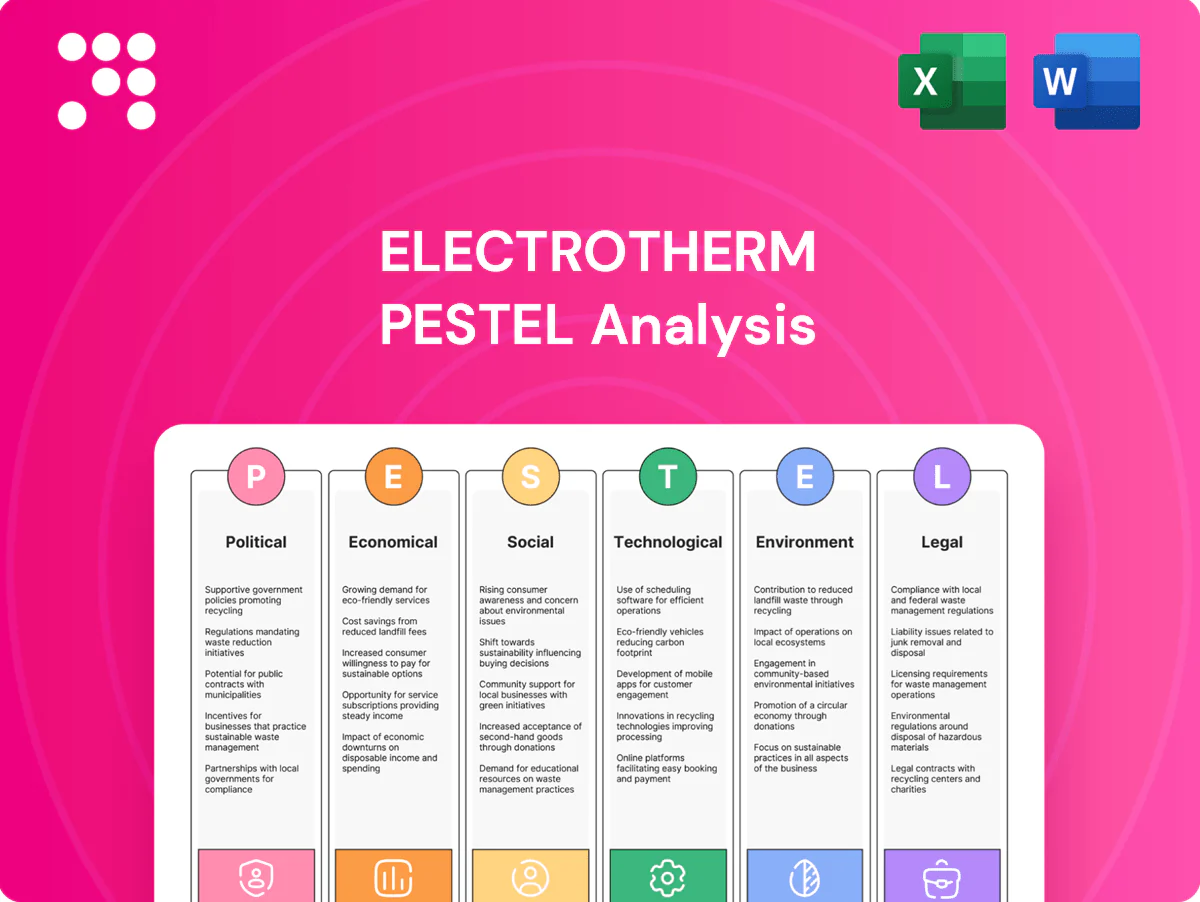
Electrotherm PESTLE Analysis

Your Shortcut to Market Insight Starts Here
Unlock how political shifts, economic cycles, and technological change are shaping Electrotherm’s competitive position—our PESTLE distills these forces into clear implications for risk and growth. Ideal for investors, strategists, and analysts, it’s fully researched and actionable. Purchase the full PESTLE now to get the complete, editable report and make decisions with confidence.
Political factors

Infrastructure push
Rising government capex—backed by the Rs 111 lakh crore National Infrastructure Pipeline (2020–25) and Indian Railways’ ~Rs 2.4 lakh crore capex plan for 2024–25—boosts demand for steel and ductile iron pipes, supporting Electrotherm’s order book. Policy continuity under central infrastructure missions can stabilize multi-year orders. Election-driven delays or reprioritization can defer projects. Close alignment with public procurement norms is essential.
Make in India incentives
Make in India incentives, backed by PLI schemes with a combined outlay of about INR 1.97 lakh crore, and Public Procurement (Preference to Make in India) rules (Class I local supplier typically >=50% local content) boost demand for domestic induction furnaces and import substitution. Local-content preference and PLI-linked benefits improve Electrotherm’s competitiveness, but compliance thresholds, frequent audits by DPIIT and line ministries raise administrative costs, and policy design shifts can compress margins.

Trade tariffs and duties
Customs duties on steel, scrap and capital goods (India applied basic customs duties in the 7.5–15% range on many steel lines in 2023–24) raise Electrotherm’s input and capex costs and compress margins. Anti-dumping measures (India and other markets have levied AD duties on Chinese steel up to several hundred USD/ton) can protect domestic pricing but risk retaliatory barriers abroad. RoDTEP export rebates (rates up to ~4.5% on select products in recent schedules) and tariff volatility complicate long-term contracts and pricing certainty.

Energy and mining policy
Electricity pricing (industrial tariffs ~7–12 INR/kWh in 2024) and open access rules directly drive Electrotherm melting costs and margin volatility.
Power-market reforms and ~20 GW renewable additions in 2024 can lower peak tariffs but change availability and time-of-day charges for electric melting loads.
Scrap import norms (duty adjustments) and tighter mining rules affect feedstock supply; clearer regulation reduces procurement risk and working-capital volatility.
- tariffs: 7–12 INR/kWh
- renewable additions: ~20 GW (2024)
- scrap duty & mining clarity: lower procurement risk
State-level regulations
State-level enforcement of environment and labor rules varies across India’s 28 states and 8 union territories, forcing Electrotherm to tailor location, permits and liaisoning to local stringency; manufacturing contributed about 17% of GDP in 2023–24, increasing state procurement leverage. Policy fragmentation raises compliance costs but creates regional sales opportunities through state procurement preferences in industrial hubs like Gujarat, Maharashtra and Tamil Nadu.
Capex surge fuels steel and pipe demand; PLI rules, tariffs and power costs pressure margins
Rising government capex (NIP Rs 111 lakh crore; Railways ~Rs 2.4 lakh crore for 2024–25) supports steel and pipe demand and stabilizes multi-year orders. Make in India/PLI (outlay ~INR 1.97 lakh crore) and local-content rules boost domestic induction furnace demand but raise compliance costs. Input tariffs (customs 7.5–15% on many steel lines), power tariffs (7–12 INR/kWh) and state-level regulation variability drive margin and execution risk.
| Factor | Key figure |
|---|---|
| National Infra Pipeline | Rs 111 lakh crore (2020–25) |
| Railways capex | ~Rs 2.4 lakh crore (2024–25) |
| PLI outlay | ~INR 1.97 lakh crore |
| Power tariffs | 7–12 INR/kWh (2024) |
| Renewables added | ~20 GW (2024) |
| Manufacturing | ~17% GDP (2023–24) |
What is included in the product
 Detailed Word Document
Explores how macro-environmental forces—Political, Economic, Social, Technological, Environmental, and Legal—specifically impact Electrotherm’s business, with data-backed trends, region- and industry-specific examples, forward-looking insights for strategy and financing, and actionable points for executives and investors.

 Customizable Excel Spreadsheet
Visually segmented by PESTLE categories for quick interpretation at a glance, the Electrotherm PESTLE analysis condenses external risks and opportunities into a presentation-ready summary. It also allows users to add context-specific notes, making it ideal for rapid alignment across teams and client reports.
Economic factors

Steel demand cycles
Cyclical end-markets—construction (~50% of global steel use) and autos (~7–8%)—along with capital goods drive furnace and steel orders; World Steel Association reports ~1.9 billion tonnes crude steel in 2024. Upcycles lift pricing power and utilization, improving spreads; downcycles compress margins and cash flow. Electrotherm’s diversification into pipes and EPC smooths volatility, while accurate demand forecasting preserves working capital and reduces inventory risk.
Input cost volatility
Sharp swings in scrap (HMS) and alloy prices—often 20–40% y/y in 2024–25—and 15–30% moves in electrodes/refractories squeeze margins. Power and transmission (typical Gujarat industrial tariffs INR 6–9/kWh plus ~INR 0.5–1/kWh charges) drive melt costs—at ~450 kWh/t raising energy cost ~INR 2,700–4,050/t. Active hedging, pass-through clauses and tight inventory (30–45 days) are critical to limit margin shocks.

Interest rates and capex
Higher interest rates (RBI policy repo 6.5% as of July 2025) raise financing costs for Electrotherm and customer capex plans, delaying furnace upgrades and capacity additions; conversely, lower rates unlock retrofit and new furnace projects. Project finance availability directly affects EPC order-to-revenue conversion, while prudent leverage preserves bid competitiveness and win rates.

Currency fluctuations
Infrastructure multiplier
Public and private investment in logistics, water and urban services—driven by Indias National Infrastructure Pipeline (₹111 lakh crore through 2020–25) and Union Budget capex of ₹10 lakh crore for 2024–25—underpins pipe and steel demand and raises aftermarket service needs. Approval delays can defer revenue recognition, making backlog quality a crucial economic buffer for Electrotherm.
- Infrastructure capex: ₹111 lakh crore NIP
- 2024–25 capex: ₹10 lakh crore
- Aftermarket demand: rising
- Backlog quality: key buffer
Capex surge fuels steel and pipe demand; PLI rules, tariffs and power costs pressure margins
Cyclical demand (construction/autos) and 2024 crude steel ~1.9bn t drive furnace orders; diversification into pipes/EPC smooths volatility. Scrap/alloy swings (20–40% y/y 2024–25) plus energy (~INR 2,700–4,050/t) and RBI repo 6.5% (Jul 2025) compress margins; INR ≈83/USD raises import/export risk. Infrastructure capex (NIP ₹111 lakh crore; 2024–25 ₹10 lakh crore) underpins medium‑term demand.
| Metric | Value |
|---|---|
| Crude steel (2024) | ~1.9 bn t |
| RBI policy repo (Jul 2025) | 6.5% |
| INR/USD (mid‑2025) | ~83 |
| NIP (2020–25) | ₹111 lakh crore |
| Union capex (2024–25) | ₹10 lakh crore |
| Energy cost (approx) | INR 2,700–4,050/t |
Same Document Delivered
Electrotherm PESTLE Analysis
The Electrotherm PESTLE Analysis preview shown here is the exact document you’ll receive after purchase—fully formatted and ready to use. The layout, content, and structure visible are identical to the downloadable file you’ll get immediately after checkout. No placeholders or teasers; this is the final, professionally structured report you’ll own.

Product Information
Product Information
Shipping & Returns
Shipping & Returns
Description
Your Shortcut to Market Insight Starts Here
Unlock how political shifts, economic cycles, and technological change are shaping Electrotherm’s competitive position—our PESTLE distills these forces into clear implications for risk and growth. Ideal for investors, strategists, and analysts, it’s fully researched and actionable. Purchase the full PESTLE now to get the complete, editable report and make decisions with confidence.
Political factors
Infrastructure push
Rising government capex—backed by the Rs 111 lakh crore National Infrastructure Pipeline (2020–25) and Indian Railways’ ~Rs 2.4 lakh crore capex plan for 2024–25—boosts demand for steel and ductile iron pipes, supporting Electrotherm’s order book. Policy continuity under central infrastructure missions can stabilize multi-year orders. Election-driven delays or reprioritization can defer projects. Close alignment with public procurement norms is essential.
Make in India incentives
Make in India incentives, backed by PLI schemes with a combined outlay of about INR 1.97 lakh crore, and Public Procurement (Preference to Make in India) rules (Class I local supplier typically >=50% local content) boost demand for domestic induction furnaces and import substitution. Local-content preference and PLI-linked benefits improve Electrotherm’s competitiveness, but compliance thresholds, frequent audits by DPIIT and line ministries raise administrative costs, and policy design shifts can compress margins.
Trade tariffs and duties
Customs duties on steel, scrap and capital goods (India applied basic customs duties in the 7.5–15% range on many steel lines in 2023–24) raise Electrotherm’s input and capex costs and compress margins. Anti-dumping measures (India and other markets have levied AD duties on Chinese steel up to several hundred USD/ton) can protect domestic pricing but risk retaliatory barriers abroad. RoDTEP export rebates (rates up to ~4.5% on select products in recent schedules) and tariff volatility complicate long-term contracts and pricing certainty.
Energy and mining policy
Electricity pricing (industrial tariffs ~7–12 INR/kWh in 2024) and open access rules directly drive Electrotherm melting costs and margin volatility.
Power-market reforms and ~20 GW renewable additions in 2024 can lower peak tariffs but change availability and time-of-day charges for electric melting loads.
Scrap import norms (duty adjustments) and tighter mining rules affect feedstock supply; clearer regulation reduces procurement risk and working-capital volatility.
- tariffs: 7–12 INR/kWh
- renewable additions: ~20 GW (2024)
- scrap duty & mining clarity: lower procurement risk
State-level regulations
State-level enforcement of environment and labor rules varies across India’s 28 states and 8 union territories, forcing Electrotherm to tailor location, permits and liaisoning to local stringency; manufacturing contributed about 17% of GDP in 2023–24, increasing state procurement leverage. Policy fragmentation raises compliance costs but creates regional sales opportunities through state procurement preferences in industrial hubs like Gujarat, Maharashtra and Tamil Nadu.
Capex surge fuels steel and pipe demand; PLI rules, tariffs and power costs pressure margins
Rising government capex (NIP Rs 111 lakh crore; Railways ~Rs 2.4 lakh crore for 2024–25) supports steel and pipe demand and stabilizes multi-year orders. Make in India/PLI (outlay ~INR 1.97 lakh crore) and local-content rules boost domestic induction furnace demand but raise compliance costs. Input tariffs (customs 7.5–15% on many steel lines), power tariffs (7–12 INR/kWh) and state-level regulation variability drive margin and execution risk.
| Factor | Key figure |
|---|---|
| National Infra Pipeline | Rs 111 lakh crore (2020–25) |
| Railways capex | ~Rs 2.4 lakh crore (2024–25) |
| PLI outlay | ~INR 1.97 lakh crore |
| Power tariffs | 7–12 INR/kWh (2024) |
| Renewables added | ~20 GW (2024) |
| Manufacturing | ~17% GDP (2023–24) |
What is included in the product
Detailed Word Document
Explores how macro-environmental forces—Political, Economic, Social, Technological, Environmental, and Legal—specifically impact Electrotherm’s business, with data-backed trends, region- and industry-specific examples, forward-looking insights for strategy and financing, and actionable points for executives and investors.
Customizable Excel Spreadsheet
Visually segmented by PESTLE categories for quick interpretation at a glance, the Electrotherm PESTLE analysis condenses external risks and opportunities into a presentation-ready summary. It also allows users to add context-specific notes, making it ideal for rapid alignment across teams and client reports.
Economic factors
Steel demand cycles
Cyclical end-markets—construction (~50% of global steel use) and autos (~7–8%)—along with capital goods drive furnace and steel orders; World Steel Association reports ~1.9 billion tonnes crude steel in 2024. Upcycles lift pricing power and utilization, improving spreads; downcycles compress margins and cash flow. Electrotherm’s diversification into pipes and EPC smooths volatility, while accurate demand forecasting preserves working capital and reduces inventory risk.
Input cost volatility
Sharp swings in scrap (HMS) and alloy prices—often 20–40% y/y in 2024–25—and 15–30% moves in electrodes/refractories squeeze margins. Power and transmission (typical Gujarat industrial tariffs INR 6–9/kWh plus ~INR 0.5–1/kWh charges) drive melt costs—at ~450 kWh/t raising energy cost ~INR 2,700–4,050/t. Active hedging, pass-through clauses and tight inventory (30–45 days) are critical to limit margin shocks.
Interest rates and capex
Higher interest rates (RBI policy repo 6.5% as of July 2025) raise financing costs for Electrotherm and customer capex plans, delaying furnace upgrades and capacity additions; conversely, lower rates unlock retrofit and new furnace projects. Project finance availability directly affects EPC order-to-revenue conversion, while prudent leverage preserves bid competitiveness and win rates.
Currency fluctuations
Infrastructure multiplier
Public and private investment in logistics, water and urban services—driven by Indias National Infrastructure Pipeline (₹111 lakh crore through 2020–25) and Union Budget capex of ₹10 lakh crore for 2024–25—underpins pipe and steel demand and raises aftermarket service needs. Approval delays can defer revenue recognition, making backlog quality a crucial economic buffer for Electrotherm.
- Infrastructure capex: ₹111 lakh crore NIP
- 2024–25 capex: ₹10 lakh crore
- Aftermarket demand: rising
- Backlog quality: key buffer
Capex surge fuels steel and pipe demand; PLI rules, tariffs and power costs pressure margins
Cyclical demand (construction/autos) and 2024 crude steel ~1.9bn t drive furnace orders; diversification into pipes/EPC smooths volatility. Scrap/alloy swings (20–40% y/y 2024–25) plus energy (~INR 2,700–4,050/t) and RBI repo 6.5% (Jul 2025) compress margins; INR ≈83/USD raises import/export risk. Infrastructure capex (NIP ₹111 lakh crore; 2024–25 ₹10 lakh crore) underpins medium‑term demand.
| Metric | Value |
|---|---|
| Crude steel (2024) | ~1.9 bn t |
| RBI policy repo (Jul 2025) | 6.5% |
| INR/USD (mid‑2025) | ~83 |
| NIP (2020–25) | ₹111 lakh crore |
| Union capex (2024–25) | ₹10 lakh crore |
| Energy cost (approx) | INR 2,700–4,050/t |
Same Document Delivered
Electrotherm PESTLE Analysis
The Electrotherm PESTLE Analysis preview shown here is the exact document you’ll receive after purchase—fully formatted and ready to use. The layout, content, and structure visible are identical to the downloadable file you’ll get immediately after checkout. No placeholders or teasers; this is the final, professionally structured report you’ll own.











