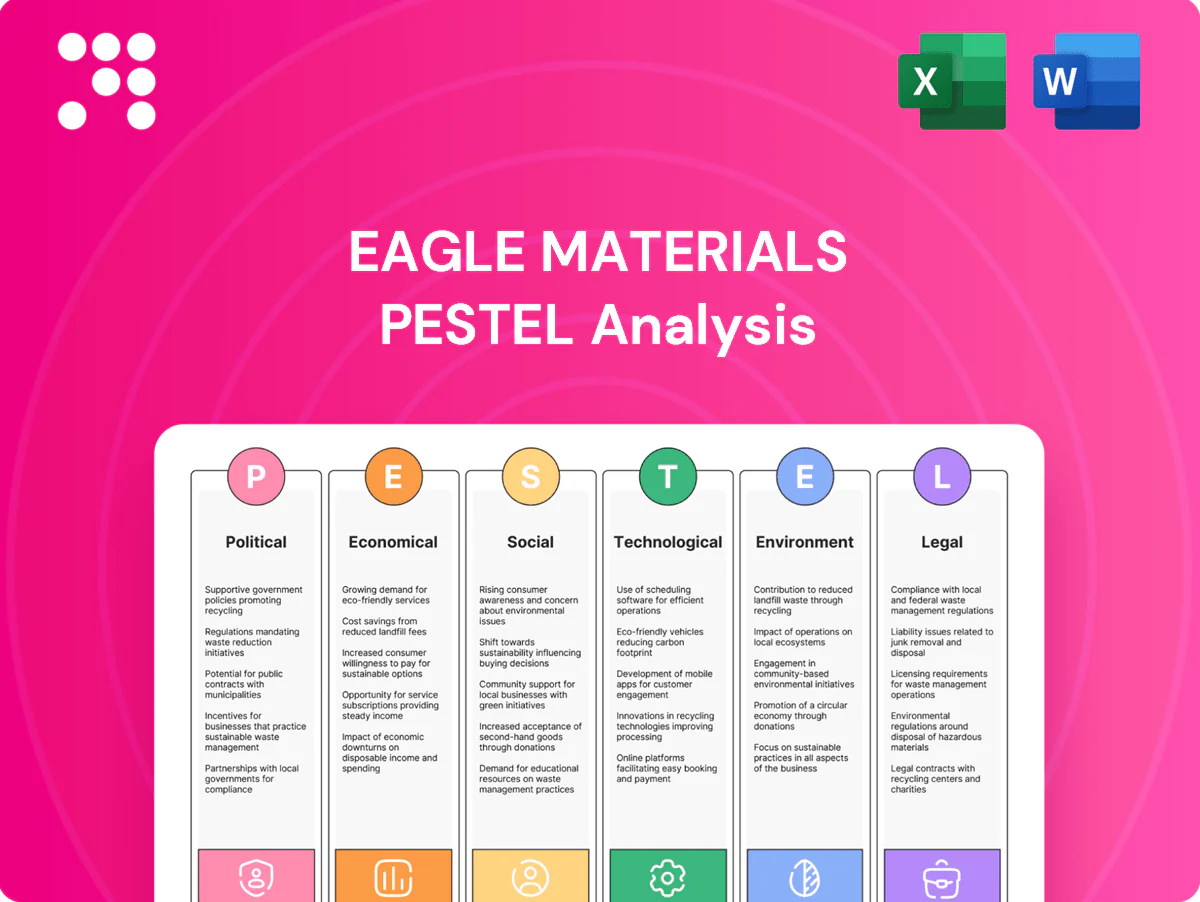
Eagle Materials PESTLE Analysis

Your Competitive Advantage Starts with This Report
Our PESTLE Analysis for Eagle Materials reveals how political shifts, economic cycles, and environmental regulations are reshaping its cement and gypsum markets. Practical insights highlight regulatory risks, supply-chain pressures, and green transition opportunities. Ideal for investors and strategists, the full report delivers editable, data-driven guidance. Purchase now to access the complete, ready-to-use analysis.
Political factors

Infrastructure and industrial policy
Eagle Materials is exposed to U.S. federal and state infrastructure priorities that drive cement demand, notably the Bipartisan Infrastructure Law’s roughly $550 billion in new spending and the CHIPS Act’s $52 billion of site‑work stimulus; shifts in appropriations or permitting timelines can accelerate or delay shipments, while stricter Buy America rules favor domestic suppliers but raise compliance costs.
Energy and emissions regulations
Cement kilns face evolving EPA and state rules on CO2, NOx, SOx and particulates; 2024–25 regulatory focus increases inspections and emissions reporting. Tighter standards likely force capex per plant in the tens-to-hundreds of millions for emissions controls or fuel switching. Policy support (IRA-era grants/tax incentives and green procurement) can create incentives and bidding preference for low-carbon cement. Divergent state rules create a patchwork of compliance costs and timelines across Eagle Materials plants.

Permitting and local land-use
Quarrying, kiln expansions and wallboard line additions for Eagle Materials hinge on local zoning and environmental permits, which often take 12–36 months to secure in the US and shaped Eagle's 2024 capital planning (~$350m capex guidance). Community opposition can extend timelines by 6–24 months or force capacity limits. Active engagement with local stakeholders and elected officials preserves social license. Permit certainty influences project IRRs and can widen cost of capital by several hundred basis points.

Transportation and logistics policy
Regulations on trucking weights (80,000 lb federal limit), driver hours (FMCSA 11-hour/14-hour/60-70-hour rules) and rail oversight affect Eagle Materials delivery costs and reliability; delays raise COGS and working-capital needs. Infrastructure policy such as the Bipartisan Infrastructure Law's $110 billion roads/bridges funding can reduce bottlenecks and transit times. Tightened diesel rules and 2024 U.S. average diesel at $3.88/gal raise freight expense.
- Route costs: regional road fees/congestion can reroute trucks and raise miles
- Reliability: rail service metrics and inspections influence plant inventories
- Fuel: diesel regulatory tightening plus $3.88/gal 2024 avg increases per-ton haul cost
Trade and import dynamics
Tariffs or quotas on imported cement, clinker and wallboard materially change competitive intensity for Eagle Materials by raising landed costs for foreign suppliers and protecting domestic margins.
Political responses to supply shortages, such as temporary tariff relief or accelerated import permits, have historically eased near-term price spikes and increased import volumes.
Conversely, protective measures can bolster domestic utilization and pricing, while policy shifts in Mexico and Canada alter regional flow patterns and logistics costs.
- Tariffs increase landed cost and protect domestic margins
- Import relief reduces short-term price spikes
- Protective measures support utilization
- Mexico/Canada policy shifts change regional flows
US infra, emissions rules reshape cement demand, boost plant capex and freight costs
Eagle Materials faces demand swings from Bipartisan Infrastructure Law ~$550B and CHIPS $52B site‑work; EPA/state emissions rules likely force tens‑to‑hundreds $m per plant capex and influenced 2024 $350m capex guidance; 2024 US diesel $3.88/gal raises freight; tariffs/import relief and Canada/Mexico policy shift regional flows and margins.
| Factor | 2024‑25 Metric | Impact |
|---|---|---|
| Infra stimulus | $550B / $52B | ↑ cement demand |
| Regulation | $10–$300m/plant | ↑ capex |
| Fuel | $3.88/gal | ↑ freight cost |
| Tariffs | Variable | ↑ domestic margins |
What is included in the product
 Detailed Word Document
Analyzes how macro-environmental factors—Political, Economic, Social, Technological, Environmental, and Legal—specifically affect Eagle Materials, with data-backed trends and region/industry context. Designed for executives and investors, it offers forward-looking insights and ready-to-use formatting for strategic planning.

 Customizable Excel Spreadsheet
A concise, visually segmented PESTLE summary of Eagle Materials that highlights regulatory, economic, and environmental risks for quick insertion into presentations and team planning, with editable notes for regional or business-line context.
Economic factors

Housing cycle sensitivity
Wallboard demand tracks single-family starts (≈800,000 nationwide in 2024), remodel spending (roughly $450B in 2024) and multifamily completions; rising 30-year mortgage rates (~6.8% mid-2025) tighten affordability and slow new construction, while resilient repair/remodel activity and stronger Sun Belt permit growth (≈40% of 2024 permits) partly offset national weakness.
Infrastructure and nonresidential capex
Cement volumes for Eagle Materials closely follow public works and industrial onshoring trends, including warehouse construction, against a US market that uses roughly 110 million metric tons of cement annually. The $550 billion in new infrastructure funding from the 2021 Infrastructure Investment and Jobs Act drives headline demand but disbursement timing creates pronounced quarterly variability. Long-cycle highway and port projects provide a steady baseload of sales. Private nonresidential capex remains sensitive to GDP growth and PMI readings, with PMI above 50 indicating sector expansion.

Energy and fuel cost volatility
Petcoke, coal, natural gas and electricity moves materially drive Eagle Materials unit costs: Henry Hub averaged about $3/MMBtu in 2024 (EIA), US thermal coal near $60/short ton and petcoke traded roughly $70–90/ton (Platts), while US diesel averaged ~3.7/gal (EIA). Hedging and switching to alternative fuels can smooth volatility but require capex and operating changes. Regional fuel differentials alter plant competitiveness and pricing, and rising freight/diesel costs cascade through delivered cement and gypsum pricing.

Pricing power and capacity utilization
Industry capacity tightness in 2024 supported cement and wallboard price gains, with trade reports indicating US cement utilization near 80–85% and gypsum wallboard markets running higher seasonal utilization; new kiln or plant additions and imports have capped upside in pockets. Contract terms and surcharge mechanisms (fuel, freight) determine how much of list-price increases flow to margins. Utilization swings materially affect fixed-cost absorption and EBITDA sensitivity for Eagle Materials.
- utilization: ~80–85% (2024 market reports)
- pricing risk: new capacity/imports can cap momentum
- contract levers: surcharges drive margin capture
Recycled paperboard and fiber markets
Recovered fiber availability and prices directly drive paperboard input costs, with recovered fiber typically supplying about 60-70% of containerboard furnish, making OCC price moves material to margins.
Global containerboard cycles transmit into OCC volatility; tight operating rates in peak years pushed prices higher while softening demand in 2023-24 eased spot levels.
Vertical integration into packaging and corrugated assets can buffer supply shocks and protect margins, especially as e-commerce and packaging demand keep market tightness on the upside.
- recovered fiber share ~60-70%
- containerboard cycle ↔ OCC price volatility
- vertical integration = margin protection
- e-commerce, packaging demand tighten market
US infra, emissions rules reshape cement demand, boost plant capex and freight costs
Wallboard demand tied to ~800k single-family starts (2024), ~$450B remodel spend (2024) and ~6.8% 30y mortgage (mid-2025) — new construction weak, repairs resilient.
Cement follows ~110M t/yr US market and $550B IIJA funding, but timing creates quarterly variability; utilization ~80–85% (2024).
Fuel/fiber costs: Henry Hub ~$3/MMBtu (2024), diesel ~$3.7/gal (2024); recovered fiber ~60–70% of furnish.
| Metric | Value |
|---|---|
| SF starts (2024) | ~800,000 |
| Remodel spend (2024) | ~$450B |
| US cement | ~110M t/yr |
What You See Is What You Get
Eagle Materials PESTLE Analysis
The Eagle Materials PESTLE Analysis reviews political, economic, social, technological, legal, and environmental factors shaping the cement, gypsum, and construction‑materials markets and highlights risks and opportunities for the company. The preview shown here is the exact document you’ll receive after purchase—fully formatted and ready to use. It includes concise findings and actionable strategic implications for investors and managers.

Original: $10.00
-65%$10.00
$3.50Product Information
Product Information
Shipping & Returns
Shipping & Returns
Description
Your Competitive Advantage Starts with This Report
Our PESTLE Analysis for Eagle Materials reveals how political shifts, economic cycles, and environmental regulations are reshaping its cement and gypsum markets. Practical insights highlight regulatory risks, supply-chain pressures, and green transition opportunities. Ideal for investors and strategists, the full report delivers editable, data-driven guidance. Purchase now to access the complete, ready-to-use analysis.
Political factors
Infrastructure and industrial policy
Eagle Materials is exposed to U.S. federal and state infrastructure priorities that drive cement demand, notably the Bipartisan Infrastructure Law’s roughly $550 billion in new spending and the CHIPS Act’s $52 billion of site‑work stimulus; shifts in appropriations or permitting timelines can accelerate or delay shipments, while stricter Buy America rules favor domestic suppliers but raise compliance costs.
Energy and emissions regulations
Cement kilns face evolving EPA and state rules on CO2, NOx, SOx and particulates; 2024–25 regulatory focus increases inspections and emissions reporting. Tighter standards likely force capex per plant in the tens-to-hundreds of millions for emissions controls or fuel switching. Policy support (IRA-era grants/tax incentives and green procurement) can create incentives and bidding preference for low-carbon cement. Divergent state rules create a patchwork of compliance costs and timelines across Eagle Materials plants.
Permitting and local land-use
Quarrying, kiln expansions and wallboard line additions for Eagle Materials hinge on local zoning and environmental permits, which often take 12–36 months to secure in the US and shaped Eagle's 2024 capital planning (~$350m capex guidance). Community opposition can extend timelines by 6–24 months or force capacity limits. Active engagement with local stakeholders and elected officials preserves social license. Permit certainty influences project IRRs and can widen cost of capital by several hundred basis points.
Transportation and logistics policy
Regulations on trucking weights (80,000 lb federal limit), driver hours (FMCSA 11-hour/14-hour/60-70-hour rules) and rail oversight affect Eagle Materials delivery costs and reliability; delays raise COGS and working-capital needs. Infrastructure policy such as the Bipartisan Infrastructure Law's $110 billion roads/bridges funding can reduce bottlenecks and transit times. Tightened diesel rules and 2024 U.S. average diesel at $3.88/gal raise freight expense.
- Route costs: regional road fees/congestion can reroute trucks and raise miles
- Reliability: rail service metrics and inspections influence plant inventories
- Fuel: diesel regulatory tightening plus $3.88/gal 2024 avg increases per-ton haul cost
Trade and import dynamics
Tariffs or quotas on imported cement, clinker and wallboard materially change competitive intensity for Eagle Materials by raising landed costs for foreign suppliers and protecting domestic margins.
Political responses to supply shortages, such as temporary tariff relief or accelerated import permits, have historically eased near-term price spikes and increased import volumes.
Conversely, protective measures can bolster domestic utilization and pricing, while policy shifts in Mexico and Canada alter regional flow patterns and logistics costs.
- Tariffs increase landed cost and protect domestic margins
- Import relief reduces short-term price spikes
- Protective measures support utilization
- Mexico/Canada policy shifts change regional flows
US infra, emissions rules reshape cement demand, boost plant capex and freight costs
Eagle Materials faces demand swings from Bipartisan Infrastructure Law ~$550B and CHIPS $52B site‑work; EPA/state emissions rules likely force tens‑to‑hundreds $m per plant capex and influenced 2024 $350m capex guidance; 2024 US diesel $3.88/gal raises freight; tariffs/import relief and Canada/Mexico policy shift regional flows and margins.
| Factor | 2024‑25 Metric | Impact |
|---|---|---|
| Infra stimulus | $550B / $52B | ↑ cement demand |
| Regulation | $10–$300m/plant | ↑ capex |
| Fuel | $3.88/gal | ↑ freight cost |
| Tariffs | Variable | ↑ domestic margins |
What is included in the product
Detailed Word Document
Analyzes how macro-environmental factors—Political, Economic, Social, Technological, Environmental, and Legal—specifically affect Eagle Materials, with data-backed trends and region/industry context. Designed for executives and investors, it offers forward-looking insights and ready-to-use formatting for strategic planning.
Customizable Excel Spreadsheet
A concise, visually segmented PESTLE summary of Eagle Materials that highlights regulatory, economic, and environmental risks for quick insertion into presentations and team planning, with editable notes for regional or business-line context.
Economic factors
Housing cycle sensitivity
Wallboard demand tracks single-family starts (≈800,000 nationwide in 2024), remodel spending (roughly $450B in 2024) and multifamily completions; rising 30-year mortgage rates (~6.8% mid-2025) tighten affordability and slow new construction, while resilient repair/remodel activity and stronger Sun Belt permit growth (≈40% of 2024 permits) partly offset national weakness.
Infrastructure and nonresidential capex
Cement volumes for Eagle Materials closely follow public works and industrial onshoring trends, including warehouse construction, against a US market that uses roughly 110 million metric tons of cement annually. The $550 billion in new infrastructure funding from the 2021 Infrastructure Investment and Jobs Act drives headline demand but disbursement timing creates pronounced quarterly variability. Long-cycle highway and port projects provide a steady baseload of sales. Private nonresidential capex remains sensitive to GDP growth and PMI readings, with PMI above 50 indicating sector expansion.
Energy and fuel cost volatility
Petcoke, coal, natural gas and electricity moves materially drive Eagle Materials unit costs: Henry Hub averaged about $3/MMBtu in 2024 (EIA), US thermal coal near $60/short ton and petcoke traded roughly $70–90/ton (Platts), while US diesel averaged ~3.7/gal (EIA). Hedging and switching to alternative fuels can smooth volatility but require capex and operating changes. Regional fuel differentials alter plant competitiveness and pricing, and rising freight/diesel costs cascade through delivered cement and gypsum pricing.
Pricing power and capacity utilization
Industry capacity tightness in 2024 supported cement and wallboard price gains, with trade reports indicating US cement utilization near 80–85% and gypsum wallboard markets running higher seasonal utilization; new kiln or plant additions and imports have capped upside in pockets. Contract terms and surcharge mechanisms (fuel, freight) determine how much of list-price increases flow to margins. Utilization swings materially affect fixed-cost absorption and EBITDA sensitivity for Eagle Materials.
- utilization: ~80–85% (2024 market reports)
- pricing risk: new capacity/imports can cap momentum
- contract levers: surcharges drive margin capture
Recycled paperboard and fiber markets
Recovered fiber availability and prices directly drive paperboard input costs, with recovered fiber typically supplying about 60-70% of containerboard furnish, making OCC price moves material to margins.
Global containerboard cycles transmit into OCC volatility; tight operating rates in peak years pushed prices higher while softening demand in 2023-24 eased spot levels.
Vertical integration into packaging and corrugated assets can buffer supply shocks and protect margins, especially as e-commerce and packaging demand keep market tightness on the upside.
- recovered fiber share ~60-70%
- containerboard cycle ↔ OCC price volatility
- vertical integration = margin protection
- e-commerce, packaging demand tighten market
US infra, emissions rules reshape cement demand, boost plant capex and freight costs
Wallboard demand tied to ~800k single-family starts (2024), ~$450B remodel spend (2024) and ~6.8% 30y mortgage (mid-2025) — new construction weak, repairs resilient.
Cement follows ~110M t/yr US market and $550B IIJA funding, but timing creates quarterly variability; utilization ~80–85% (2024).
Fuel/fiber costs: Henry Hub ~$3/MMBtu (2024), diesel ~$3.7/gal (2024); recovered fiber ~60–70% of furnish.
| Metric | Value |
|---|---|
| SF starts (2024) | ~800,000 |
| Remodel spend (2024) | ~$450B |
| US cement | ~110M t/yr |
What You See Is What You Get
Eagle Materials PESTLE Analysis
The Eagle Materials PESTLE Analysis reviews political, economic, social, technological, legal, and environmental factors shaping the cement, gypsum, and construction‑materials markets and highlights risks and opportunities for the company. The preview shown here is the exact document you’ll receive after purchase—fully formatted and ready to use. It includes concise findings and actionable strategic implications for investors and managers.











