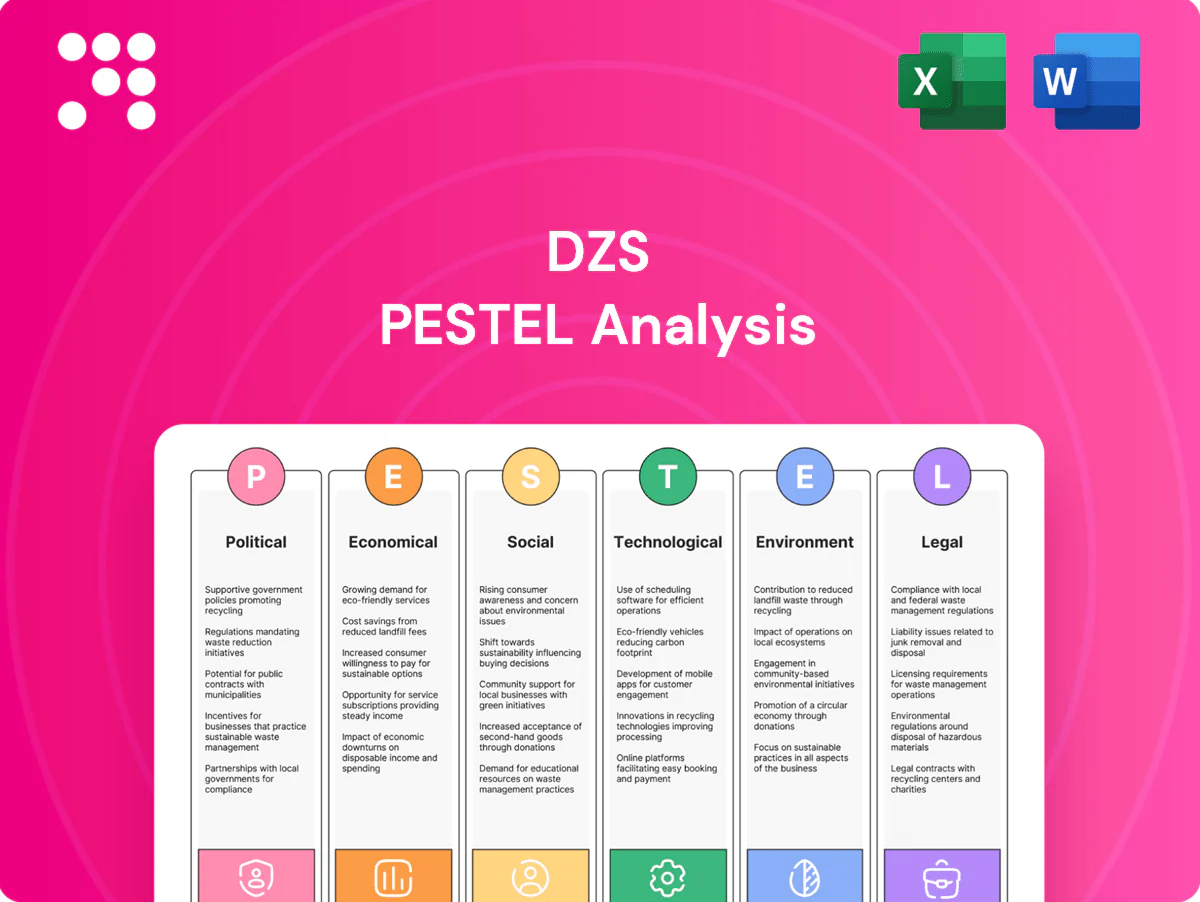
DZS PESTLE Analysis

Your Shortcut to Market Insight Starts Here
Unlock how political, economic, social, technological, legal, and environmental forces are shaping DZS’s strategic outlook with our concise PESTLE briefing—designed for investors, consultants, and managers. This snapshot highlights key risks and opportunities to inform smarter decisions. Purchase the full PESTLE for the complete, actionable analysis and ready-to-use slides and data.
Political factors

Telecom policy shifts
Changes in broadband, spectrum and open-access mandates directly affect DZS demand: US IIJA set ~65 billion USD for broadband and BEAD allocated 42.45 billion USD to states, while the EU targets gigabit connectivity by 2030, accelerating fiber builds and operator capex. Pro-fiber subsidies and neutrality rules can quicken operator deployments, but restrictive procurement or local-preference rules can delay deals, so DZS must align product roadmaps and certifications to policy timelines.
Government funding programs
US IIJA allocated about 65B for broadband with BEAD providing 42.45B for rural fiber; similar EU and APAC grants add billions, boosting access and 5G backhaul projects. Disbursement timing (often 12–36 months) shapes order visibility and 60–180 day cash cycles. Competitive grants favor proven, standards-based vendors; DZS can win as a cost-effective enabler for funded builds.

Geopolitical trade tensions
Tariffs (commonly ranging from 10 to 25%) and expanding export controls on advanced semiconductors (tightened 2022–24) raise component costs and constrain market access for network-equipment suppliers. Targeted sanctions since 2022 have reshuffled supplier landscapes by excluding vendors and prompting rapid qualification of alternatives. Currency volatility tied to geopolitical risk compresses margins, so diversified sourcing and regional assembly reduce exposure.

Critical infrastructure designation
Networks are now treated as strategic assets, raising resilience and security requirements; EU NIS2 (in force 2023) expands obligations for telco operators and the US authorized a $1.9B rip‑out reimbursement program for untrusted equipment, increasing supply‑chain vetting and software assurance demands. This lengthens sales cycles but creates higher barriers to entry. DZS can differentiate via secure‑by‑design engineering and thorough compliance documentation.
- Impact: longer sales cycles, higher procurement thresholds
- Fact: NIS2 expands critical entity scope (2023)
- US: $1.9B rip‑out fund increases vendor scrutiny
- Opportunity: DZS differentiation through security + compliance
Public-private partnerships
PPPs enable large-scale fiber and transport rollouts under long-term contracts typically 10–25 years and often valued in the multi-million to multi-billion dollar range. Governance frameworks require transparent procurement and defined SLAs, with availability targets commonly ≥99.9%. Vendors must support lifecycle KPIs and 5–15 year maintenance/upgrade windows, and DZS can leverage PPP references to win multi-year awards.
- Contract length: 10–25 years
- Value: multi-million to multi-billion USD
- SLA target: ≥99.9% availability
- Lifecycle support: 5–15 year maintenance
Broadband funding and regs reshape fiber capex: timing, compliance, supply risk
Broadband funding (US IIJA ~65B, BEAD 42.45B) and EU gigabit targets accelerate fiber capex; disbursement timing (12–36 months) affects order visibility. Regulatory security (NIS2 in force 2023; US $1.9B rip‑out fund) raises compliance and lengthens sales cycles. Tariffs (10–25%) and 2022–24 export controls increase component costs, favoring diversified sourcing.
| Policy | 2023–25 fact | Impact | Opportunity |
|---|---|---|---|
| IIJA/BEAD | 65B/42.45B | Boosts orders; timing risk | Win funded builds |
| NIS2 / Rip‑out | 2023 / $1.9B | Higher vetting | Secure‑by‑design |
| Tariffs/Controls | 10–25% / 2022–24 | Cost, market limits | Diversify supply |
What is included in the product
 Detailed Word Document
Explores how macro-environmental forces uniquely affect DZS across Political, Economic, Social, Technological, Environmental, and Legal dimensions, with each category expanded into data-backed sub-points and forward-looking insights for scenario planning. Designed for executives, investors, and consultants, the analysis reflects actual market and regulatory dynamics and is delivered in clean, presentation-ready format.

 Customizable Excel Spreadsheet
A concise, visually segmented DZS PESTLE summary that relieves planning pain by enabling quick interpretation, easy note additions for region or business line, and shareable snippets ready for presentations or team alignment.
Economic factors

Operator capex cycles
Telecom and enterprise capex remains sensitive to macro and interest rates, which hovered around 5% in 2024–25, tempering investment cycles. Broadband fiber-to-the-premise and 5G transport budgets are primary drivers of DZS product demand. Delays in capex approvals often shift revenue into later quarters. DZS benefits from diversified customers and regions, smoothing revenue volatility.
Cost inflation and FX
Component, logistics, and labor inflation continue to pressure gross margins as suppliers cite sustained cost increases; DZS, a US-listed company (NASDAQ: DZSI) reporting in USD, faces these input-cost headwinds. Exchange rate swings alter dollar-reported revenue and regional pricing power, so escalation clauses and value engineering are used to protect margins. Hedging and local-currency pricing reduce FX exposure and stabilize reported results.

Supply-demand balance
Semiconductor availability remains key: lead times, which peaked near 26 weeks during the pandemic, eased to roughly 12–14 weeks by mid‑2024, speeding backlog conversion. As demand normalizes, inventory management is critical to avoid excess stock or stockouts. Customers now prefer vendors with firm delivery commitments. DZS can capture share through agile supply planning and validated component alternates.

Consolidation dynamics
Mergers among operators and vendors are reshaping purchasing and technical standards, concentrating buying power that pressures margins but creates large-scale deployment opportunities for vendors like DZS; post-merger network harmonization often triggers multi-year upgrade cycles focused on interoperable, brownfield modernization where DZS can win share.
- Consolidation increases buyer scale
- Pricing pressure vs. large contracts
- Harmonization drives upgrades
- DZS targets brownfield, interoperable gear
Total cost of ownership
Buyers prioritize lifetime economics over upfront price; energy efficiency, higher density and automation can reduce opex 20–40% per industry studies (2024). Open standards cut vendor lock-in and integration costs by ~20–30%, speeding deployments and lowering refresh costs. DZS delivers quantified TCO models to validate ROI with CAPEX and OPEX savings projections.
- Opex reduction: 20–40% (automation, 2024)
- Integration savings: ~20–30% (open standards)
- DZS: quantified TCO/ROI models
Broadband funding and regs reshape fiber capex: timing, compliance, supply risk
Telecom capex tied to ~5% interest rates in 2024–25, slowing investments; fiber and 5G transport drive DZS demand. Input inflation and FX pressure margins; hedging and local pricing mitigate impact. Semiconductor lead times fell to ~12–14 weeks by mid‑2024, aiding backlog conversion. Consolidation concentrates buyers, raising pricing pressure but enabling large-scale contracts.
| Metric | Value |
|---|---|
| Policy rate (2024–25) | ~5% |
| Semiconductor lead times (mid‑2024) | 12–14 weeks |
| Opex reduction (studies 2024) | 20–40% |
| Integration savings (open standards) | 20–30% |
| DZS ticker | DZSI (NASDAQ) |
Full Version Awaits
DZS PESTLE Analysis
The preview shown here is the exact DZS PESTLE Analysis document you’ll receive after purchase—fully formatted and ready to use. This screenshot reflects the complete, final file with no placeholders or edits needed. After checkout you’ll instantly be able to download and apply the same structured, professional analysis.

Original: $10.00
-65%$10.00
$3.50Product Information
Product Information
Shipping & Returns
Shipping & Returns
Description
Your Shortcut to Market Insight Starts Here
Unlock how political, economic, social, technological, legal, and environmental forces are shaping DZS’s strategic outlook with our concise PESTLE briefing—designed for investors, consultants, and managers. This snapshot highlights key risks and opportunities to inform smarter decisions. Purchase the full PESTLE for the complete, actionable analysis and ready-to-use slides and data.
Political factors
Telecom policy shifts
Changes in broadband, spectrum and open-access mandates directly affect DZS demand: US IIJA set ~65 billion USD for broadband and BEAD allocated 42.45 billion USD to states, while the EU targets gigabit connectivity by 2030, accelerating fiber builds and operator capex. Pro-fiber subsidies and neutrality rules can quicken operator deployments, but restrictive procurement or local-preference rules can delay deals, so DZS must align product roadmaps and certifications to policy timelines.
Government funding programs
US IIJA allocated about 65B for broadband with BEAD providing 42.45B for rural fiber; similar EU and APAC grants add billions, boosting access and 5G backhaul projects. Disbursement timing (often 12–36 months) shapes order visibility and 60–180 day cash cycles. Competitive grants favor proven, standards-based vendors; DZS can win as a cost-effective enabler for funded builds.
Geopolitical trade tensions
Tariffs (commonly ranging from 10 to 25%) and expanding export controls on advanced semiconductors (tightened 2022–24) raise component costs and constrain market access for network-equipment suppliers. Targeted sanctions since 2022 have reshuffled supplier landscapes by excluding vendors and prompting rapid qualification of alternatives. Currency volatility tied to geopolitical risk compresses margins, so diversified sourcing and regional assembly reduce exposure.
Critical infrastructure designation
Networks are now treated as strategic assets, raising resilience and security requirements; EU NIS2 (in force 2023) expands obligations for telco operators and the US authorized a $1.9B rip‑out reimbursement program for untrusted equipment, increasing supply‑chain vetting and software assurance demands. This lengthens sales cycles but creates higher barriers to entry. DZS can differentiate via secure‑by‑design engineering and thorough compliance documentation.
- Impact: longer sales cycles, higher procurement thresholds
- Fact: NIS2 expands critical entity scope (2023)
- US: $1.9B rip‑out fund increases vendor scrutiny
- Opportunity: DZS differentiation through security + compliance
Public-private partnerships
PPPs enable large-scale fiber and transport rollouts under long-term contracts typically 10–25 years and often valued in the multi-million to multi-billion dollar range. Governance frameworks require transparent procurement and defined SLAs, with availability targets commonly ≥99.9%. Vendors must support lifecycle KPIs and 5–15 year maintenance/upgrade windows, and DZS can leverage PPP references to win multi-year awards.
- Contract length: 10–25 years
- Value: multi-million to multi-billion USD
- SLA target: ≥99.9% availability
- Lifecycle support: 5–15 year maintenance
Broadband funding and regs reshape fiber capex: timing, compliance, supply risk
Broadband funding (US IIJA ~65B, BEAD 42.45B) and EU gigabit targets accelerate fiber capex; disbursement timing (12–36 months) affects order visibility. Regulatory security (NIS2 in force 2023; US $1.9B rip‑out fund) raises compliance and lengthens sales cycles. Tariffs (10–25%) and 2022–24 export controls increase component costs, favoring diversified sourcing.
| Policy | 2023–25 fact | Impact | Opportunity |
|---|---|---|---|
| IIJA/BEAD | 65B/42.45B | Boosts orders; timing risk | Win funded builds |
| NIS2 / Rip‑out | 2023 / $1.9B | Higher vetting | Secure‑by‑design |
| Tariffs/Controls | 10–25% / 2022–24 | Cost, market limits | Diversify supply |
What is included in the product
Detailed Word Document
Explores how macro-environmental forces uniquely affect DZS across Political, Economic, Social, Technological, Environmental, and Legal dimensions, with each category expanded into data-backed sub-points and forward-looking insights for scenario planning. Designed for executives, investors, and consultants, the analysis reflects actual market and regulatory dynamics and is delivered in clean, presentation-ready format.
Customizable Excel Spreadsheet
A concise, visually segmented DZS PESTLE summary that relieves planning pain by enabling quick interpretation, easy note additions for region or business line, and shareable snippets ready for presentations or team alignment.
Economic factors
Operator capex cycles
Telecom and enterprise capex remains sensitive to macro and interest rates, which hovered around 5% in 2024–25, tempering investment cycles. Broadband fiber-to-the-premise and 5G transport budgets are primary drivers of DZS product demand. Delays in capex approvals often shift revenue into later quarters. DZS benefits from diversified customers and regions, smoothing revenue volatility.
Cost inflation and FX
Component, logistics, and labor inflation continue to pressure gross margins as suppliers cite sustained cost increases; DZS, a US-listed company (NASDAQ: DZSI) reporting in USD, faces these input-cost headwinds. Exchange rate swings alter dollar-reported revenue and regional pricing power, so escalation clauses and value engineering are used to protect margins. Hedging and local-currency pricing reduce FX exposure and stabilize reported results.
Supply-demand balance
Semiconductor availability remains key: lead times, which peaked near 26 weeks during the pandemic, eased to roughly 12–14 weeks by mid‑2024, speeding backlog conversion. As demand normalizes, inventory management is critical to avoid excess stock or stockouts. Customers now prefer vendors with firm delivery commitments. DZS can capture share through agile supply planning and validated component alternates.
Consolidation dynamics
Mergers among operators and vendors are reshaping purchasing and technical standards, concentrating buying power that pressures margins but creates large-scale deployment opportunities for vendors like DZS; post-merger network harmonization often triggers multi-year upgrade cycles focused on interoperable, brownfield modernization where DZS can win share.
- Consolidation increases buyer scale
- Pricing pressure vs. large contracts
- Harmonization drives upgrades
- DZS targets brownfield, interoperable gear
Total cost of ownership
Buyers prioritize lifetime economics over upfront price; energy efficiency, higher density and automation can reduce opex 20–40% per industry studies (2024). Open standards cut vendor lock-in and integration costs by ~20–30%, speeding deployments and lowering refresh costs. DZS delivers quantified TCO models to validate ROI with CAPEX and OPEX savings projections.
- Opex reduction: 20–40% (automation, 2024)
- Integration savings: ~20–30% (open standards)
- DZS: quantified TCO/ROI models
Broadband funding and regs reshape fiber capex: timing, compliance, supply risk
Telecom capex tied to ~5% interest rates in 2024–25, slowing investments; fiber and 5G transport drive DZS demand. Input inflation and FX pressure margins; hedging and local pricing mitigate impact. Semiconductor lead times fell to ~12–14 weeks by mid‑2024, aiding backlog conversion. Consolidation concentrates buyers, raising pricing pressure but enabling large-scale contracts.
| Metric | Value |
|---|---|
| Policy rate (2024–25) | ~5% |
| Semiconductor lead times (mid‑2024) | 12–14 weeks |
| Opex reduction (studies 2024) | 20–40% |
| Integration savings (open standards) | 20–30% |
| DZS ticker | DZSI (NASDAQ) |
Full Version Awaits
DZS PESTLE Analysis
The preview shown here is the exact DZS PESTLE Analysis document you’ll receive after purchase—fully formatted and ready to use. This screenshot reflects the complete, final file with no placeholders or edits needed. After checkout you’ll instantly be able to download and apply the same structured, professional analysis.











