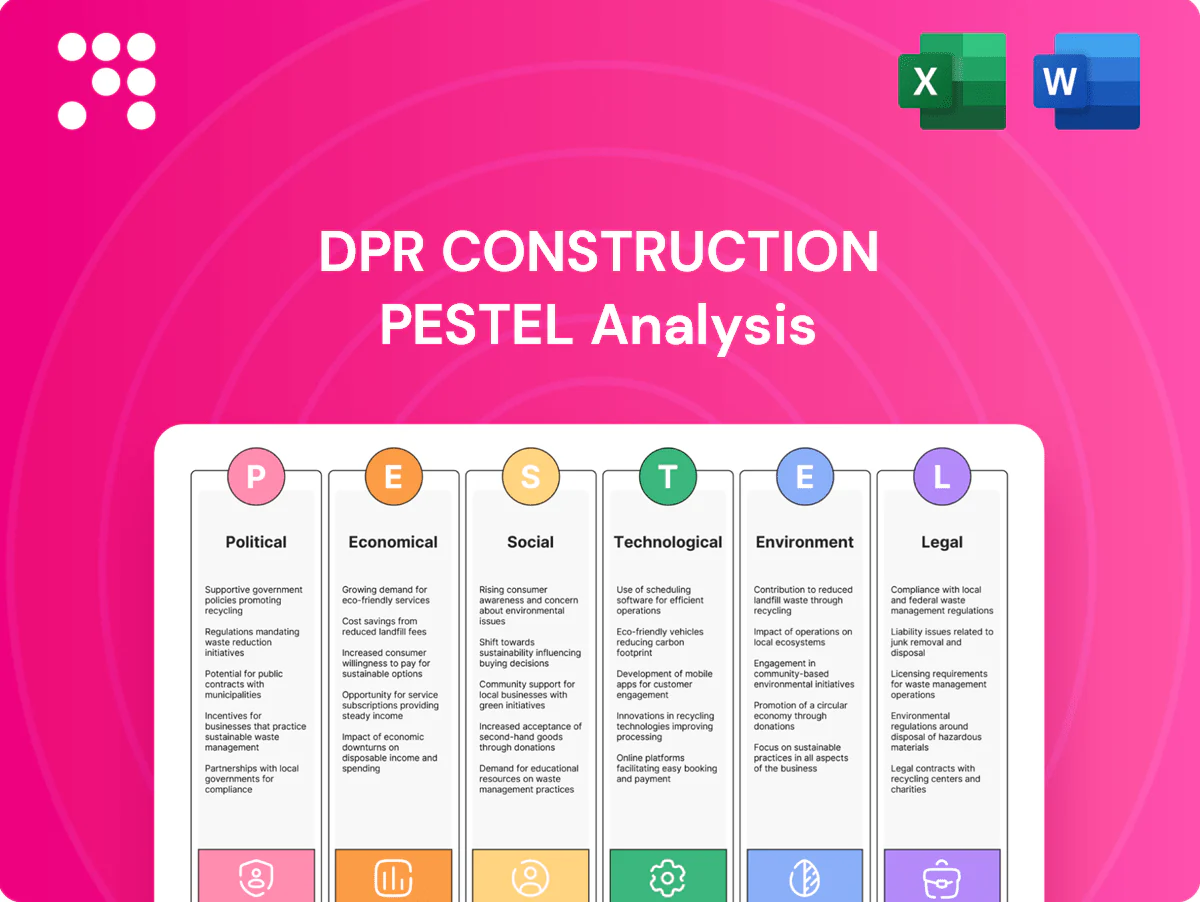
DPR Construction PESTLE Analysis

Plan Smarter. Present Sharper. Compete Stronger.
Our PESTLE Analysis of DPR Construction reveals how political shifts, economic cycles, regulatory changes, and sustainability trends are reshaping its strategy and risk profile. Ideal for investors and strategists, this concise briefing highlights opportunities and threats. Purchase the full report to access detailed, actionable intelligence and editable charts for immediate use.
Political factors

Infrastructure and public funding
Shifts in federal and state infrastructure and healthcare funding—driven by the $1.2 trillion Bipartisan Infrastructure Law (including $550 billion in new federal investment), the $52 billion CHIPS Act, and the Inflation Reduction Act’s roughly $369 billion energy package—directly expand pipelines for hospitals, labs, and higher education. Earmarks and CHIPS-/IRA-related incentives can accelerate advanced-tech facilities. Budget cycles and election outcomes create timing risk and backlog volatility. DPR must align pursuits with appropriations calendars and regional grant flows.
Permitting and zoning regimes
Local zoning and CEQA/NEPA reviews drive start-date uncertainty—NEPA EIS averages about 4.5 years per GAO (2014), while city entitlement timelines for commercial projects commonly span months to over a year, raising holding costs. Streamlining initiatives for life sciences and data centers can compress approvals to roughly 3–9 months. Community-benef benefit mandates often increase scope and can add an industry-observed 5–15% to development costs. Proactive jurisdictional engagement measurably reduces approval friction and delay risk.

Workforce and immigration policy
Skilled-trade availability for DPR is shaped by visa rules, apprenticeship incentives and prevailing wage laws; federal IIJA's $1 trillion program and CHIPS Act's $52 billion boost demand for MEP trades. Tight labor policy can constrain complex MEP work for tech and healthcare projects. Public training grants tied to IIJA and DOL funding expand capacity on megaprojects, supporting DPR's craft pipeline growth.

Trade and procurement geopolitics
- Tariffs/export controls: limit tools, materials
- Buy America (IIJA $1.2T): longer lead times
- Sanctions: disrupt advanced-tech suppliers
- Mitigation: early procurement, alternate sourcing
Government client procurement models
Government client procurement models—ID/IQs, CM-at-Risk, and progressive design-build—vary widely by agency, with public construction spending near $400B in 2023 (US Census Bureau) shaping demand and contract type selection.
IPD acceptance in public institutions remains limited but growing, improving collaboration and risk-sharing where adopted; GAO recorded 2,163 bid protests in FY2023, raising pursuit costs and transparency scrutiny.
DPR’s proven design-build and IPD capabilities align with modernization trends, positioning the firm to capture complex, integrated public projects as agencies shift toward alternative delivery.
- ID/IQs, CM-at-Risk, progressive design-build vary by agency
- IPD growth boosts collaboration and shared risk
- 2,163 GAO protests in FY2023 increase pursuit costs
- ~$400B public construction market (2023) favors integrated delivery; DPR aligned
IIJA/IRA/CHIPS fuel hospital, lab & data center pipelines; election timing raises risk
Federal packages (IIJA $1.2T, CHIPS $52B, IRA energy ~$369B) expand hospital, lab and data center pipelines while election cycles create timing risk. Buy America, export controls and sanctions lengthen lead times and raise costs. Public construction ~ $400B (2023); 2,163 GAO protests (FY2023) increase pursuit risk.
| Factor | Key metric |
|---|---|
| IIJA/IRA/CHIPS | $1.2T / ~$369B / $52B |
| Public spend | $400B (2023) |
| GAO protests | 2,163 (FY2023) |
What is included in the product
 Detailed Word Document
Explores how external macro-environmental factors uniquely affect DPR Construction across Political, Economic, Social, Technological, Environmental, and Legal dimensions, with each section backed by current data and trend analysis; designed for executives, investors, and strategists to identify risks, opportunities and forward‑looking scenarios ready for inclusion in plans and reports.

 Customizable Excel Spreadsheet
Visually segmented by PESTLE categories for rapid interpretation, this DPR Construction PESTLE summary is concise and presentation-ready, easily dropped into slides or shared across teams and editable to add region- or project-specific notes.
Economic factors

Interest rates and capital cost
Higher borrowing costs—with the federal funds rate near 5.25–5.50% in 2024—raise owner hurdle rates and commonly delay project starts. Healthcare systems and universities have publicly scaled back or postponed nonessential capital programs amid tighter financing. Conversely, mission-critical tech and biopharma projects frequently proceed due to strategic imperatives. DPR’s precon value engineering helps preserve feasibility by cutting scope and cost early.
Materials inflation and volatility
Steel, electrical gear, and HVAC components remain price-volatile with long lead times; steel saw roughly a 40% decline from 2022 peaks into 2023 while electrical equipment lead times often run 20–26 weeks and HVAC 12–24 weeks. Supply normalization has lowered short-term risk but shocks can recur. Escalation clauses and early-buy strategies protect margins and schedules. Strong supplier partnerships improve availability on complex builds.

Labor market tightness
Tight craft markets drove craft wage inflation near 5%–6% YoY in 2024 and subcontractor capacity limits, with an AGC 2024 survey showing roughly 70% of firms reporting worker shortages, compressing bid margins. DPR offsets pressure via prefabrication and VDC, yielding 10%–20% productivity gains, while regional labor dynamics shape market choice and DPR’s self-perform and trade-partner network act as economic levers.

Sector-specific capex cycles
Semiconductor, data center and biopharma capex follow distinct cycles—semiconductor capex reached about $75B in 2024, data center investment topped ~$150B, and biopharma facility spending hovered near $40B—often countercyclical to soft commercial office demand; hospital project timing tracks slim US median operating margins (~1.5% in 2023–24) while higher education campus plans hinge on endowment performance (NACUBO-style funds returned strongly in 2024, ~+11%).
- Sector diversification stabilizes revenue
- Semiconductor capex ~ $75B (2024)
- Data center spend ~ $150B (2024)
- Biopharma facility spend ~ $40B (2024)
- Hospital margins ~1.5% affect project timing
- Higher-ed endowments (~+11% 2024) drive campus capex
Backlog quality and cash flow
Complex, long-duration projects give DPR roughly $6.1 billion backlog (2024), improving revenue visibility but raising working capital and WIP financing needs.
Strict milestone billing and disciplined change-order management maintain liquidity and keep receivable cycles tight.
Preconstruction services expand a conversion pipeline and bolster pricing power while front-end risk screening preserves a profitable backlog.
- Backlog: $6.1B (2024)
- Milestone billing: tightens receivables
- Preconstruction: improves pricing power
- Risk screening: protects margin
IIJA/IRA/CHIPS fuel hospital, lab & data center pipelines; election timing raises risk
Higher borrowing costs (fed funds ~5.25–5.50% 2024) elevate owner hurdle rates and delay nonessential starts while mission-critical tech/biopharma work continues. Supply prices and lead times remain volatile but normalized versus 2022 peaks; escalation clauses and early buys protect margins. Tight craft markets (wage inflation ~5%–6% YoY) and a $6.1B backlog boost visibility but increase WIP financing needs.
| Metric | Value |
|---|---|
| Fed funds (2024) | 5.25–5.50% |
| Backlog (2024) | $6.1B |
| Semiconductor capex (2024) | $75B |
| Data center spend (2024) | $150B |
| Biopharma spend (2024) | $40B |
| Craft wage inflation (2024) | 5%–6% YoY |
| Hospital margins (2023–24) | ~1.5% |
| Higher-ed endowment return (2024) | ~+11% |
Preview Before You Purchase
DPR Construction PESTLE Analysis
The preview shown here is the exact DPR Construction PESTLE Analysis document you’ll receive after purchase—fully formatted and ready to use. The layout, content, and structure visible are identical to the downloadable file you’ll get at checkout. No placeholders or teasers; this is the final, professionally structured report.

Original: $10.00
-65%$10.00
$3.50Product Information
Product Information
Shipping & Returns
Shipping & Returns
Description
Plan Smarter. Present Sharper. Compete Stronger.
Our PESTLE Analysis of DPR Construction reveals how political shifts, economic cycles, regulatory changes, and sustainability trends are reshaping its strategy and risk profile. Ideal for investors and strategists, this concise briefing highlights opportunities and threats. Purchase the full report to access detailed, actionable intelligence and editable charts for immediate use.
Political factors
Infrastructure and public funding
Shifts in federal and state infrastructure and healthcare funding—driven by the $1.2 trillion Bipartisan Infrastructure Law (including $550 billion in new federal investment), the $52 billion CHIPS Act, and the Inflation Reduction Act’s roughly $369 billion energy package—directly expand pipelines for hospitals, labs, and higher education. Earmarks and CHIPS-/IRA-related incentives can accelerate advanced-tech facilities. Budget cycles and election outcomes create timing risk and backlog volatility. DPR must align pursuits with appropriations calendars and regional grant flows.
Permitting and zoning regimes
Local zoning and CEQA/NEPA reviews drive start-date uncertainty—NEPA EIS averages about 4.5 years per GAO (2014), while city entitlement timelines for commercial projects commonly span months to over a year, raising holding costs. Streamlining initiatives for life sciences and data centers can compress approvals to roughly 3–9 months. Community-benef benefit mandates often increase scope and can add an industry-observed 5–15% to development costs. Proactive jurisdictional engagement measurably reduces approval friction and delay risk.
Workforce and immigration policy
Skilled-trade availability for DPR is shaped by visa rules, apprenticeship incentives and prevailing wage laws; federal IIJA's $1 trillion program and CHIPS Act's $52 billion boost demand for MEP trades. Tight labor policy can constrain complex MEP work for tech and healthcare projects. Public training grants tied to IIJA and DOL funding expand capacity on megaprojects, supporting DPR's craft pipeline growth.
Trade and procurement geopolitics
- Tariffs/export controls: limit tools, materials
- Buy America (IIJA $1.2T): longer lead times
- Sanctions: disrupt advanced-tech suppliers
- Mitigation: early procurement, alternate sourcing
Government client procurement models
Government client procurement models—ID/IQs, CM-at-Risk, and progressive design-build—vary widely by agency, with public construction spending near $400B in 2023 (US Census Bureau) shaping demand and contract type selection.
IPD acceptance in public institutions remains limited but growing, improving collaboration and risk-sharing where adopted; GAO recorded 2,163 bid protests in FY2023, raising pursuit costs and transparency scrutiny.
DPR’s proven design-build and IPD capabilities align with modernization trends, positioning the firm to capture complex, integrated public projects as agencies shift toward alternative delivery.
- ID/IQs, CM-at-Risk, progressive design-build vary by agency
- IPD growth boosts collaboration and shared risk
- 2,163 GAO protests in FY2023 increase pursuit costs
- ~$400B public construction market (2023) favors integrated delivery; DPR aligned
IIJA/IRA/CHIPS fuel hospital, lab & data center pipelines; election timing raises risk
Federal packages (IIJA $1.2T, CHIPS $52B, IRA energy ~$369B) expand hospital, lab and data center pipelines while election cycles create timing risk. Buy America, export controls and sanctions lengthen lead times and raise costs. Public construction ~ $400B (2023); 2,163 GAO protests (FY2023) increase pursuit risk.
| Factor | Key metric |
|---|---|
| IIJA/IRA/CHIPS | $1.2T / ~$369B / $52B |
| Public spend | $400B (2023) |
| GAO protests | 2,163 (FY2023) |
What is included in the product
Detailed Word Document
Explores how external macro-environmental factors uniquely affect DPR Construction across Political, Economic, Social, Technological, Environmental, and Legal dimensions, with each section backed by current data and trend analysis; designed for executives, investors, and strategists to identify risks, opportunities and forward‑looking scenarios ready for inclusion in plans and reports.
Customizable Excel Spreadsheet
Visually segmented by PESTLE categories for rapid interpretation, this DPR Construction PESTLE summary is concise and presentation-ready, easily dropped into slides or shared across teams and editable to add region- or project-specific notes.
Economic factors
Interest rates and capital cost
Higher borrowing costs—with the federal funds rate near 5.25–5.50% in 2024—raise owner hurdle rates and commonly delay project starts. Healthcare systems and universities have publicly scaled back or postponed nonessential capital programs amid tighter financing. Conversely, mission-critical tech and biopharma projects frequently proceed due to strategic imperatives. DPR’s precon value engineering helps preserve feasibility by cutting scope and cost early.
Materials inflation and volatility
Steel, electrical gear, and HVAC components remain price-volatile with long lead times; steel saw roughly a 40% decline from 2022 peaks into 2023 while electrical equipment lead times often run 20–26 weeks and HVAC 12–24 weeks. Supply normalization has lowered short-term risk but shocks can recur. Escalation clauses and early-buy strategies protect margins and schedules. Strong supplier partnerships improve availability on complex builds.
Labor market tightness
Tight craft markets drove craft wage inflation near 5%–6% YoY in 2024 and subcontractor capacity limits, with an AGC 2024 survey showing roughly 70% of firms reporting worker shortages, compressing bid margins. DPR offsets pressure via prefabrication and VDC, yielding 10%–20% productivity gains, while regional labor dynamics shape market choice and DPR’s self-perform and trade-partner network act as economic levers.
Sector-specific capex cycles
Semiconductor, data center and biopharma capex follow distinct cycles—semiconductor capex reached about $75B in 2024, data center investment topped ~$150B, and biopharma facility spending hovered near $40B—often countercyclical to soft commercial office demand; hospital project timing tracks slim US median operating margins (~1.5% in 2023–24) while higher education campus plans hinge on endowment performance (NACUBO-style funds returned strongly in 2024, ~+11%).
- Sector diversification stabilizes revenue
- Semiconductor capex ~ $75B (2024)
- Data center spend ~ $150B (2024)
- Biopharma facility spend ~ $40B (2024)
- Hospital margins ~1.5% affect project timing
- Higher-ed endowments (~+11% 2024) drive campus capex
Backlog quality and cash flow
Complex, long-duration projects give DPR roughly $6.1 billion backlog (2024), improving revenue visibility but raising working capital and WIP financing needs.
Strict milestone billing and disciplined change-order management maintain liquidity and keep receivable cycles tight.
Preconstruction services expand a conversion pipeline and bolster pricing power while front-end risk screening preserves a profitable backlog.
- Backlog: $6.1B (2024)
- Milestone billing: tightens receivables
- Preconstruction: improves pricing power
- Risk screening: protects margin
IIJA/IRA/CHIPS fuel hospital, lab & data center pipelines; election timing raises risk
Higher borrowing costs (fed funds ~5.25–5.50% 2024) elevate owner hurdle rates and delay nonessential starts while mission-critical tech/biopharma work continues. Supply prices and lead times remain volatile but normalized versus 2022 peaks; escalation clauses and early buys protect margins. Tight craft markets (wage inflation ~5%–6% YoY) and a $6.1B backlog boost visibility but increase WIP financing needs.
| Metric | Value |
|---|---|
| Fed funds (2024) | 5.25–5.50% |
| Backlog (2024) | $6.1B |
| Semiconductor capex (2024) | $75B |
| Data center spend (2024) | $150B |
| Biopharma spend (2024) | $40B |
| Craft wage inflation (2024) | 5%–6% YoY |
| Hospital margins (2023–24) | ~1.5% |
| Higher-ed endowment return (2024) | ~+11% |
Preview Before You Purchase
DPR Construction PESTLE Analysis
The preview shown here is the exact DPR Construction PESTLE Analysis document you’ll receive after purchase—fully formatted and ready to use. The layout, content, and structure visible are identical to the downloadable file you’ll get at checkout. No placeholders or teasers; this is the final, professionally structured report.











