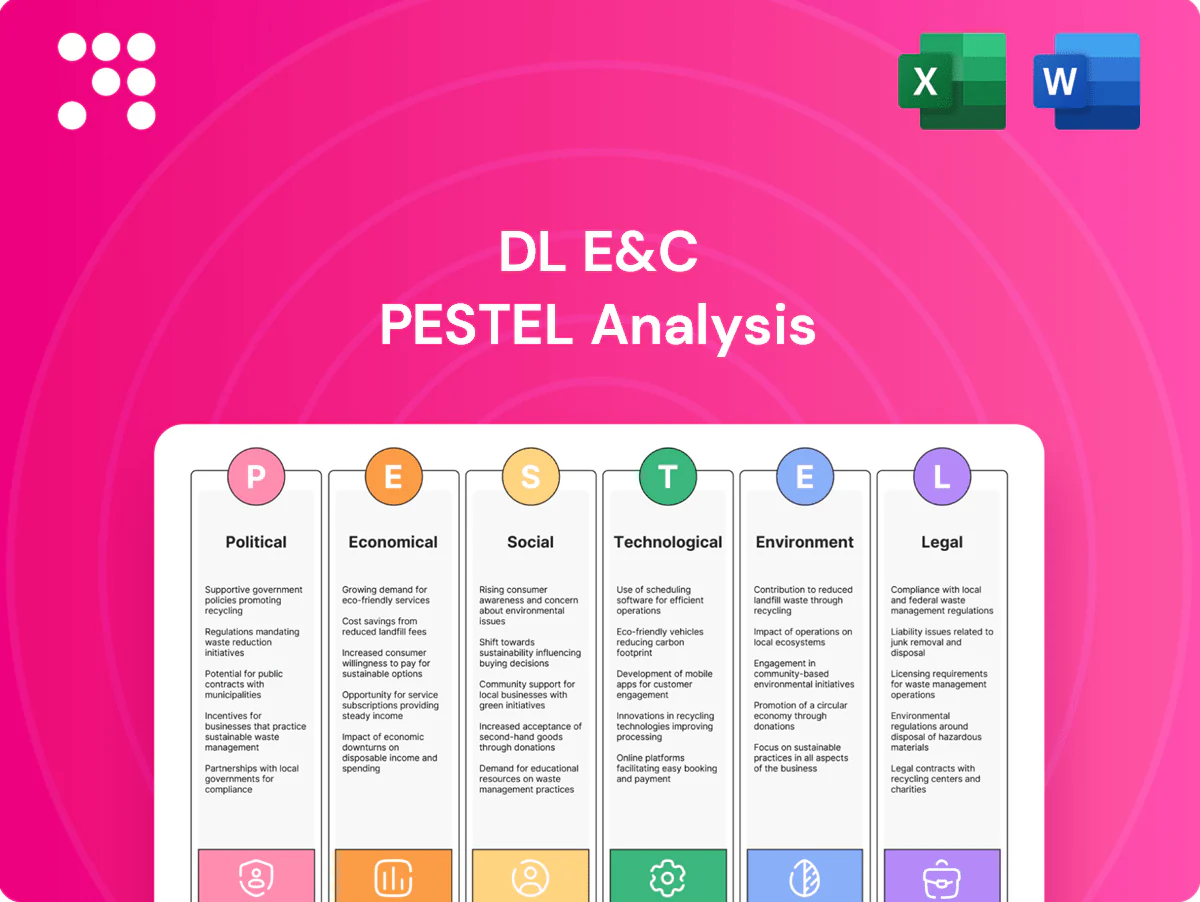
DL E&C PESTLE Analysis

Plan Smarter. Present Sharper. Compete Stronger.
Gain a strategic edge with our PESTLE Analysis of DL E&C—examining political, economic, social, technological, legal and environmental forces shaping the firm's future. Ready-made, editable, and research-backed; purchase the full report for instant, actionable insights.
Political factors

Infrastructure spending and public budgets
Government CAPEX cycles drive civil and social infrastructure pipelines for EPC bidders; South Korea’s 2024 state budget was about KRW 639.5 trillion, highlighting sizable public spending levers. Shifts in fiscal priorities can accelerate metro, rail and water projects or defer them, so DL E&C must track national and municipal budget calendars to time bids and resources. Diversification across countries smooths budget-driven volatility.
Geopolitical risk and market access
Sanctions, trade restrictions, and diplomatic rifts can halt cross-border plant and power projects, so DL E&C must treat market access as a core risk; projects into the Middle East, Southeast Asia, and other emerging markets offer high returns alongside elevated political risk. Scenario planning and political risk insurance (via providers such as MIGA and private PRI markets) are essential for contracts and financing. Strong local joint ventures and trusted partners reduce entry barriers, speed permitting, and limit exposure to sudden regulatory shifts.

PPP frameworks and procurement rules
Policy support for PPP/PFI determines pipeline size and risk allocation; World Bank PPI reported roughly $100bn in PPP investments in developing countries in 2023, signaling available opportunity and competitive risk transfer models.
Transparent tendering, local content and strict qualification criteria materially affect win rates and margin potential, with localization requirements often raising capex by 3–7% in recent projects.
DL E&C should optimize consortium structures to meet localization and financing requirements and engage authorities early to influence design and accelerate approvals, cutting typical permitting delays by months.

Energy and industrial policy shifts
Government roadmaps for petrochemicals, hydrogen and renewables shape plant demand; global clean energy investment reached about 1.7 trillion USD in 2023 (IEA) and US IRA offers roughly 369 billion USD in clean-energy tax incentives, unlocking EPC opportunities in low-carbon infrastructure. DL E&C must align bids with national industrial strategies to qualify for incentives, and maintain flexible backlog composition to withstand policy reversals.
- roadmaps → plant demand
- IRA 369bn USD → EPC incentives
- 1.7tn USD (2023) → market scale
- align bids for incentives
- flexible backlog to hedge reversals
Labor mobility and immigration policy
Restrictions on foreign skilled labor can constrain site staffing and raise costs; for example the US H-1B annual cap remains 85,000, limiting rapid redeployment. Visa regimes and worker quotas differ by host country and project phase, increasing mobilization time and premium labor rates. DL E&C should build local training pipelines and regional labor pools and strictly comply with worker welfare standards to protect licenses and reputation.
- Impact: H-1B cap 85,000 limits US skilled inflow
- Mitigation: invest in local training and regional pools
- Compliance: worker-welfare breaches risk fines and license loss
CAPEX, PPP and $1.7T clean-energy drive EPC; localize to manage H-1B risk
Government CAPEX cycles (S Korea 2024 budget KRW 639.5T) and PPP flows (~$100bn 2023) set pipeline timing; policy incentives (global clean-energy $1.7T 2023; US IRA ~$369bn) shift EPC demand while localization often adds 3–7% capex. Sanctions, trade frictions and labor caps (H-1B 85,000) raise market-access and staffing risk; mitigate via JV, PRI, local training and flexible backlog.
| Factor | Key data | Impact | Mitigation |
|---|---|---|---|
| Budget cycles | KRW 639.5T (2024) | Timing of bids | Align bids with calendars |
| Clean-energy | $1.7T (2023); IRA $369B | New EPC demand | Target incentives |
| Labor | H-1B cap 85,000 | Staffing cost/delay | Local training |
What is included in the product
 Detailed Word Document
Explores how Political, Economic, Social, Technological, Environmental and Legal factors uniquely affect DL E&C, with data-backed trends and sector-specific examples to reveal risks and opportunities for strategy and investment decisions.

 Customizable Excel Spreadsheet
Clean, summarized PESTLE insights for DL E&C, visually segmented by category and concise enough to drop into presentations or planning sessions, while allowing quick annotations for regional or business-line context and easy sharing across teams.
Economic factors

Interest rates and project financing costs
Rising global rates (US policy 5.25–5.50% mid‑2025) lift sponsor WACC and compress NPV for long‑gestation assets; project returns can fall by several percentage points. EPC orders relying on limited‑recourse finance often slip or downsize as spreads have widened ~150–250 bps YoY. DL E&C can differentiate by offering arranging capabilities and EPC+F packages, plus hedging and flexible payment milestones to protect cash flow.
Commodity and materials price volatility
Steel, cement, copper and fuel swings (HRC volatility ~±18% 2023–24) pressure DL E&C lump-sum margins; Brent averaged about 86 USD/bbl in 2024 and copper near 9,500 USD/t, while cement saw ~7% regional inflation YoY in 2024. Escalation clauses and supplier frameworks are essential to transfer risk. DL E&C should expand strategic sourcing and inventory buffers for critical items. Value engineering and modularization reduce exposure to spot markets.

Currency fluctuations (KRW vs USD and local FX)
Revenue often denominated in USD (USD ≈ 1,300 KRW mid‑2025) while costs span KRW, EUR, AED and local FX, so exchange moves materially affect margins. Recent KRW swings versus USD have amplified reported earnings volatility and eroded project-level profitability on large overseas contracts. DL E&C requires disciplined hedging, natural offsets and FX‑aligned contracting; country choice must factor convertibility and repatriation risk.

Global growth and capex cycles
Industrial capex tracks GDP and energy costs: IMF projected global growth ~3.0% in 2024 with modest pickup to ~3.1% in 2025, while Brent averaged about $85/bbl in 2024, shaping petrochemical investment cycles and balance-sheet capacity.
Downturns compress order books; recoveries expand backlog—DL E&C should balance cyclical petrochem exposure with resilient water and transmission projects and expand counter-cyclical O&M to stabilize revenue.
- GDP: IMF global growth ~3.0% (2024), ~3.1% (2025)
- Energy: Brent ~USD 85/bbl (2024 avg)
- Strategy: mix petrochem + water/transmission + O&M
Credit risk of sponsors and counterparties
Developer and SOE solvency directly affects milestone payments and change-order recovery; DL E&C reported a backlog of about KRW 9 trillion in 2024, concentrating cashflow risk with large sponsors. Tight credit conditions in 2024–25 raised default and delay probabilities across construction, pushing firms to bolster pre-award due diligence and require guarantees or standby LCs. Diversifying client mix lowers concentration risk and improves resilience.
- Require guarantees/LCs
- Enhance pre-award due diligence
- Diversify client mix
- Monitor sponsor solvency
CAPEX, PPP and $1.7T clean-energy drive EPC; localize to manage H-1B risk
Higher global rates (US 5.25–5.50% mid‑2025) and tighter spreads cut NPV on long projects; commodity swings (Brent ≈ USD85 2024, copper ≈ USD9,500/t, HRC ±18% 2023–24) squeeze lump‑sum margins and inflate costs. FX (USD ≈1,300 KRW mid‑2025) and sponsor solvency (DL E&C backlog ≈ KRW9tn 2024) drive project risk; disciplined hedging, escalation clauses and mix diversification are essential.
| Metric | Value |
|---|---|
| US policy rate | 5.25–5.50% (mid‑2025) |
| Brent 2024 | ~USD85/bbl |
| Copper | ~USD9,500/t |
| KRW/USD | ~1,300 (mid‑2025) |
| Backlog | KRW9tn (2024) |
Full Version Awaits
DL E&C PESTLE Analysis
This DL E&C PESTLE Analysis provides a concise, professional evaluation of Political, Economic, Social, Technological, Legal, and Environmental factors affecting DL E&C. The preview shown here is the exact document you’ll receive after purchase—fully formatted and ready to use. No placeholders or teasers—what you see is the final, downloadable file.

Original: $10.00
-65%$10.00
$3.50Product Information
Product Information
Shipping & Returns
Shipping & Returns
Description
Plan Smarter. Present Sharper. Compete Stronger.
Gain a strategic edge with our PESTLE Analysis of DL E&C—examining political, economic, social, technological, legal and environmental forces shaping the firm's future. Ready-made, editable, and research-backed; purchase the full report for instant, actionable insights.
Political factors
Infrastructure spending and public budgets
Government CAPEX cycles drive civil and social infrastructure pipelines for EPC bidders; South Korea’s 2024 state budget was about KRW 639.5 trillion, highlighting sizable public spending levers. Shifts in fiscal priorities can accelerate metro, rail and water projects or defer them, so DL E&C must track national and municipal budget calendars to time bids and resources. Diversification across countries smooths budget-driven volatility.
Geopolitical risk and market access
Sanctions, trade restrictions, and diplomatic rifts can halt cross-border plant and power projects, so DL E&C must treat market access as a core risk; projects into the Middle East, Southeast Asia, and other emerging markets offer high returns alongside elevated political risk. Scenario planning and political risk insurance (via providers such as MIGA and private PRI markets) are essential for contracts and financing. Strong local joint ventures and trusted partners reduce entry barriers, speed permitting, and limit exposure to sudden regulatory shifts.
PPP frameworks and procurement rules
Policy support for PPP/PFI determines pipeline size and risk allocation; World Bank PPI reported roughly $100bn in PPP investments in developing countries in 2023, signaling available opportunity and competitive risk transfer models.
Transparent tendering, local content and strict qualification criteria materially affect win rates and margin potential, with localization requirements often raising capex by 3–7% in recent projects.
DL E&C should optimize consortium structures to meet localization and financing requirements and engage authorities early to influence design and accelerate approvals, cutting typical permitting delays by months.
Energy and industrial policy shifts
Government roadmaps for petrochemicals, hydrogen and renewables shape plant demand; global clean energy investment reached about 1.7 trillion USD in 2023 (IEA) and US IRA offers roughly 369 billion USD in clean-energy tax incentives, unlocking EPC opportunities in low-carbon infrastructure. DL E&C must align bids with national industrial strategies to qualify for incentives, and maintain flexible backlog composition to withstand policy reversals.
- roadmaps → plant demand
- IRA 369bn USD → EPC incentives
- 1.7tn USD (2023) → market scale
- align bids for incentives
- flexible backlog to hedge reversals
Labor mobility and immigration policy
Restrictions on foreign skilled labor can constrain site staffing and raise costs; for example the US H-1B annual cap remains 85,000, limiting rapid redeployment. Visa regimes and worker quotas differ by host country and project phase, increasing mobilization time and premium labor rates. DL E&C should build local training pipelines and regional labor pools and strictly comply with worker welfare standards to protect licenses and reputation.
- Impact: H-1B cap 85,000 limits US skilled inflow
- Mitigation: invest in local training and regional pools
- Compliance: worker-welfare breaches risk fines and license loss
CAPEX, PPP and $1.7T clean-energy drive EPC; localize to manage H-1B risk
Government CAPEX cycles (S Korea 2024 budget KRW 639.5T) and PPP flows (~$100bn 2023) set pipeline timing; policy incentives (global clean-energy $1.7T 2023; US IRA ~$369bn) shift EPC demand while localization often adds 3–7% capex. Sanctions, trade frictions and labor caps (H-1B 85,000) raise market-access and staffing risk; mitigate via JV, PRI, local training and flexible backlog.
| Factor | Key data | Impact | Mitigation |
|---|---|---|---|
| Budget cycles | KRW 639.5T (2024) | Timing of bids | Align bids with calendars |
| Clean-energy | $1.7T (2023); IRA $369B | New EPC demand | Target incentives |
| Labor | H-1B cap 85,000 | Staffing cost/delay | Local training |
What is included in the product
Detailed Word Document
Explores how Political, Economic, Social, Technological, Environmental and Legal factors uniquely affect DL E&C, with data-backed trends and sector-specific examples to reveal risks and opportunities for strategy and investment decisions.
Customizable Excel Spreadsheet
Clean, summarized PESTLE insights for DL E&C, visually segmented by category and concise enough to drop into presentations or planning sessions, while allowing quick annotations for regional or business-line context and easy sharing across teams.
Economic factors
Interest rates and project financing costs
Rising global rates (US policy 5.25–5.50% mid‑2025) lift sponsor WACC and compress NPV for long‑gestation assets; project returns can fall by several percentage points. EPC orders relying on limited‑recourse finance often slip or downsize as spreads have widened ~150–250 bps YoY. DL E&C can differentiate by offering arranging capabilities and EPC+F packages, plus hedging and flexible payment milestones to protect cash flow.
Commodity and materials price volatility
Steel, cement, copper and fuel swings (HRC volatility ~±18% 2023–24) pressure DL E&C lump-sum margins; Brent averaged about 86 USD/bbl in 2024 and copper near 9,500 USD/t, while cement saw ~7% regional inflation YoY in 2024. Escalation clauses and supplier frameworks are essential to transfer risk. DL E&C should expand strategic sourcing and inventory buffers for critical items. Value engineering and modularization reduce exposure to spot markets.
Currency fluctuations (KRW vs USD and local FX)
Revenue often denominated in USD (USD ≈ 1,300 KRW mid‑2025) while costs span KRW, EUR, AED and local FX, so exchange moves materially affect margins. Recent KRW swings versus USD have amplified reported earnings volatility and eroded project-level profitability on large overseas contracts. DL E&C requires disciplined hedging, natural offsets and FX‑aligned contracting; country choice must factor convertibility and repatriation risk.
Global growth and capex cycles
Industrial capex tracks GDP and energy costs: IMF projected global growth ~3.0% in 2024 with modest pickup to ~3.1% in 2025, while Brent averaged about $85/bbl in 2024, shaping petrochemical investment cycles and balance-sheet capacity.
Downturns compress order books; recoveries expand backlog—DL E&C should balance cyclical petrochem exposure with resilient water and transmission projects and expand counter-cyclical O&M to stabilize revenue.
- GDP: IMF global growth ~3.0% (2024), ~3.1% (2025)
- Energy: Brent ~USD 85/bbl (2024 avg)
- Strategy: mix petrochem + water/transmission + O&M
Credit risk of sponsors and counterparties
Developer and SOE solvency directly affects milestone payments and change-order recovery; DL E&C reported a backlog of about KRW 9 trillion in 2024, concentrating cashflow risk with large sponsors. Tight credit conditions in 2024–25 raised default and delay probabilities across construction, pushing firms to bolster pre-award due diligence and require guarantees or standby LCs. Diversifying client mix lowers concentration risk and improves resilience.
- Require guarantees/LCs
- Enhance pre-award due diligence
- Diversify client mix
- Monitor sponsor solvency
CAPEX, PPP and $1.7T clean-energy drive EPC; localize to manage H-1B risk
Higher global rates (US 5.25–5.50% mid‑2025) and tighter spreads cut NPV on long projects; commodity swings (Brent ≈ USD85 2024, copper ≈ USD9,500/t, HRC ±18% 2023–24) squeeze lump‑sum margins and inflate costs. FX (USD ≈1,300 KRW mid‑2025) and sponsor solvency (DL E&C backlog ≈ KRW9tn 2024) drive project risk; disciplined hedging, escalation clauses and mix diversification are essential.
| Metric | Value |
|---|---|
| US policy rate | 5.25–5.50% (mid‑2025) |
| Brent 2024 | ~USD85/bbl |
| Copper | ~USD9,500/t |
| KRW/USD | ~1,300 (mid‑2025) |
| Backlog | KRW9tn (2024) |
Full Version Awaits
DL E&C PESTLE Analysis
This DL E&C PESTLE Analysis provides a concise, professional evaluation of Political, Economic, Social, Technological, Legal, and Environmental factors affecting DL E&C. The preview shown here is the exact document you’ll receive after purchase—fully formatted and ready to use. No placeholders or teasers—what you see is the final, downloadable file.











