Public Power Business Model Canvas

Explore the complete Business Model Canvas to benchmark, plan and invest confidently
Unlock the full strategic blueprint behind Public Power's business model. This in-depth Business Model Canvas maps value propositions, customer segments, partnerships, revenue streams and cost structure to reveal competitive advantages. Download the complete Word/Excel canvas to benchmark, plan, and invest with confidence.
Partnerships

Energy regulators and market operators
PPC collaborates closely with two regulators, Greek RAE and EU ACER, to ensure compliance and market access. Partnerships with two market operators, Hellenic Energy Exchange and TSO ADMIE, support day-ahead, intraday and balancing participation. Alignment enables tariff approvals, RES incentives and grid code compliance, mitigating regulatory risk and facilitating strategic expansion.
Transmission and distribution system operators
PPC coordinates daily with the national TSO, IPTO (ADMIE), and the DSO, HEDNO, to ensure reliable delivery, grid connection, metering, outage management and coordinated network planning. Joint projects in 2024 accelerated grid modernization and RES integration, aligning with Greece’s decarbonization targets and broader EU digitalization funds. Service-level coordination preserves power quality and continuity, helping contain distribution losses around the EU average of about 6%.

Fuel suppliers and equipment OEMs
PPC partners with gas suppliers, coal/lignite logistics and hydrology stakeholders while OEMs supply turbines, PV modules, wind turbines, batteries and digital control systems to secure generation mix and spare parts pipelines.
Long-term agreements stabilize fuel and equipment costs and ensure spare-parts availability; technical alliances drive efficiency upgrades and decarbonization pathways.
BloombergNEF reported a 2023 average lithium-ion battery pack price of about $132/kWh, improving battery economics for storage integration.

Renewable developers and EPC contractors
Public power partners with renewable developers and EPCs for co-development, EPC and O&M across wind, solar, hydro and storage, accelerating pipeline delivery and capital efficiency; joint PPAs and JVs (common 15–25 year PPA terms in 2024) de-risk development and improve grid access, while knowledge transfer cuts permitting and execution time by up to 30%.
- Co-dev/EPC/O&M: faster delivery, 10–20% lower capex/MW
- PPAs/JVs: 15–25 yr revenue certainty
- Knowledge transfer: ≤30% faster permitting
Financial institutions and funding bodies
- Banks: long-term debt for capex
- Multilaterals/EU: concessional grants/loans
- Green bonds/SLLs: ESG-linked pricing
Regulator, OEM & financier alliances cut capex 10–20% and speed permitting
PPC partners with regulators (RAE, ACER), market operators (HEnEx, ADMIE) and DSO/TSO (HEDNO/IPTO) for compliance, market access and grid coordination. Long-term fuel, OEM and EPC alliances plus PPAs/JVs (15–25 yr) de-risk supply, cut capex/MW 10–20% and speed permitting ≤30%. Finance from banks, multilaterals, EU funds and green bonds (sustainable bond market >$1.5tn) lowers WACC; battery pack avg $132/kWh (2023).
| Partner | Role | Metric |
|---|---|---|
| Regulators/Markets | Compliance/Access | Tariff approvals |
| EPC/OEM/Developers | Build/O&M | Capex −10–20% |
| Financiers | Capex/ESG | Green bonds >$1.5tn |
What is included in the product
 Detailed Word Document
A comprehensive Business Model Canvas tailored to a public power utility, detailing customer segments, value propositions, channels, revenue streams, key activities, resources, partners, cost structure, and governance. Ideal for board presentations, investor discussions, strategy validation, and linking SWOT insights to operational plans.

 Customizable Excel Spreadsheet
High-level view of a public power utility’s business model with editable cells, easing stakeholder alignment, regulatory planning, and operational trade-offs; saves hours of structuring strategy and is perfect for boardrooms, teams, and quick side-by-side comparisons.
Activities

Electricity generation and asset optimization
PPC operates lignite, gas, hydro, wind and solar fleets and consolidated dispatch across these units to optimize output and maintenance cycles, supporting reported targets to expand RES to about 7.5 GW by 2030 as stated in PPC’s strategy. Flexibility upgrades — retrofits and fast-ramping gas units — improve balancing for rising RES variability. Digital monitoring and predictive maintenance programs boost efficiency and uptime, reducing forced outage rates and O&M costs.
Retail supply and portfolio management
PPC prices and bills serve both mass-market and industrial customers, with 2024 average retail rates at about 16.95 USc/kWh in the US (EIA) and 0.334 EUR/kWh in the EU (Eurostat). The retailer hedges commodity risk through short-term markets and long-term PPAs covering a large share of load. Product design mixes fixed, variable and green tariffs to match customer segments. Robust credit control and timely collections sustain operating cash flow.

Grid coordination and market participation
PPC coordinates with TSO/DSO for connections, outage management and 15-minute metering intervals, following standard grid protocols. It trades in day-ahead (gate closure 12:00 CET in many European markets), intraday and balancing markets with 5-minute settlement for real-time dispatch in several regions (e.g., ERCOT). Ancillary services deliver frequency and reserve support; robust data exchange underpins settlement accuracy and compliance in 2024.

Renewable development and project execution
PPC originates, permits, finances and builds RES and storage projects, running EPC tenders and managing O&M contracts to deliver utility-scale assets; typical 2024 benchmarks include utility solar capex ~€600/kW, onshore wind ~€1,200/kW and battery pack costs near $120/kWh (2024). Site selection optimises resource, grid access and environmental constraints, while proactive community engagement secures social license.
- Pipeline: originations to 1–3 GW scale per project cluster
- Contracts: EPC procurement and 10–25 year O&M oversight
- Costs: solar €600/kW; wind €1,200/kW; batteries $120/kWh (2024)
Customer service and digital enablement
PPC operates contact centers, physical branches and self-service platforms to handle onboarding, switching and issue resolution, leveraging smart metering and analytics to deliver tailored offers and real-time support; in 2024 digital billing adoption reached 65%, lowering billing costs and cutting churn by an estimated 20%.
- Contact centers, branches, self-service
- Onboarding, switching, issue resolution
- Smart metering + analytics = tailored offers
- Digital billing: 65% adoption (2024), ~20% churn reduction
Integrated thermal + RES fleet eyes 7.5 GW by 2030; retail ~16.95 USc/kWh (US)
PPC operates lignite, gas, hydro, wind and solar fleets with consolidated dispatch and flexibility retrofits to integrate rising RES. Retail mix hedged via short-term markets and PPAs; 2024 avg retail rates ~16.95 USc/kWh (US) and 0.334 EUR/kWh (EU). Pipeline targets ~7.5 GW RES by 2030; 2024 benchmarks: solar €600/kW, onshore wind €1,200/kW, batteries $120/kWh; digital billing 65% (2024).
| Metric | 2024 |
|---|---|
| Retail rate US | 16.95 USc/kWh |
| Retail rate EU | 0.334 EUR/kWh |
| Solar capex | €600/kW |
| Wind capex | €1,200/kW |
| Battery cost | $120/kWh |
| Digital billing | 65% |
Preview Before You Purchase
Business Model Canvas
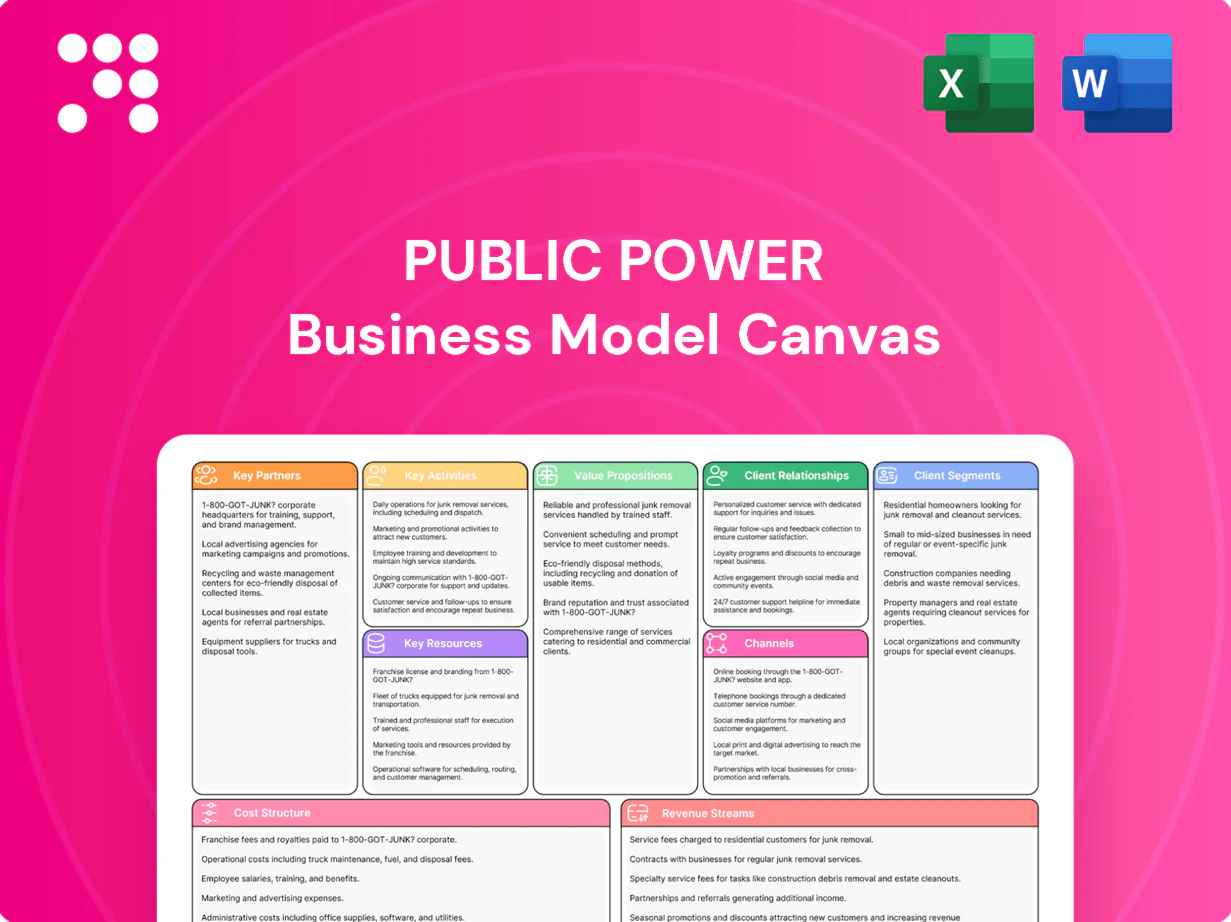
The document you're previewing is the actual Public Power Business Model Canvas, not a mockup—it's a direct excerpt from the final file you'll receive. After purchase you'll get the complete, fully editable Business Model Canvas in the same structured format. No substitutions or surprises—what you see is what you download.

Original: $10.00
-65%$10.00
$3.50Product Information
Product Information
Shipping & Returns
Shipping & Returns
Description
Explore the complete Business Model Canvas to benchmark, plan and invest confidently
Unlock the full strategic blueprint behind Public Power's business model. This in-depth Business Model Canvas maps value propositions, customer segments, partnerships, revenue streams and cost structure to reveal competitive advantages. Download the complete Word/Excel canvas to benchmark, plan, and invest with confidence.
Partnerships
Energy regulators and market operators
PPC collaborates closely with two regulators, Greek RAE and EU ACER, to ensure compliance and market access. Partnerships with two market operators, Hellenic Energy Exchange and TSO ADMIE, support day-ahead, intraday and balancing participation. Alignment enables tariff approvals, RES incentives and grid code compliance, mitigating regulatory risk and facilitating strategic expansion.
Transmission and distribution system operators
PPC coordinates daily with the national TSO, IPTO (ADMIE), and the DSO, HEDNO, to ensure reliable delivery, grid connection, metering, outage management and coordinated network planning. Joint projects in 2024 accelerated grid modernization and RES integration, aligning with Greece’s decarbonization targets and broader EU digitalization funds. Service-level coordination preserves power quality and continuity, helping contain distribution losses around the EU average of about 6%.
Fuel suppliers and equipment OEMs
PPC partners with gas suppliers, coal/lignite logistics and hydrology stakeholders while OEMs supply turbines, PV modules, wind turbines, batteries and digital control systems to secure generation mix and spare parts pipelines.
Long-term agreements stabilize fuel and equipment costs and ensure spare-parts availability; technical alliances drive efficiency upgrades and decarbonization pathways.
BloombergNEF reported a 2023 average lithium-ion battery pack price of about $132/kWh, improving battery economics for storage integration.
Renewable developers and EPC contractors
Public power partners with renewable developers and EPCs for co-development, EPC and O&M across wind, solar, hydro and storage, accelerating pipeline delivery and capital efficiency; joint PPAs and JVs (common 15–25 year PPA terms in 2024) de-risk development and improve grid access, while knowledge transfer cuts permitting and execution time by up to 30%.
- Co-dev/EPC/O&M: faster delivery, 10–20% lower capex/MW
- PPAs/JVs: 15–25 yr revenue certainty
- Knowledge transfer: ≤30% faster permitting
Financial institutions and funding bodies
- Banks: long-term debt for capex
- Multilaterals/EU: concessional grants/loans
- Green bonds/SLLs: ESG-linked pricing
Regulator, OEM & financier alliances cut capex 10–20% and speed permitting
PPC partners with regulators (RAE, ACER), market operators (HEnEx, ADMIE) and DSO/TSO (HEDNO/IPTO) for compliance, market access and grid coordination. Long-term fuel, OEM and EPC alliances plus PPAs/JVs (15–25 yr) de-risk supply, cut capex/MW 10–20% and speed permitting ≤30%. Finance from banks, multilaterals, EU funds and green bonds (sustainable bond market >$1.5tn) lowers WACC; battery pack avg $132/kWh (2023).
| Partner | Role | Metric |
|---|---|---|
| Regulators/Markets | Compliance/Access | Tariff approvals |
| EPC/OEM/Developers | Build/O&M | Capex −10–20% |
| Financiers | Capex/ESG | Green bonds >$1.5tn |
What is included in the product
Detailed Word Document
A comprehensive Business Model Canvas tailored to a public power utility, detailing customer segments, value propositions, channels, revenue streams, key activities, resources, partners, cost structure, and governance. Ideal for board presentations, investor discussions, strategy validation, and linking SWOT insights to operational plans.
Customizable Excel Spreadsheet
High-level view of a public power utility’s business model with editable cells, easing stakeholder alignment, regulatory planning, and operational trade-offs; saves hours of structuring strategy and is perfect for boardrooms, teams, and quick side-by-side comparisons.
Activities
Electricity generation and asset optimization
PPC operates lignite, gas, hydro, wind and solar fleets and consolidated dispatch across these units to optimize output and maintenance cycles, supporting reported targets to expand RES to about 7.5 GW by 2030 as stated in PPC’s strategy. Flexibility upgrades — retrofits and fast-ramping gas units — improve balancing for rising RES variability. Digital monitoring and predictive maintenance programs boost efficiency and uptime, reducing forced outage rates and O&M costs.
Retail supply and portfolio management
PPC prices and bills serve both mass-market and industrial customers, with 2024 average retail rates at about 16.95 USc/kWh in the US (EIA) and 0.334 EUR/kWh in the EU (Eurostat). The retailer hedges commodity risk through short-term markets and long-term PPAs covering a large share of load. Product design mixes fixed, variable and green tariffs to match customer segments. Robust credit control and timely collections sustain operating cash flow.
Grid coordination and market participation
PPC coordinates with TSO/DSO for connections, outage management and 15-minute metering intervals, following standard grid protocols. It trades in day-ahead (gate closure 12:00 CET in many European markets), intraday and balancing markets with 5-minute settlement for real-time dispatch in several regions (e.g., ERCOT). Ancillary services deliver frequency and reserve support; robust data exchange underpins settlement accuracy and compliance in 2024.
Renewable development and project execution
PPC originates, permits, finances and builds RES and storage projects, running EPC tenders and managing O&M contracts to deliver utility-scale assets; typical 2024 benchmarks include utility solar capex ~€600/kW, onshore wind ~€1,200/kW and battery pack costs near $120/kWh (2024). Site selection optimises resource, grid access and environmental constraints, while proactive community engagement secures social license.
- Pipeline: originations to 1–3 GW scale per project cluster
- Contracts: EPC procurement and 10–25 year O&M oversight
- Costs: solar €600/kW; wind €1,200/kW; batteries $120/kWh (2024)
Customer service and digital enablement
PPC operates contact centers, physical branches and self-service platforms to handle onboarding, switching and issue resolution, leveraging smart metering and analytics to deliver tailored offers and real-time support; in 2024 digital billing adoption reached 65%, lowering billing costs and cutting churn by an estimated 20%.
- Contact centers, branches, self-service
- Onboarding, switching, issue resolution
- Smart metering + analytics = tailored offers
- Digital billing: 65% adoption (2024), ~20% churn reduction
Integrated thermal + RES fleet eyes 7.5 GW by 2030; retail ~16.95 USc/kWh (US)
PPC operates lignite, gas, hydro, wind and solar fleets with consolidated dispatch and flexibility retrofits to integrate rising RES. Retail mix hedged via short-term markets and PPAs; 2024 avg retail rates ~16.95 USc/kWh (US) and 0.334 EUR/kWh (EU). Pipeline targets ~7.5 GW RES by 2030; 2024 benchmarks: solar €600/kW, onshore wind €1,200/kW, batteries $120/kWh; digital billing 65% (2024).
| Metric | 2024 |
|---|---|
| Retail rate US | 16.95 USc/kWh |
| Retail rate EU | 0.334 EUR/kWh |
| Solar capex | €600/kW |
| Wind capex | €1,200/kW |
| Battery cost | $120/kWh |
| Digital billing | 65% |
Preview Before You Purchase
Business Model Canvas
The document you're previewing is the actual Public Power Business Model Canvas, not a mockup—it's a direct excerpt from the final file you'll receive. After purchase you'll get the complete, fully editable Business Model Canvas in the same structured format. No substitutions or surprises—what you see is what you download.