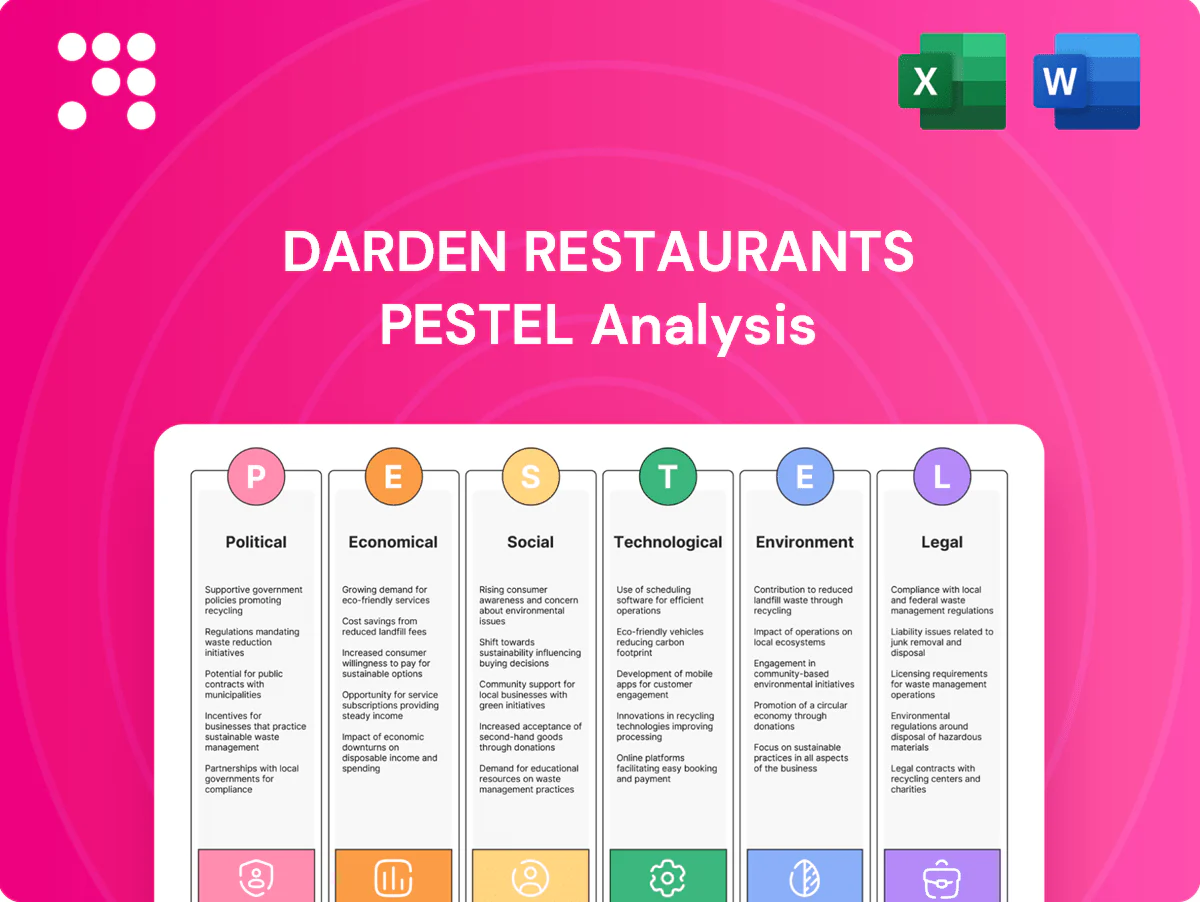
Darden Restaurants PESTLE Analysis

Skip the Research. Get the Strategy.
Gain strategic clarity with our PESTLE Analysis of Darden Restaurants—three to five sentences can't capture supply-chain, regulatory, or consumer shifts shaping its outlook. This concise brief highlights key external pressures and growth levers. Purchase the full report to access the complete, actionable analysis now.
Political factors

Minimum wage and labor policy shifts
Federal minimum wage remains $7.25/hr, while numerous states and cities have adopted $15+/hr floors and divergent tip credit rules and service-charge treatments; these shifts directly raise labor costs for Darden, which operates roughly 1,900 restaurants with about 180,000 employees, forcing staffing, menu engineering and advocacy to protect margins and competitiveness.
Food policy and nutrition standards
FDA menu-labeling rules (in force since 2018 for chains with 20+ locations) plus WHO's 30% sodium reduction target and the 2020–2025 Dietary Guidelines — with a 2025 update expected — force Darden (≈1,900 restaurants) to adapt recipes and marketing, require nutritional analysis and clear disclosure across brands, raise R&D and training costs while building consumer trust and meeting growing demand for healthier options.

Trade and import dynamics
Tariffs and geopolitical tensions raise costs for imported foods, wine, seafood and equipment used across Darden’s portfolio of over 1,900 restaurants, while currency swings shift relative input prices and supplier mix. Darden cites diversified sourcing and supplier breadth to mitigate shocks, and uses long‑term supply agreements and commodity hedging (noted in SEC filings) to help stabilize pricing.

Immigration and visa enforcement
Immigration and visa enforcement sharply affects hospitality labor: the US food service sector employed roughly 11.9 million workers in 2024, and Darden reported about 180,000 team members, so tighter enforcement can rapidly shrink available staff and push hourly wages higher. Darden is likely to expand recruiting, training and retention programs and deepen partnerships with vocational pipelines to stabilize staffing and contain labor costs.
- Impact: reduced labor supply, upward wage pressure
- Darden scale: ~180,000 employees (2024)
- Response: intensified recruiting/training/retention
- Mitigation: partnerships with vocational pipelines
Local permitting, zoning, and alcohol licensing
Restaurant openings hinge on municipal land-use, signage and occupancy rules; Darden operates over 1,900 restaurants and targets roughly 100 new openings annually, so local approvals materially shape growth. Alcohol licensing, which can represent about 15–20% of unit sales, affects concept viability and mix; licenses and permits can take 30–180 days and cost from hundreds to tens of thousands of dollars. Strong local government relations accelerate site activation and reduce hold costs.
- Permits: timelines 30–180 days
- Costs: $500–$25,000+
- Alcohol: ~15–20% of sales
- Pipeline: ~100 openings/year
Wage laws, labeling rules and tariffs squeeze margins for major casual-dining chain
Political forces — wage floors, tip-credit rules and immigration policy — raise labor costs for Darden (≈1,900 restaurants, ≈180,000 employees) and tighten labor supply; FDA labeling and dietary guidelines increase compliance/R&D costs. Tariffs, alcohol licensing and local permitting affect input costs and openings (~100/year), forcing supply agreements, hedging and local government relations.
| Metric | Value (2024/25) |
|---|---|
| Restaurants | ~1,900 |
| Employees | ~180,000 |
| Openings/yr | ~100 |
| US foodservice jobs | 11.9M (2024) |
| Federal min wage | $7.25/hr |
What is included in the product
 Detailed Word Document
Explores how macro-environmental factors uniquely affect Darden Restaurants across Political, Economic, Social, Technological, Environmental, and Legal dimensions, with data-driven subpoints and forward-looking insights; designed for executives, investors, and strategists and formatted for immediate use in plans or decks.

 Customizable Excel Spreadsheet
A clean, summarized PESTLE for Darden Restaurants, visually segmented for quick interpretation and easy insertion into presentations, with editable notes to tailor regional or business-line risks—ideal for aligning teams and supporting strategic discussions on external threats and market positioning.
Economic factors

Consumer discretionary spending cycles
Full-service dining correlates with employment and wage growth; US unemployment ~3.7% and average hourly earnings rose ~4% in 2024, supporting Darden’s FY2024 revenue of about $11.7B. Recessions shift traffic to value-oriented offerings or at-home consumption, pressuring check and visits. Darden’s multi-brand, multi-price portfolio smooths demand across cycles. Targeted promotions protect traffic without eroding brand equity.
Food inflation and commodity volatility
Volatility in beef, dairy, wheat and produce has materially pressured Darden's COGS, as food-away-from-home CPI ran roughly 5–6% year-over-year in 2024, forcing menu pricing increases and portion management to protect margins. Darden has leaned on multi-year contracts and supplier diversification to limit spot exposure and smooth volatility. Clear, value-focused messaging around price and portions helped sustain guest counts through 2023–24.

Labor market tightness and wage inflation
Labor-market tightness has pushed Darden to raise hourly wages, increase signing bonuses and training spend, straining unit margins; Darden employs about 175,000 team members (2024) making labor a material cost driver. Retention and productivity programs—cross-training and scheduling tech—serve as key margin levers. Employer brand and benefits support staffing stability while operational efficiencies offset rising unit-level expenses.

Interest rates and capital access
Higher interest rates—federal funds rose to about 5.25–5.50% in 2023–24—raise Darden’s borrowing costs for remodels, new-unit buildouts and buybacks and push discount rates higher, increasing hurdle rates for expansion projects and valuations. Darden’s strong operating cash flow and investment-grade debt access provide flexibility to fund capex or opportunistic buybacks without distress. Timing capex to rate cycles can materially improve return on invested capital.
- Higher policy rates: 5.25–5.50% (2023–24)
- Effects: higher borrowing costs, higher discount rates
- Strengths: robust operating cash flow and investment-grade access
- Strategy: shift capex timing to lower-rate windows to boost returns
Real estate costs and location economics
Rents, build-out costs and TI allowances materially shape site returns for Darden, which operates about 1,900 restaurants; higher urban rents and 2024 construction inflation raised per-site breakevens.
Migration to suburbs and continued suburbanization boosted traffic potential in 2024, and Darden leverages data-driven site selection and trade-area analytics to optimize unit-level returns.
Sale-leasebacks and landlord partnerships are used to manage capital intensity and free up capital for rollouts and remodels.
- scale: ~1,900 restaurants
- strategy: data-driven site selection
- capital: sale-leasebacks reduce upfront capex
Wage laws, labeling rules and tariffs squeeze margins for major casual-dining chain
Full-service dining tied to ~3.7% US unemployment and ~4% avg hourly wage growth in 2024, supporting Darden FY2024 revenue ≈ $11.7B. Food-away-from-home CPI rose ~5–6% in 2024, pressuring COGS; Darden uses contracts and diversification. Labor tightness (≈175,000 team members) and Fed funds 5.25–5.50% raise costs; ~1,900 restaurants shape rent/capex exposure.
| Metric | 2024 Value |
|---|---|
| US unemployment | ~3.7% |
| Avg hourly earnings | ~+4% |
| Food-away-from-home CPI | ~5–6% YoY |
| Darden revenue FY2024 | ≈ $11.7B |
| Team members | ≈175,000 |
| Fed funds | 5.25–5.50% |
| Restaurants | ≈1,900 |
Preview Before You Purchase
Darden Restaurants PESTLE Analysis
The Darden Restaurants PESTLE Analysis provides a concise review of political, economic, social, technological, legal, and environmental factors affecting the company and its brands. The preview shown here is the exact document you’ll receive after purchase—fully formatted and ready to use. It’s the final, professionally structured file you can download immediately after checkout.

Original: $10.00
-65%$10.00
$3.50Product Information
Product Information
Shipping & Returns
Shipping & Returns
Description
Skip the Research. Get the Strategy.
Gain strategic clarity with our PESTLE Analysis of Darden Restaurants—three to five sentences can't capture supply-chain, regulatory, or consumer shifts shaping its outlook. This concise brief highlights key external pressures and growth levers. Purchase the full report to access the complete, actionable analysis now.
Political factors
Minimum wage and labor policy shifts
Federal minimum wage remains $7.25/hr, while numerous states and cities have adopted $15+/hr floors and divergent tip credit rules and service-charge treatments; these shifts directly raise labor costs for Darden, which operates roughly 1,900 restaurants with about 180,000 employees, forcing staffing, menu engineering and advocacy to protect margins and competitiveness.
Food policy and nutrition standards
FDA menu-labeling rules (in force since 2018 for chains with 20+ locations) plus WHO's 30% sodium reduction target and the 2020–2025 Dietary Guidelines — with a 2025 update expected — force Darden (≈1,900 restaurants) to adapt recipes and marketing, require nutritional analysis and clear disclosure across brands, raise R&D and training costs while building consumer trust and meeting growing demand for healthier options.
Trade and import dynamics
Tariffs and geopolitical tensions raise costs for imported foods, wine, seafood and equipment used across Darden’s portfolio of over 1,900 restaurants, while currency swings shift relative input prices and supplier mix. Darden cites diversified sourcing and supplier breadth to mitigate shocks, and uses long‑term supply agreements and commodity hedging (noted in SEC filings) to help stabilize pricing.
Immigration and visa enforcement
Immigration and visa enforcement sharply affects hospitality labor: the US food service sector employed roughly 11.9 million workers in 2024, and Darden reported about 180,000 team members, so tighter enforcement can rapidly shrink available staff and push hourly wages higher. Darden is likely to expand recruiting, training and retention programs and deepen partnerships with vocational pipelines to stabilize staffing and contain labor costs.
- Impact: reduced labor supply, upward wage pressure
- Darden scale: ~180,000 employees (2024)
- Response: intensified recruiting/training/retention
- Mitigation: partnerships with vocational pipelines
Local permitting, zoning, and alcohol licensing
Restaurant openings hinge on municipal land-use, signage and occupancy rules; Darden operates over 1,900 restaurants and targets roughly 100 new openings annually, so local approvals materially shape growth. Alcohol licensing, which can represent about 15–20% of unit sales, affects concept viability and mix; licenses and permits can take 30–180 days and cost from hundreds to tens of thousands of dollars. Strong local government relations accelerate site activation and reduce hold costs.
- Permits: timelines 30–180 days
- Costs: $500–$25,000+
- Alcohol: ~15–20% of sales
- Pipeline: ~100 openings/year
Wage laws, labeling rules and tariffs squeeze margins for major casual-dining chain
Political forces — wage floors, tip-credit rules and immigration policy — raise labor costs for Darden (≈1,900 restaurants, ≈180,000 employees) and tighten labor supply; FDA labeling and dietary guidelines increase compliance/R&D costs. Tariffs, alcohol licensing and local permitting affect input costs and openings (~100/year), forcing supply agreements, hedging and local government relations.
| Metric | Value (2024/25) |
|---|---|
| Restaurants | ~1,900 |
| Employees | ~180,000 |
| Openings/yr | ~100 |
| US foodservice jobs | 11.9M (2024) |
| Federal min wage | $7.25/hr |
What is included in the product
Detailed Word Document
Explores how macro-environmental factors uniquely affect Darden Restaurants across Political, Economic, Social, Technological, Environmental, and Legal dimensions, with data-driven subpoints and forward-looking insights; designed for executives, investors, and strategists and formatted for immediate use in plans or decks.
Customizable Excel Spreadsheet
A clean, summarized PESTLE for Darden Restaurants, visually segmented for quick interpretation and easy insertion into presentations, with editable notes to tailor regional or business-line risks—ideal for aligning teams and supporting strategic discussions on external threats and market positioning.
Economic factors
Consumer discretionary spending cycles
Full-service dining correlates with employment and wage growth; US unemployment ~3.7% and average hourly earnings rose ~4% in 2024, supporting Darden’s FY2024 revenue of about $11.7B. Recessions shift traffic to value-oriented offerings or at-home consumption, pressuring check and visits. Darden’s multi-brand, multi-price portfolio smooths demand across cycles. Targeted promotions protect traffic without eroding brand equity.
Food inflation and commodity volatility
Volatility in beef, dairy, wheat and produce has materially pressured Darden's COGS, as food-away-from-home CPI ran roughly 5–6% year-over-year in 2024, forcing menu pricing increases and portion management to protect margins. Darden has leaned on multi-year contracts and supplier diversification to limit spot exposure and smooth volatility. Clear, value-focused messaging around price and portions helped sustain guest counts through 2023–24.
Labor market tightness and wage inflation
Labor-market tightness has pushed Darden to raise hourly wages, increase signing bonuses and training spend, straining unit margins; Darden employs about 175,000 team members (2024) making labor a material cost driver. Retention and productivity programs—cross-training and scheduling tech—serve as key margin levers. Employer brand and benefits support staffing stability while operational efficiencies offset rising unit-level expenses.
Interest rates and capital access
Higher interest rates—federal funds rose to about 5.25–5.50% in 2023–24—raise Darden’s borrowing costs for remodels, new-unit buildouts and buybacks and push discount rates higher, increasing hurdle rates for expansion projects and valuations. Darden’s strong operating cash flow and investment-grade debt access provide flexibility to fund capex or opportunistic buybacks without distress. Timing capex to rate cycles can materially improve return on invested capital.
- Higher policy rates: 5.25–5.50% (2023–24)
- Effects: higher borrowing costs, higher discount rates
- Strengths: robust operating cash flow and investment-grade access
- Strategy: shift capex timing to lower-rate windows to boost returns
Real estate costs and location economics
Rents, build-out costs and TI allowances materially shape site returns for Darden, which operates about 1,900 restaurants; higher urban rents and 2024 construction inflation raised per-site breakevens.
Migration to suburbs and continued suburbanization boosted traffic potential in 2024, and Darden leverages data-driven site selection and trade-area analytics to optimize unit-level returns.
Sale-leasebacks and landlord partnerships are used to manage capital intensity and free up capital for rollouts and remodels.
- scale: ~1,900 restaurants
- strategy: data-driven site selection
- capital: sale-leasebacks reduce upfront capex
Wage laws, labeling rules and tariffs squeeze margins for major casual-dining chain
Full-service dining tied to ~3.7% US unemployment and ~4% avg hourly wage growth in 2024, supporting Darden FY2024 revenue ≈ $11.7B. Food-away-from-home CPI rose ~5–6% in 2024, pressuring COGS; Darden uses contracts and diversification. Labor tightness (≈175,000 team members) and Fed funds 5.25–5.50% raise costs; ~1,900 restaurants shape rent/capex exposure.
| Metric | 2024 Value |
|---|---|
| US unemployment | ~3.7% |
| Avg hourly earnings | ~+4% |
| Food-away-from-home CPI | ~5–6% YoY |
| Darden revenue FY2024 | ≈ $11.7B |
| Team members | ≈175,000 |
| Fed funds | 5.25–5.50% |
| Restaurants | ≈1,900 |
Preview Before You Purchase
Darden Restaurants PESTLE Analysis
The Darden Restaurants PESTLE Analysis provides a concise review of political, economic, social, technological, legal, and environmental factors affecting the company and its brands. The preview shown here is the exact document you’ll receive after purchase—fully formatted and ready to use. It’s the final, professionally structured file you can download immediately after checkout.











