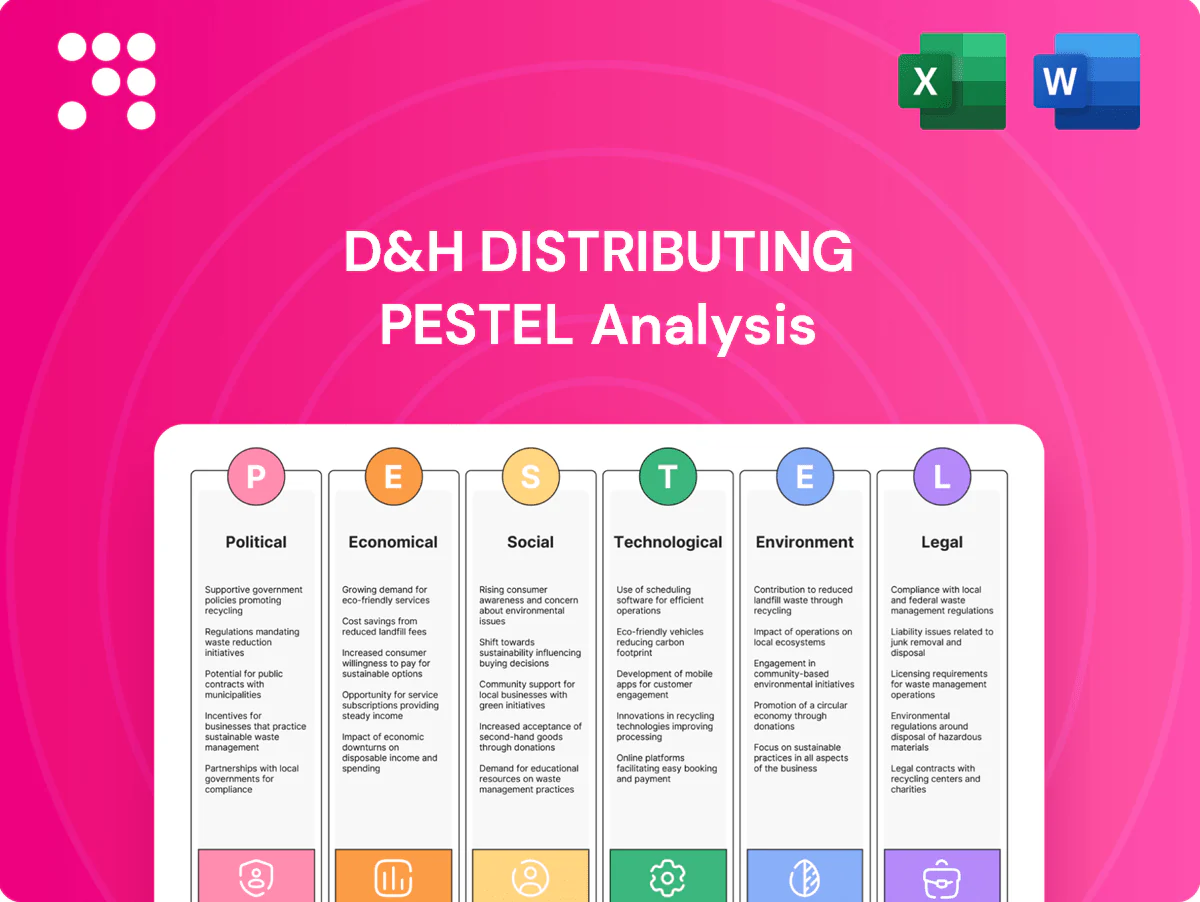
D&H Distributing PESTLE Analysis

Plan Smarter. Present Sharper. Compete Stronger.
Unlock how political shifts, economic cycles, and tech advances are reshaping D&H Distributing with our concise PESTLE snapshot. Use these insights to anticipate risk and spot growth opportunities for investors and strategists. Purchase the full PESTLE now for the complete, actionable analysis.
Political factors

Trade policy and tariffs
USMCA (in force July 1, 2020) underpins US–Canada flows but renegotiation could change duties and rules of origin; China tariffs covering roughly $360–370B of imports since 2018 and up to 25% duties have raised landed costs for electronics, while shifts in Section 301/201 measures (eg. 25% steel/aluminum tariffs) force rapid vendor and SKU changes, so proactive sourcing diversification reduces exposure.
Export controls
EAR and ITAR restrictions on advanced semiconductors and high-end networking gear narrow D&H Distributing’s catalog for certain end markets, forcing substitution or white-listing of compliant SKUs.
Frequent Entity List additions and new license requirements can delay fulfillment to affected VARs and integrators pending BIS or State approvals.
Increased screening, recordkeeping, and end-use documentation raise operational overhead and compliance staffing needs.
Ongoing partner education reduces accidental breaches and supports faster order flows to compliant channels.

Government IT spending
Federal, state and municipal tech budgets—US federal IT near $97B in FY2024 while state/local combined roughly $130B—drive demand for infrastructure, cybersecurity and end‑user devices. Election cycles and appropriations timing create periodic surges and pauses in procurement. Public sector procurement rules favor compliant, contract‑ready distributors. Aligning with cooperative purchasing vehicles accelerates wins.

Geopolitical supply shocks
Geopolitical shocks in East Asia or Europe can sever component availability and transit lanes, as seen when the 2021 Suez blockage cost global trade an estimated 6–10 billion USD per day and container rates (Shanghai–LA) briefly hit ~20,000 USD/FEU; export bans and sanctions since 2022 have repeatedly disrupted OEM production, forcing doubled lead times, buffer stock and dynamic allocation while transparent ETA updates preserve partner trust.
- Tensions → transit/component disruption
- Sanctions/export bans → OEM production ripple
- Lead-time volatility → buffer stock + flexible allocation
- Transparent ETA → preserves partner trust
Incentives and reshoring
CHIPS and allied incentives, including the US CHIPS and Science Act that authorized 52 billion USD, are accelerating shifts of manufacturing footprints nearer to North America, with over 100 billion USD in private semiconductor investments announced since 2021; more regional capacity can shorten cycles and cut lead-time volatility by ~20–30% (McKinsey) but transition timing varies across product lines.
- Reshoring impact: regional fabs → shorter cycles, lower disruption risk
- Allocation risk: early vendor collaboration needed to secure capacity
- Uneven transition: expect staggered availability by product family
Tariffs on 360–370B USD, CHIPS and public IT spend reshape supply chains
USMCA secures N.A. flows but China tariffs on ~360–370B USD of imports and shifting Section 301 measures raise landed costs and force rapid SKU/vendor changes.
EAR/ITAR and Entity List actions since 2022 narrow available catalog and add licensing delays and compliance headcount; federal IT spend ~97B USD (FY2024) and state/local ~130B USD drive demand.
CHIPS Act 52B USD plus >100B USD private semiconductor investments since 2021 should cut lead times ~20–30% over time but transition is uneven.
| Factor | Key Data |
|---|---|
| Tariffs | 360–370B USD affected |
| Public IT Spend | 97B (federal) /130B (state+local) |
| CHIPS | 52B public + >100B private |
What is included in the product
 Detailed Word Document
Explores how macro-environmental factors uniquely affect D&H Distributing across Political, Economic, Social, Technological, Environmental, and Legal dimensions, with data-backed trends and forward-looking insights tailored to its industry and region to support executives, investors, and scenario planning.

 Customizable Excel Spreadsheet
Clean, visually segmented PESTLE summary of D&H Distributing that streamlines meeting prep and quickens strategic decisions by highlighting external risks and opportunities at a glance. Easily shared, editable for region- or line-specific notes, and formatted for direct inclusion in presentations or consultant reports.
Economic factors

Demand cyclicality
Demand cyclicality: IT and consumer electronics spending closely track GDP, capex cycles and consumer confidence; global IT spending topped over $5 trillion in 2024 per Gartner. Slowdowns compress volumes and force discounting, while upcycles strain supply chains and logistics. D&H must balance inventory turns with service levels to protect margins. Flexible credit terms helped sustain partner activity during 2023–24 volatility.
Inflation and costs
Freight, warehousing, and labor inflation pressure margins—CBRE reported US industrial rent growth 6.5% with 4.9% vacancy in 2024 while BLS average hourly earnings rose about 4.1% y/y in 2024.
OEM price lists and promo funds often lag cost spikes, squeezing gross margins.
Dynamic pricing and fuel/surcharge strategies help preserve unit economics, and process efficiencies (automation, route optimization) offset opex creep.

Interest rates and credit
Higher rates raise working capital costs and partner financing burdens; the Fed funds rate stood at 5.25–5.50% and the US prime rate at 8.50% as of June 2025. VAR solvency risk elevates as receivables age beyond terms, increasing liquidity pressure. Tighter credit policies and trade‑credit insurance reduce bad‑debt exposure, while selective vendor financing can still catalyze deal flow.

Currency exposure (USD/CAD)
Cross-border operations expose D&H to USD/CAD volatility—USD/CAD averaged about 1.34 in 2024 and was near 1.32 mid-2025—pressuring CAD sales while purchases remain USD-denominated. Active hedging programs reduce gross-margin swings, though OEM transfer-pricing often lags FX shifts, creating short-term margin compression. Clear pass-through pricing policies preserve channel relationships and limit margin erosion.
- FX volatility: USD/CAD ~1.34 (2024), ~1.32 (mid-2025)
- Hedging: smooths gross-margin variability
- OEM lag: transfer-pricing can delay adjustments
- Pricing policy: pass-through protects channels
Logistics capacity
Port congestion and parcel/carrier constraints continue to strain D&H Distributing SLAs, with US e-commerce parcel volume rising about 3.5% in 2024 tightening capacity and transit windows. Peak seasons pushed spot rates roughly 20–30% higher and detention fees commonly reaching $75–125/day, increasing expediting spend. Multi‑carrier strategies and regional DCs improved resilience, while accurate forecasting has been shown to cut expedited shipping costs by around 20%.
- Impact on SLAs: 3.5% parcel volume growth (2024)
- Peak cost shock: spot rates +20–30%, detention $75–125/day
- Mitigation: multi‑carrier + regional DCs; forecasting → ~20% fewer expediting costs
Tariffs on 360–370B USD, CHIPS and public IT spend reshape supply chains
Economic factors: demand cyclicality ties IT spend to GDP—global IT spend > $5T (2024); freight/warehousing/labor inflation (industrial rent +6.5% 2024; avg hourly earnings +4.1%) press margins; rates (Fed 5.25–5.50%, prime 8.50% mid‑2025) raise working capital costs; USD/CAD ~1.34 (2024) ~1.32 (mid‑2025) adds FX risk, hedging mitigates swings.
| Metric | Value |
|---|---|
| Global IT spend | > $5T (2024) |
| Industrial rent growth | +6.5% (2024) |
| Avg hourly earnings | +4.1% y/y (2024) |
| Fed funds / Prime | 5.25–5.50% / 8.50% (mid‑2025) |
| USD/CAD | ~1.34 (2024); ~1.32 (mid‑2025) |
What You See Is What You Get
D&H Distributing PESTLE Analysis
The preview shown here is the exact, fully formatted D&H Distributing PESTLE Analysis you’ll receive after purchase. It contains the same structure, insights, and visuals as the downloadable file—no placeholders or edits. After checkout you’ll instantly get this ready-to-use document.

Original: $10.00
-65%$10.00
$3.50Product Information
Product Information
Shipping & Returns
Shipping & Returns
Description
Plan Smarter. Present Sharper. Compete Stronger.
Unlock how political shifts, economic cycles, and tech advances are reshaping D&H Distributing with our concise PESTLE snapshot. Use these insights to anticipate risk and spot growth opportunities for investors and strategists. Purchase the full PESTLE now for the complete, actionable analysis.
Political factors
Trade policy and tariffs
USMCA (in force July 1, 2020) underpins US–Canada flows but renegotiation could change duties and rules of origin; China tariffs covering roughly $360–370B of imports since 2018 and up to 25% duties have raised landed costs for electronics, while shifts in Section 301/201 measures (eg. 25% steel/aluminum tariffs) force rapid vendor and SKU changes, so proactive sourcing diversification reduces exposure.
Export controls
EAR and ITAR restrictions on advanced semiconductors and high-end networking gear narrow D&H Distributing’s catalog for certain end markets, forcing substitution or white-listing of compliant SKUs.
Frequent Entity List additions and new license requirements can delay fulfillment to affected VARs and integrators pending BIS or State approvals.
Increased screening, recordkeeping, and end-use documentation raise operational overhead and compliance staffing needs.
Ongoing partner education reduces accidental breaches and supports faster order flows to compliant channels.
Government IT spending
Federal, state and municipal tech budgets—US federal IT near $97B in FY2024 while state/local combined roughly $130B—drive demand for infrastructure, cybersecurity and end‑user devices. Election cycles and appropriations timing create periodic surges and pauses in procurement. Public sector procurement rules favor compliant, contract‑ready distributors. Aligning with cooperative purchasing vehicles accelerates wins.
Geopolitical supply shocks
Geopolitical shocks in East Asia or Europe can sever component availability and transit lanes, as seen when the 2021 Suez blockage cost global trade an estimated 6–10 billion USD per day and container rates (Shanghai–LA) briefly hit ~20,000 USD/FEU; export bans and sanctions since 2022 have repeatedly disrupted OEM production, forcing doubled lead times, buffer stock and dynamic allocation while transparent ETA updates preserve partner trust.
- Tensions → transit/component disruption
- Sanctions/export bans → OEM production ripple
- Lead-time volatility → buffer stock + flexible allocation
- Transparent ETA → preserves partner trust
Incentives and reshoring
CHIPS and allied incentives, including the US CHIPS and Science Act that authorized 52 billion USD, are accelerating shifts of manufacturing footprints nearer to North America, with over 100 billion USD in private semiconductor investments announced since 2021; more regional capacity can shorten cycles and cut lead-time volatility by ~20–30% (McKinsey) but transition timing varies across product lines.
- Reshoring impact: regional fabs → shorter cycles, lower disruption risk
- Allocation risk: early vendor collaboration needed to secure capacity
- Uneven transition: expect staggered availability by product family
Tariffs on 360–370B USD, CHIPS and public IT spend reshape supply chains
USMCA secures N.A. flows but China tariffs on ~360–370B USD of imports and shifting Section 301 measures raise landed costs and force rapid SKU/vendor changes.
EAR/ITAR and Entity List actions since 2022 narrow available catalog and add licensing delays and compliance headcount; federal IT spend ~97B USD (FY2024) and state/local ~130B USD drive demand.
CHIPS Act 52B USD plus >100B USD private semiconductor investments since 2021 should cut lead times ~20–30% over time but transition is uneven.
| Factor | Key Data |
|---|---|
| Tariffs | 360–370B USD affected |
| Public IT Spend | 97B (federal) /130B (state+local) |
| CHIPS | 52B public + >100B private |
What is included in the product
Detailed Word Document
Explores how macro-environmental factors uniquely affect D&H Distributing across Political, Economic, Social, Technological, Environmental, and Legal dimensions, with data-backed trends and forward-looking insights tailored to its industry and region to support executives, investors, and scenario planning.
Customizable Excel Spreadsheet
Clean, visually segmented PESTLE summary of D&H Distributing that streamlines meeting prep and quickens strategic decisions by highlighting external risks and opportunities at a glance. Easily shared, editable for region- or line-specific notes, and formatted for direct inclusion in presentations or consultant reports.
Economic factors
Demand cyclicality
Demand cyclicality: IT and consumer electronics spending closely track GDP, capex cycles and consumer confidence; global IT spending topped over $5 trillion in 2024 per Gartner. Slowdowns compress volumes and force discounting, while upcycles strain supply chains and logistics. D&H must balance inventory turns with service levels to protect margins. Flexible credit terms helped sustain partner activity during 2023–24 volatility.
Inflation and costs
Freight, warehousing, and labor inflation pressure margins—CBRE reported US industrial rent growth 6.5% with 4.9% vacancy in 2024 while BLS average hourly earnings rose about 4.1% y/y in 2024.
OEM price lists and promo funds often lag cost spikes, squeezing gross margins.
Dynamic pricing and fuel/surcharge strategies help preserve unit economics, and process efficiencies (automation, route optimization) offset opex creep.
Interest rates and credit
Higher rates raise working capital costs and partner financing burdens; the Fed funds rate stood at 5.25–5.50% and the US prime rate at 8.50% as of June 2025. VAR solvency risk elevates as receivables age beyond terms, increasing liquidity pressure. Tighter credit policies and trade‑credit insurance reduce bad‑debt exposure, while selective vendor financing can still catalyze deal flow.
Currency exposure (USD/CAD)
Cross-border operations expose D&H to USD/CAD volatility—USD/CAD averaged about 1.34 in 2024 and was near 1.32 mid-2025—pressuring CAD sales while purchases remain USD-denominated. Active hedging programs reduce gross-margin swings, though OEM transfer-pricing often lags FX shifts, creating short-term margin compression. Clear pass-through pricing policies preserve channel relationships and limit margin erosion.
- FX volatility: USD/CAD ~1.34 (2024), ~1.32 (mid-2025)
- Hedging: smooths gross-margin variability
- OEM lag: transfer-pricing can delay adjustments
- Pricing policy: pass-through protects channels
Logistics capacity
Port congestion and parcel/carrier constraints continue to strain D&H Distributing SLAs, with US e-commerce parcel volume rising about 3.5% in 2024 tightening capacity and transit windows. Peak seasons pushed spot rates roughly 20–30% higher and detention fees commonly reaching $75–125/day, increasing expediting spend. Multi‑carrier strategies and regional DCs improved resilience, while accurate forecasting has been shown to cut expedited shipping costs by around 20%.
- Impact on SLAs: 3.5% parcel volume growth (2024)
- Peak cost shock: spot rates +20–30%, detention $75–125/day
- Mitigation: multi‑carrier + regional DCs; forecasting → ~20% fewer expediting costs
Tariffs on 360–370B USD, CHIPS and public IT spend reshape supply chains
Economic factors: demand cyclicality ties IT spend to GDP—global IT spend > $5T (2024); freight/warehousing/labor inflation (industrial rent +6.5% 2024; avg hourly earnings +4.1%) press margins; rates (Fed 5.25–5.50%, prime 8.50% mid‑2025) raise working capital costs; USD/CAD ~1.34 (2024) ~1.32 (mid‑2025) adds FX risk, hedging mitigates swings.
| Metric | Value |
|---|---|
| Global IT spend | > $5T (2024) |
| Industrial rent growth | +6.5% (2024) |
| Avg hourly earnings | +4.1% y/y (2024) |
| Fed funds / Prime | 5.25–5.50% / 8.50% (mid‑2025) |
| USD/CAD | ~1.34 (2024); ~1.32 (mid‑2025) |
What You See Is What You Get
D&H Distributing PESTLE Analysis
The preview shown here is the exact, fully formatted D&H Distributing PESTLE Analysis you’ll receive after purchase. It contains the same structure, insights, and visuals as the downloadable file—no placeholders or edits. After checkout you’ll instantly get this ready-to-use document.











