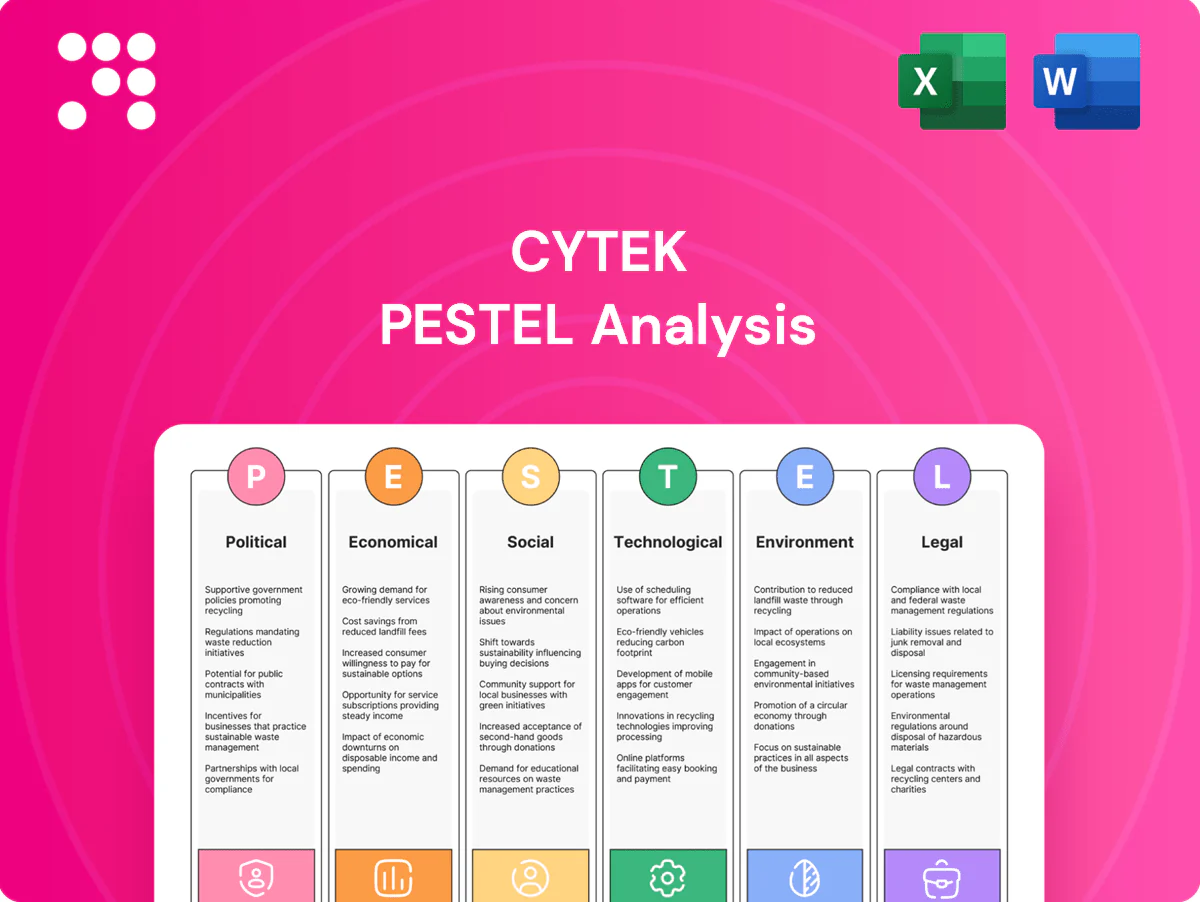
Cytek PESTLE Analysis

Skip the Research. Get the Strategy.
Discover how political, economic, and technological forces shape Cytek’s strategic trajectory in our concise PESTLE Analysis. Ideal for investors and strategists, it highlights immediate risks and actionable growth levers. Buy the full report for a complete, editable breakdown and instant download.
Political factors

Public research funding flows
Government science budgets drive demand for cytometry: NIH funding of about $48 billion (FY2024) and Horizon Europe’s €95.5 billion (2021–27) directly support purchases of instruments and reagents. Priority shifts to immunology, oncology and infectious disease expand Cytek’s addressable pipeline. Budget tightening or delayed appropriations lengthen sales cycles, while multi-year grants give revenue visibility but intensify competition for awarded labs.
Trade policy and export controls
US export controls and tightened restrictions on advanced bioscience tools (expanded by BIS since 2022) plus evolving US-China tech policies can delay Cytek shipments and require export licenses; Section 301 tariffs up to 25% and average applied tariffs raise input costs and pricing complexity. Local content rules in China/EU push assembly/partners; multi-jurisdictional compliance can add 1–3% of revenue in overhead.

Healthcare and biopharma priorities
Government-backed precision medicine and cell/gene therapy programs are accelerating demand for high-parameter cell analysis, supported by NIH FY2024 funding of roughly $49 billion and more than 20 FDA-approved cell/gene therapies by 2024, which expand clinical use cases.
Public procurement can open clinical channels but typically mandates device certification and local partnerships; sustained biodefense and pandemic-preparedness budgets (eg BARDA/EU programs) keep immune-monitoring demand elevated, while policy shifts can reallocate funding from discovery to primary care, reducing R&D spend.

International standards and diplomacy
Harmonization of laboratory standards and mutual recognition agreements ease Cytek market entry by reducing duplicate validations across borders; consortia-led standards (Human Cell Atlas has over 4,000 contributors as of 2024) help shape FSP-compatible specs. Diplomatic tensions can disrupt collaborations and cross-border data sharing, while national innovation agendas increasingly offer incentives for local manufacturing.
- mutual recognition reduces redundant approvals
- consortia influence technical specs (HCA >4,000 contributors, 2024)
- geopolitical risk threatens academic data flows
- national incentives boost local production
Supply chain resilience mandates
Policies encouraging domestic manufacturing of critical scientific equipment may push Cytek to regionalize production; U.S. CHIPS Act (authorized $52 billion) and similar national incentives increase available grants/credits to offset capex. Sourcing rules can limit supplier options and raise costs. Strategic stockpiles and government contracts offer demand stability but carry strict SLAs and penalties.
- Domestic incentives: CHIPS $52B
- Capex offset: grants/credits available
- Supplier constraint: sourcing compliance
- Demand: govt contracts with strict SLAs
R&D funding and CHIPS incentives regionalize production; export controls slow cell/gene sales cycles
Government R&D budgets (NIH ~$48B FY2024; Horizon Europe €95.5B 2021–27) and CHIPS $52B incentives raise demand and regionalize production while US export controls, tariffs up to 25% and geopolitical tensions complicate trade and lengthen sales cycles. >20 FDA cell/gene therapies and HCA >4,000 contributors expand clinical markets.
| Metric | Value |
|---|---|
| NIH FY2024 | $48B |
| Horizon Europe | €95.5B |
| CHIPS | $52B |
| FDA cell/gene therapies | >20 |
What is included in the product
 Detailed Word Document
Explores how external macro-environmental factors uniquely affect the Cytek across six dimensions—Political, Economic, Social, Technological, Environmental, and Legal—backed by current data and trends to highlight specific threats and opportunities. Designed for executives, consultants, and investors, it reflects regional market and regulatory dynamics and offers forward-looking insights ready for business plans and decks.

 Customizable Excel Spreadsheet
Delivers a concise, visually segmented Cytek PESTLE summary that relieves meeting-prep pain by enabling quick interpretation, easy annotation for local context, and seamless insertion into presentations or strategy packs.
Economic factors

Capex cycles in academia and pharma
Instrument purchases hinge on lab budget cycles and pharma R&D allocations, with industry R&D spending topping $200 billion annually by 2023. Strong biotech financing and renewed M&A in 2024 lifted demand for high-end analyzers. Economic slowdowns prompt capex deferrals, shifting revenue toward services and consumables. Leasing and reagent-rental models increasingly smooth this volatility.
Currency and inflation pressures
Multi-currency pricing exposes Cytek margins to FX swings as USD strength versus major currencies increases reported COGS volatility. Inflationary pressure in optics, semiconductors and specialty reagents has materially elevated input costs, compressing gross margins. Passing costs to customers risks demand elasticity in price-sensitive segments. Active hedging and localized sourcing supply chains can mitigate these impacts.

Cost of capital and investor sentiment
Interest rates (US federal funds 5.25–5.50% through much of 2024) raise leasing and internal R&D/inventory costs, reducing affordability. Equity market strain—biotech VC funding dropped roughly 30% from 2021 peaks by 2023–24—curtails fundraising for Cytek and customers. Tighter capital markets compress sales pipelines and lengthen approvals; rate cuts typically revive long-cycle instrument demand.

Competitive intensity and pricing
Large incumbents and niche innovators pressure Cytek on pricing and feature roadmaps, forcing faster releases and promotional pricing; bundled instruments plus service contracts defend share but compress gross margins. Differentiation through FSP data quality and workflow efficiency supports premium pricing; the global flow cytometry market is projected to grow at about 9% CAGR to 2028, though downturns drive tendering and deeper discounts.
- Competitive pressure: incumbents vs innovators
- Bundles/contracts: share protection, margin squeeze
- FSP quality/workflow: premium positioning
- Downturns: more tenders, higher discounting
Emerging market growth
Expanding research infrastructure across Asia-Pacific, the Middle East and LATAM is driving volume growth for Cytek as emerging markets account for roughly 60% of global GDP (PPP), increasing demand for flow cytometry in immunology and infectious disease research.
Public health initiatives and pandemic preparedness funding have boosted regional research spend, while affordability constraints favor tiered products and financing; local distributors and service networks are critical to capture and support this demand.
- EM share ~60% global GDP (PPP)
- Tiered pricing and leasing increase accessibility
- Local distribution/service networks essential
R&D funding and CHIPS incentives regionalize production; export controls slow cell/gene sales cycles
Instrument demand tied to lab R&D cycles (global pharma/biotech R&D >$200B in 2023) with 9% CAGR market tailwind to 2028, yet recessions push capex to services. USD strength, semiconductor/optics inflation and supply-chain costs compress margins; hedging and local sourcing mitigate. Higher rates (Fed 5.25–5.50% in 2024) and ~30% drop in biotech VC vs 2021 tighten pipelines and lengthen sales cycles.
| Metric | Value |
|---|---|
| Global pharma/biotech R&D | >$200B (2023) |
| Flow cytometry market CAGR | ~9% to 2028 |
| Fed funds | 5.25–5.50% (2024) |
| Biotech VC | ≈-30% vs 2021 |
Preview the Actual Deliverable
Cytek PESTLE Analysis
The Cytek PESTLE Analysis preview shown here is the exact document you’ll receive after purchase—fully formatted, professionally structured, and ready to use. The content, layout, and insights are identical to the downloadable file, with no placeholders or teasers. After checkout you’ll instantly get this same finished report, ready for analysis and decision-making.

Product Information
Product Information
Shipping & Returns
Shipping & Returns
Description
Skip the Research. Get the Strategy.
Discover how political, economic, and technological forces shape Cytek’s strategic trajectory in our concise PESTLE Analysis. Ideal for investors and strategists, it highlights immediate risks and actionable growth levers. Buy the full report for a complete, editable breakdown and instant download.
Political factors
Public research funding flows
Government science budgets drive demand for cytometry: NIH funding of about $48 billion (FY2024) and Horizon Europe’s €95.5 billion (2021–27) directly support purchases of instruments and reagents. Priority shifts to immunology, oncology and infectious disease expand Cytek’s addressable pipeline. Budget tightening or delayed appropriations lengthen sales cycles, while multi-year grants give revenue visibility but intensify competition for awarded labs.
Trade policy and export controls
US export controls and tightened restrictions on advanced bioscience tools (expanded by BIS since 2022) plus evolving US-China tech policies can delay Cytek shipments and require export licenses; Section 301 tariffs up to 25% and average applied tariffs raise input costs and pricing complexity. Local content rules in China/EU push assembly/partners; multi-jurisdictional compliance can add 1–3% of revenue in overhead.
Healthcare and biopharma priorities
Government-backed precision medicine and cell/gene therapy programs are accelerating demand for high-parameter cell analysis, supported by NIH FY2024 funding of roughly $49 billion and more than 20 FDA-approved cell/gene therapies by 2024, which expand clinical use cases.
Public procurement can open clinical channels but typically mandates device certification and local partnerships; sustained biodefense and pandemic-preparedness budgets (eg BARDA/EU programs) keep immune-monitoring demand elevated, while policy shifts can reallocate funding from discovery to primary care, reducing R&D spend.
International standards and diplomacy
Harmonization of laboratory standards and mutual recognition agreements ease Cytek market entry by reducing duplicate validations across borders; consortia-led standards (Human Cell Atlas has over 4,000 contributors as of 2024) help shape FSP-compatible specs. Diplomatic tensions can disrupt collaborations and cross-border data sharing, while national innovation agendas increasingly offer incentives for local manufacturing.
- mutual recognition reduces redundant approvals
- consortia influence technical specs (HCA >4,000 contributors, 2024)
- geopolitical risk threatens academic data flows
- national incentives boost local production
Supply chain resilience mandates
Policies encouraging domestic manufacturing of critical scientific equipment may push Cytek to regionalize production; U.S. CHIPS Act (authorized $52 billion) and similar national incentives increase available grants/credits to offset capex. Sourcing rules can limit supplier options and raise costs. Strategic stockpiles and government contracts offer demand stability but carry strict SLAs and penalties.
- Domestic incentives: CHIPS $52B
- Capex offset: grants/credits available
- Supplier constraint: sourcing compliance
- Demand: govt contracts with strict SLAs
R&D funding and CHIPS incentives regionalize production; export controls slow cell/gene sales cycles
Government R&D budgets (NIH ~$48B FY2024; Horizon Europe €95.5B 2021–27) and CHIPS $52B incentives raise demand and regionalize production while US export controls, tariffs up to 25% and geopolitical tensions complicate trade and lengthen sales cycles. >20 FDA cell/gene therapies and HCA >4,000 contributors expand clinical markets.
| Metric | Value |
|---|---|
| NIH FY2024 | $48B |
| Horizon Europe | €95.5B |
| CHIPS | $52B |
| FDA cell/gene therapies | >20 |
What is included in the product
Detailed Word Document
Explores how external macro-environmental factors uniquely affect the Cytek across six dimensions—Political, Economic, Social, Technological, Environmental, and Legal—backed by current data and trends to highlight specific threats and opportunities. Designed for executives, consultants, and investors, it reflects regional market and regulatory dynamics and offers forward-looking insights ready for business plans and decks.
Customizable Excel Spreadsheet
Delivers a concise, visually segmented Cytek PESTLE summary that relieves meeting-prep pain by enabling quick interpretation, easy annotation for local context, and seamless insertion into presentations or strategy packs.
Economic factors
Capex cycles in academia and pharma
Instrument purchases hinge on lab budget cycles and pharma R&D allocations, with industry R&D spending topping $200 billion annually by 2023. Strong biotech financing and renewed M&A in 2024 lifted demand for high-end analyzers. Economic slowdowns prompt capex deferrals, shifting revenue toward services and consumables. Leasing and reagent-rental models increasingly smooth this volatility.
Currency and inflation pressures
Multi-currency pricing exposes Cytek margins to FX swings as USD strength versus major currencies increases reported COGS volatility. Inflationary pressure in optics, semiconductors and specialty reagents has materially elevated input costs, compressing gross margins. Passing costs to customers risks demand elasticity in price-sensitive segments. Active hedging and localized sourcing supply chains can mitigate these impacts.
Cost of capital and investor sentiment
Interest rates (US federal funds 5.25–5.50% through much of 2024) raise leasing and internal R&D/inventory costs, reducing affordability. Equity market strain—biotech VC funding dropped roughly 30% from 2021 peaks by 2023–24—curtails fundraising for Cytek and customers. Tighter capital markets compress sales pipelines and lengthen approvals; rate cuts typically revive long-cycle instrument demand.
Competitive intensity and pricing
Large incumbents and niche innovators pressure Cytek on pricing and feature roadmaps, forcing faster releases and promotional pricing; bundled instruments plus service contracts defend share but compress gross margins. Differentiation through FSP data quality and workflow efficiency supports premium pricing; the global flow cytometry market is projected to grow at about 9% CAGR to 2028, though downturns drive tendering and deeper discounts.
- Competitive pressure: incumbents vs innovators
- Bundles/contracts: share protection, margin squeeze
- FSP quality/workflow: premium positioning
- Downturns: more tenders, higher discounting
Emerging market growth
Expanding research infrastructure across Asia-Pacific, the Middle East and LATAM is driving volume growth for Cytek as emerging markets account for roughly 60% of global GDP (PPP), increasing demand for flow cytometry in immunology and infectious disease research.
Public health initiatives and pandemic preparedness funding have boosted regional research spend, while affordability constraints favor tiered products and financing; local distributors and service networks are critical to capture and support this demand.
- EM share ~60% global GDP (PPP)
- Tiered pricing and leasing increase accessibility
- Local distribution/service networks essential
R&D funding and CHIPS incentives regionalize production; export controls slow cell/gene sales cycles
Instrument demand tied to lab R&D cycles (global pharma/biotech R&D >$200B in 2023) with 9% CAGR market tailwind to 2028, yet recessions push capex to services. USD strength, semiconductor/optics inflation and supply-chain costs compress margins; hedging and local sourcing mitigate. Higher rates (Fed 5.25–5.50% in 2024) and ~30% drop in biotech VC vs 2021 tighten pipelines and lengthen sales cycles.
| Metric | Value |
|---|---|
| Global pharma/biotech R&D | >$200B (2023) |
| Flow cytometry market CAGR | ~9% to 2028 |
| Fed funds | 5.25–5.50% (2024) |
| Biotech VC | ≈-30% vs 2021 |
Preview the Actual Deliverable
Cytek PESTLE Analysis
The Cytek PESTLE Analysis preview shown here is the exact document you’ll receive after purchase—fully formatted, professionally structured, and ready to use. The content, layout, and insights are identical to the downloadable file, with no placeholders or teasers. After checkout you’ll instantly get this same finished report, ready for analysis and decision-making.











