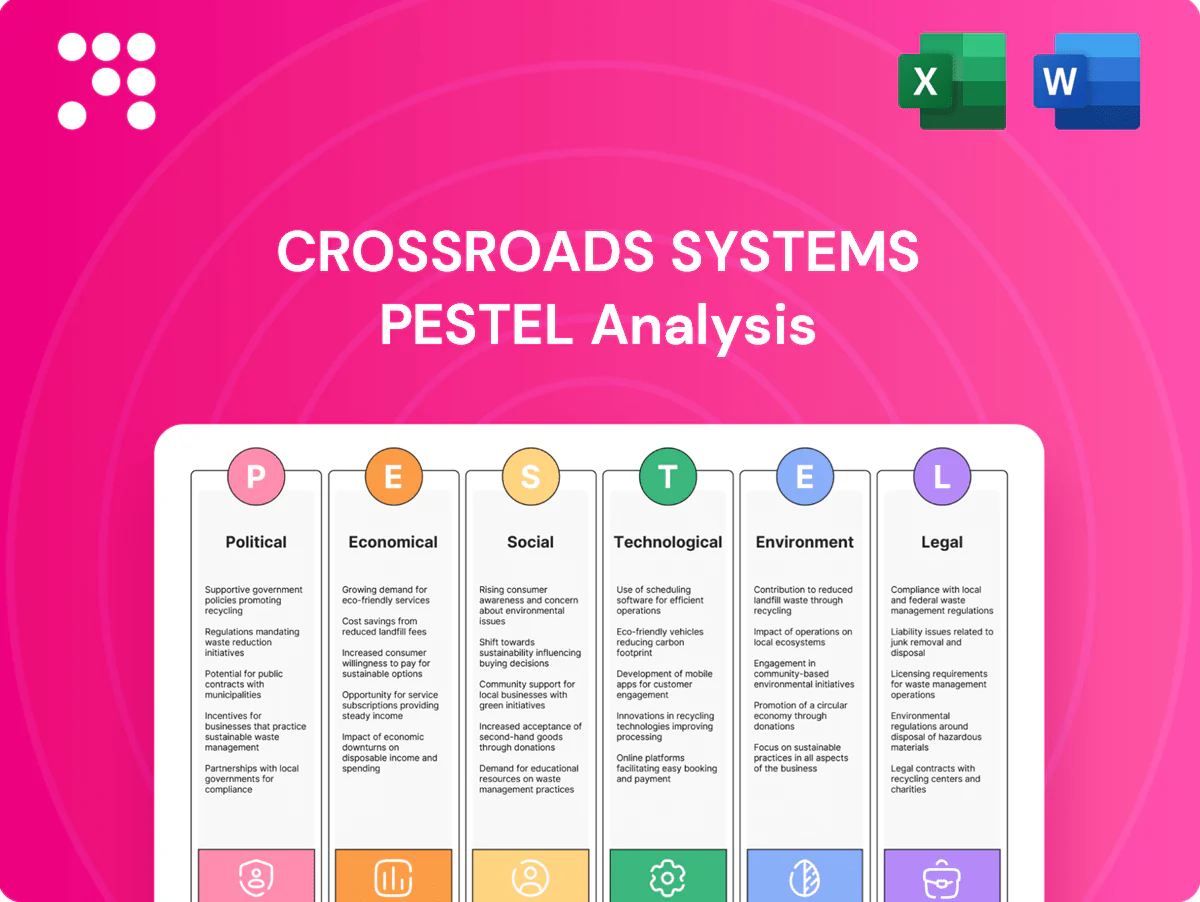
Crossroads Systems PESTLE Analysis

Your Competitive Advantage Starts with This Report
Unlock how political, economic, social, technological, legal and environmental forces are shaping Crossroads Systems’s strategic direction with our concise PESTLE snapshot. This ready-made analysis highlights risks and growth levers for investors and planners. Buy the full version for the complete, editable deep-dive and actionable recommendations.
Political factors

Industrial policy tailwinds
Government incentives—notably the US CHIPS Act’s $52.7B semiconductor fund and multi‑billion grants for advanced manufacturing—can materially boost Crossroads Systems’ portfolio growth; grants, tax credits and preferential procurement commonly lift project IRRs by several hundred basis points, but strict eligibility and local‑content rules must be tracked, and acquisitions aligned to policy priorities to strengthen pipeline quality.
Trade tensions and tariffs
Tariffs on components and equipment—notably US duties of up to 25% on roughly $370 billion of Chinese imports—inflate input costs and compress margins for hardware-heavy firms like Crossroads. Shifts in US-China and EU trade policy can abruptly disrupt established supply chains and sourcing timelines. Diversifying suppliers and nearshoring reduce exposure and cap tariff risk. Enhanced pricing power and selective pass-through become critical strategic levers.

CFIUS and foreign investment scrutiny
Deals involving sensitive technologies may trigger CFIUS review under FIRRMA (enacted 2018), potentially subjecting Crossroads Systems to national-security scrutiny. CFIUS follows statutory timelines—an initial 45-day review and a possible 45-day investigation plus a 15-day presidential action period, totaling up to 105 days—which can delay closings and affect deal value through mitigation. Early risk assessment narrows closing uncertainty. Structuring ownership and governance (e.g., minority stakes, board limits, voting trusts) can ease approval.

Infrastructure and public spending
Public investment in energy, transport and broadband—driven by the US Bipartisan Infrastructure Law (~1.2 trillion) and US BEAD broadband funding (42.45 billion)—creates sustained demand for industrial tech; contractors and OEMs in Crossroads Systems’ portfolio can secure multi‑year (3–10 year) project revenues. Bidding compliance, certifications and geographic exposure to funded corridors determine award capture and margin stability.
- Public spend scale: BIL 1.2T, BEAD 42.45B
- Project length: 3–10 years
- Critical: certifications, bid compliance
- Risk: limited geographic exposure to funded corridors
Regulatory stability and state incentives
Stable US institutions and federal policy continuity (eg, post-IRA investment flows) support long-term capital for Crossroads, but state-level shifts remain material: as of July 2025 governors split 26R/24D, altering incentive priorities. Competitive tax abatements and training subsidies drive site choice; portfolio synergies enable multi-state package negotiations.
- 50 states offer incentive programs
- 26R/24D governors (Jul 2025)
- Training grants and abatements key to footprint
- Multi-site deals boost bargaining leverage
CHIPS incentives, tariffs and CFIUS rules reshape supply chains—local content and nearshoring matter
Government incentives (CHIPS $52.7B, state packages) materially raise project IRRs but require local‑content and eligibility tracking.
Tariffs (up to 25% on ~$370B Chinese goods) and US‑China trade shifts raise input costs; nearshoring and supplier diversification mitigate risk.
CFIUS reviews (45+45+15 days, max 105) can delay deals; governance structuring reduces clearance friction.
| Item | Key figure (Jul 2025) |
|---|---|
| CHIPS | $52.7B |
| BIL | $1.2T |
| BEAD | $42.45B |
| Tariff exposure | $370B @25% |
| Governors | 26R/24D |
What is included in the product
 Detailed Word Document
Provides a data-backed PESTLE analysis of Crossroads Systems, examining Political, Economic, Social, Technological, Environmental and Legal drivers with region- and industry-specific examples, forward-looking insights, and actionable risks/opportunities to support executives, investors and strategists in planning and fundraising.

 Customizable Excel Spreadsheet
A concise, visually segmented Crossroads Systems PESTLE summary that streamlines external risk assessment and market positioning, is easily editable for local context or business lines, and can be dropped into presentations or shared across teams for fast alignment.
Economic factors

Interest rates and credit costs
Acquisition financing and working capital for Crossroads Systems are highly rate-sensitive as the US federal funds rate sits at 5.25–5.50% and the 10-year Treasury yields ~4.3% (July 2025), shrinking affordable leverage. Higher yields compress leveraged returns and valuation headroom, while hedging and flexible debt structures preserve deal capacity. Cash-flow resilience becomes a core screening priority.
M&A valuations and multiples
Industrial-tech EBITDA multiples ranged roughly 8–14x in 2024 as buyer risk appetite swung; multiple arbitrage typically requires delivering 2–4 turns of EBITDA improvement credibly through ops. Proprietary-sourced deals in 2023–24 often outperformed auctions, sometimes capturing a 1–3x premium on entry metrics, and earnouts appeared in ~25–35% of deals to align price with execution risk.

Macro growth and capex cycles
End-market capex is the primary driver of automation and equipment orders; IMF projected global GDP growth at 3.0% in 2024 and 3.2% in 2025, constraining aggregate investment. Slowdowns lengthen sales cycles and pressure backlog conversion as firms defer purchases. Scenario planning guides capacity and inventory choices. Diversification across verticals smooths cyclicality and reduces revenue volatility.

Labor markets and wage inflation
Tight skilled labor supply is raising costs and constraining throughput for Crossroads Systems; U.S. average hourly earnings rose about 4.2% in 2024 (BLS), increasing operating labor expense. Apprenticeships and upskilling programs have preserved margins by lowering external hiring spend. As wages climb, automation projects often show payback within 12–24 months. Retention programs cut recruiting churn and vacancy-driven downtime.
- Skilled labor squeeze: higher unit labor cost
- Upskilling: lowers external hire spend
- Automation ROI: 12–24 month payback as wages rise
- Retention: reduces churn and vacancy losses
Supply chain and input volatility
- Lead times ~15 weeks (2024)
- Dual-sourcing + safety stock ≈ 30% less downtime
- Commodity hedging ≈ 3 ppt margin volatility reduction (2024)
- Supplier health monitoring cuts surprise disruptions
CHIPS incentives, tariffs and CFIUS rules reshape supply chains—local content and nearshoring matter
Higher rates (fed funds 5.25–5.50%, 10y ≈4.3%, Jul 2025) shrink affordable leverage and compress valuation; cash-flow resilience and flexible debt are critical. Industrial-tech EBITDA multiples traded ~8–14x (2024); earnouts used in ~25–35% deals. Tight labor (wages +4.2% 2024) and 15-week component lead times elevate costs and slow delivery.
| Metric | Value |
|---|---|
| Fed funds | 5.25–5.50% |
| 10y Treasury | ≈4.3% |
| GDP growth (IMF) | 2025: 3.2% |
| Wage growth (US) | 2024: +4.2% |
| Lead times | ≈15 weeks |
| EBITDA multiples | 8–14x |
Same Document Delivered
Crossroads Systems PESTLE Analysis
The Crossroads Systems PESTLE Analysis examines political, economic, social, technological, legal, and environmental factors affecting the company and strategic positioning. The content and structure shown in the preview is the same document you’ll download after payment. It’s fully formatted, professional, and ready to use.

Original: $10.00
-65%$10.00
$3.50Product Information
Product Information
Shipping & Returns
Shipping & Returns
Description
Your Competitive Advantage Starts with This Report
Unlock how political, economic, social, technological, legal and environmental forces are shaping Crossroads Systems’s strategic direction with our concise PESTLE snapshot. This ready-made analysis highlights risks and growth levers for investors and planners. Buy the full version for the complete, editable deep-dive and actionable recommendations.
Political factors
Industrial policy tailwinds
Government incentives—notably the US CHIPS Act’s $52.7B semiconductor fund and multi‑billion grants for advanced manufacturing—can materially boost Crossroads Systems’ portfolio growth; grants, tax credits and preferential procurement commonly lift project IRRs by several hundred basis points, but strict eligibility and local‑content rules must be tracked, and acquisitions aligned to policy priorities to strengthen pipeline quality.
Trade tensions and tariffs
Tariffs on components and equipment—notably US duties of up to 25% on roughly $370 billion of Chinese imports—inflate input costs and compress margins for hardware-heavy firms like Crossroads. Shifts in US-China and EU trade policy can abruptly disrupt established supply chains and sourcing timelines. Diversifying suppliers and nearshoring reduce exposure and cap tariff risk. Enhanced pricing power and selective pass-through become critical strategic levers.
CFIUS and foreign investment scrutiny
Deals involving sensitive technologies may trigger CFIUS review under FIRRMA (enacted 2018), potentially subjecting Crossroads Systems to national-security scrutiny. CFIUS follows statutory timelines—an initial 45-day review and a possible 45-day investigation plus a 15-day presidential action period, totaling up to 105 days—which can delay closings and affect deal value through mitigation. Early risk assessment narrows closing uncertainty. Structuring ownership and governance (e.g., minority stakes, board limits, voting trusts) can ease approval.
Infrastructure and public spending
Public investment in energy, transport and broadband—driven by the US Bipartisan Infrastructure Law (~1.2 trillion) and US BEAD broadband funding (42.45 billion)—creates sustained demand for industrial tech; contractors and OEMs in Crossroads Systems’ portfolio can secure multi‑year (3–10 year) project revenues. Bidding compliance, certifications and geographic exposure to funded corridors determine award capture and margin stability.
- Public spend scale: BIL 1.2T, BEAD 42.45B
- Project length: 3–10 years
- Critical: certifications, bid compliance
- Risk: limited geographic exposure to funded corridors
Regulatory stability and state incentives
Stable US institutions and federal policy continuity (eg, post-IRA investment flows) support long-term capital for Crossroads, but state-level shifts remain material: as of July 2025 governors split 26R/24D, altering incentive priorities. Competitive tax abatements and training subsidies drive site choice; portfolio synergies enable multi-state package negotiations.
- 50 states offer incentive programs
- 26R/24D governors (Jul 2025)
- Training grants and abatements key to footprint
- Multi-site deals boost bargaining leverage
CHIPS incentives, tariffs and CFIUS rules reshape supply chains—local content and nearshoring matter
Government incentives (CHIPS $52.7B, state packages) materially raise project IRRs but require local‑content and eligibility tracking.
Tariffs (up to 25% on ~$370B Chinese goods) and US‑China trade shifts raise input costs; nearshoring and supplier diversification mitigate risk.
CFIUS reviews (45+45+15 days, max 105) can delay deals; governance structuring reduces clearance friction.
| Item | Key figure (Jul 2025) |
|---|---|
| CHIPS | $52.7B |
| BIL | $1.2T |
| BEAD | $42.45B |
| Tariff exposure | $370B @25% |
| Governors | 26R/24D |
What is included in the product
Detailed Word Document
Provides a data-backed PESTLE analysis of Crossroads Systems, examining Political, Economic, Social, Technological, Environmental and Legal drivers with region- and industry-specific examples, forward-looking insights, and actionable risks/opportunities to support executives, investors and strategists in planning and fundraising.
Customizable Excel Spreadsheet
A concise, visually segmented Crossroads Systems PESTLE summary that streamlines external risk assessment and market positioning, is easily editable for local context or business lines, and can be dropped into presentations or shared across teams for fast alignment.
Economic factors
Interest rates and credit costs
Acquisition financing and working capital for Crossroads Systems are highly rate-sensitive as the US federal funds rate sits at 5.25–5.50% and the 10-year Treasury yields ~4.3% (July 2025), shrinking affordable leverage. Higher yields compress leveraged returns and valuation headroom, while hedging and flexible debt structures preserve deal capacity. Cash-flow resilience becomes a core screening priority.
M&A valuations and multiples
Industrial-tech EBITDA multiples ranged roughly 8–14x in 2024 as buyer risk appetite swung; multiple arbitrage typically requires delivering 2–4 turns of EBITDA improvement credibly through ops. Proprietary-sourced deals in 2023–24 often outperformed auctions, sometimes capturing a 1–3x premium on entry metrics, and earnouts appeared in ~25–35% of deals to align price with execution risk.
Macro growth and capex cycles
End-market capex is the primary driver of automation and equipment orders; IMF projected global GDP growth at 3.0% in 2024 and 3.2% in 2025, constraining aggregate investment. Slowdowns lengthen sales cycles and pressure backlog conversion as firms defer purchases. Scenario planning guides capacity and inventory choices. Diversification across verticals smooths cyclicality and reduces revenue volatility.
Labor markets and wage inflation
Tight skilled labor supply is raising costs and constraining throughput for Crossroads Systems; U.S. average hourly earnings rose about 4.2% in 2024 (BLS), increasing operating labor expense. Apprenticeships and upskilling programs have preserved margins by lowering external hiring spend. As wages climb, automation projects often show payback within 12–24 months. Retention programs cut recruiting churn and vacancy-driven downtime.
- Skilled labor squeeze: higher unit labor cost
- Upskilling: lowers external hire spend
- Automation ROI: 12–24 month payback as wages rise
- Retention: reduces churn and vacancy losses
Supply chain and input volatility
- Lead times ~15 weeks (2024)
- Dual-sourcing + safety stock ≈ 30% less downtime
- Commodity hedging ≈ 3 ppt margin volatility reduction (2024)
- Supplier health monitoring cuts surprise disruptions
CHIPS incentives, tariffs and CFIUS rules reshape supply chains—local content and nearshoring matter
Higher rates (fed funds 5.25–5.50%, 10y ≈4.3%, Jul 2025) shrink affordable leverage and compress valuation; cash-flow resilience and flexible debt are critical. Industrial-tech EBITDA multiples traded ~8–14x (2024); earnouts used in ~25–35% deals. Tight labor (wages +4.2% 2024) and 15-week component lead times elevate costs and slow delivery.
| Metric | Value |
|---|---|
| Fed funds | 5.25–5.50% |
| 10y Treasury | ≈4.3% |
| GDP growth (IMF) | 2025: 3.2% |
| Wage growth (US) | 2024: +4.2% |
| Lead times | ≈15 weeks |
| EBITDA multiples | 8–14x |
Same Document Delivered
Crossroads Systems PESTLE Analysis
The Crossroads Systems PESTLE Analysis examines political, economic, social, technological, legal, and environmental factors affecting the company and strategic positioning. The content and structure shown in the preview is the same document you’ll download after payment. It’s fully formatted, professional, and ready to use.











