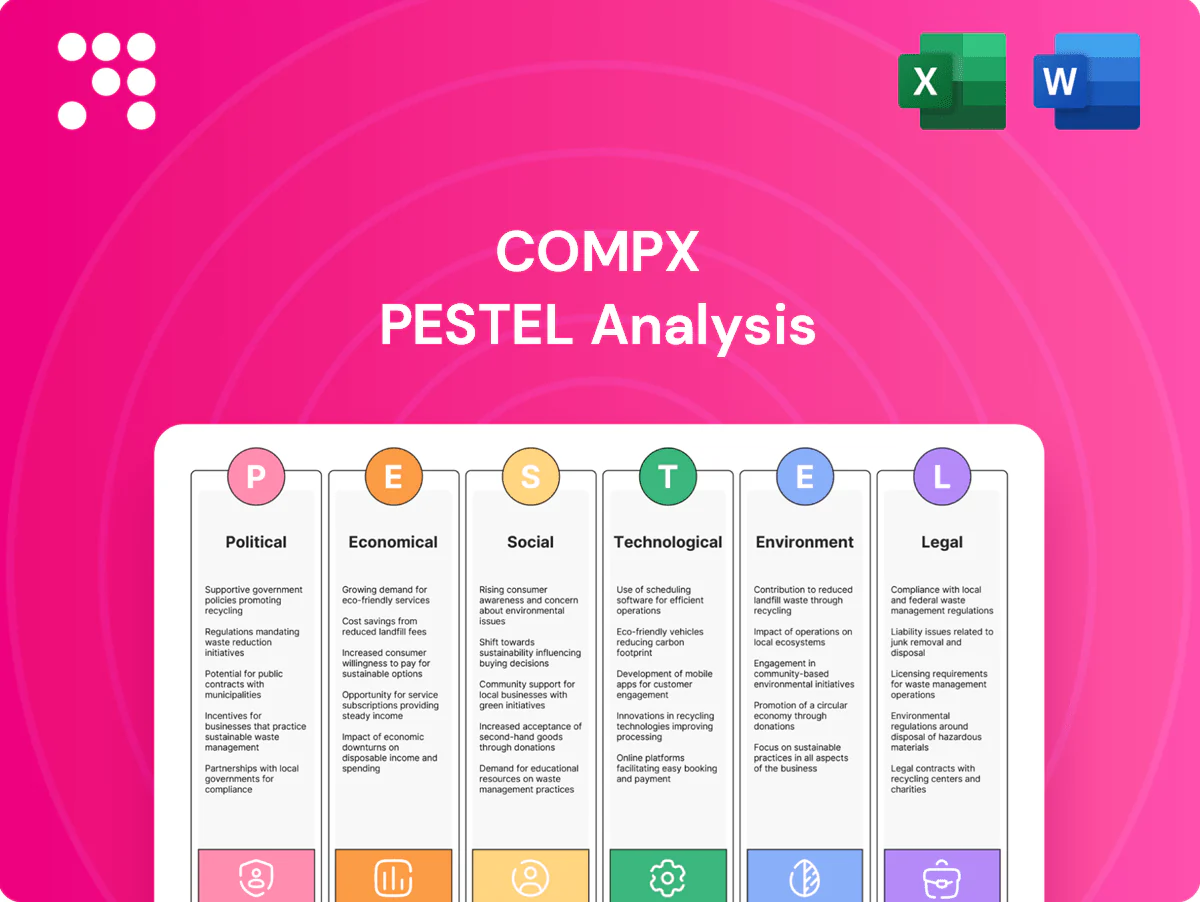
CompX PESTLE Analysis

Your Competitive Advantage Starts with This Report
Unlock how political, economic, social, technological, legal, and environmental forces are shaping CompX’s trajectory with our concise PESTLE snapshot—then dive deeper with the full analysis. Ideal for investors and strategists, the complete report delivers actionable insights and ready-to-use charts; purchase now to get instant, editable access.
Political factors

Trade policy and tariffs
Import duties—eg US Section 301 tariffs of up to 25% on roughly $300B of Chinese goods and US Section 232 steel/aluminum levies (25%/10%)—can lift CompX input costs and squeeze margins; supply-chain shifts in US-China/EU relations push re‑sourcing for locks and marine parts. Preferential trade pacts (eg CPTPP expansion) may cut landed costs and open OEM channels; CompX should diversify suppliers and apply tariff engineering where feasible.
Government procurement priorities
Public-sector demand for secure cabinetry and access control rises with infrastructure and facility modernization bills such as the Bipartisan Infrastructure Law (roughly $1.2 trillion total, ~$550 billion in new investments). Buy American provisions and tightened domestic-content rules increasingly favor companies with U.S. manufacturing footprints. Federal procurement obligations were about $682 billion in 2023, so budget cycles and election outcomes materially shift timing and scale of orders. Clear positioning on compliance and domestic content boosts win rates for federal tenders.

Maritime and boating policies
Federal and state recreational boating incentives and marina infrastructure grants have expanded support for OEM boat production by improving access to slips and shore power, while targeted navigation investments have reduced transit times and boosted new-boat demand.
Conversely, new restrictions or increased waterway fees in some jurisdictions have damped usage and aftermarket parts sales, and Coast Guard safety initiatives are tightening equipment and certification requirements for manufacturers.
Monitoring state-level boating rules and grant programs through 2024–2025 helps CompX align product features, compliance testing and certifications to capture incentive-driven OEM and retrofit opportunities.

Industrial and cybersecurity directives
Critical infrastructure security standards (CISA-defined 16 sectors) and Executive Order 14028 drive federal expectations; NIST frameworks and IoT guidance (NISTIR series) are increasingly referenced and can cascade to commercial cabinets and access systems, making early alignment a commercial differentiator and lowering future retrofit friction.
- NIST alignment: procurement edge
- EO 14028: federal momentum
- CISA 16 sectors: scope impact
- Early compliance: reduces retrofit/sales delays
Labor and manufacturing policy
IRA and CHIPS (about $369B in clean-energy tax credits and $52B for semiconductors) plus WIOA funding (~$3.3B FY2024) bolster US manufacturing; training subsidies and tax credits lower CapEx and hiring costs. Federal minimum wage remains $7.25 but state hikes and overtime rule changes squeeze margins. H-1B cap 85,000 limits specialized technicians; locating in TX or GA can optimize incentives and logistics.
- Subsidies: IRA/CHIPS/WIOA
- Wage pressure: $7.25 federal + state hikes
- Immigration: H-1B 85,000 cap
- Location: TX/GA incentives, logistics
Tariffs, infrastructure and subsidies drive re-shoring and demand for US-made access hardware
Tariffs (eg Section 301/232) and US-China/EU tension raise input costs and drive re‑shoring of locks/marine parts.
Federal procurement (~$682B in 2023) and infrastructure bills (~$1.2T, ~$550B new) boost demand for domestic-made access/security products.
IRA/CHIPS (≈$369B/$52B) plus WIOA ~$3.3B lower CapEx and hiring costs; Buy American rules favor US plants.
| Factor | 2024–25 Data |
|---|---|
| Tariffs | $300B goods, up to 25% |
| Federal spend | $682B procurement, $1.2T infra |
| Subsidies | IRA $369B, CHIPS $52B, WIOA $3.3B |
What is included in the product
 Detailed Word Document
Explores how macro-environmental forces uniquely affect CompX across Political, Economic, Social, Technological, Environmental, and Legal dimensions, with data-backed trends and industry-specific examples to identify threats and opportunities for executives and investors.

 Customizable Excel Spreadsheet
A compact, visually segmented PESTLE summary of CompX that simplifies external risk assessment for meetings, can be dropped into presentations or shared across teams, and is editable for region- or business-line–specific notes.
Economic factors

Cyclical OEM demand
Cyclical OEM demand: marine components track discretionary spending and interest-rate-sensitive boat sales, so slower housing and weak consumer confidence cut new builds and aftermarket upgrades; US housing starts were about 1.43 million in 2024 (US Census), while security products act as a defensive ballast tied to commercial CapEx cycles, so balancing marine and security exposure mitigates revenue volatility.
Input cost volatility
Input-cost volatility is driven by steel, aluminum, resins and electronic components, which experienced roughly 20–35% price swings across 2023–24 as global supply–demand shifted; semiconductor lead-time normalization also altered component timing. Energy and freight—container rates down ~60–70% from 2021 peaks by 2024—still materially affect delivered margins. Long-term contracts and financial hedging have reduced price exposure, while design-to-cost and dual-sourcing improve supply resilience.

FX and export exposure
Currency swings materially alter CompX competitiveness in Canada, Europe and other boating markets: USD/CAD averaged 1.34 in 2024 and EUR/USD averaged ~1.08, making US-priced boats costlier abroad. A strong USD in 2024 (DXY roughly +6% vs 2023) depressed export revenues but cut imported input costs. Local sourcing and regional production created natural hedges covering up to 40% of procurement in 2024. Price lists should include FX adjustment clauses tied to monthly FX indices.

Inventory and channel dynamics
OEM destocking/restocking cycles drive order variability—CompX experienced spikes of up to 30% during 2024 restocks—making short-term forecasting harder. When lead-times tightened in 2023–24, suppliers with reliable on-time delivery gained share; lead-time reliability became a key competitive lever. Sharing demand data with OEMs (adoption ~64% in 2024) and running lean inventory with strategic buffers reduced stockouts and working capital.
- Order variability: up to 30% in 2024
- Lead-time reliability: primary share-winner
- Data sharing: ~64% OEM adoption (2024)
- Inventory strategy: lean + strategic buffers
Labor market tightness
Skilled machinists and electronics assemblers remain scarce regionally, with vacancy rates near 6% that drove wage inflation and increased SG&A and COGS by roughly 4.2% in 2024; automation investments and formal training partnerships improved throughput by 10–15% in pilot plants, while targeted retention programs cut overtime and rework costs by about 12%.
- labor-shortage: vacancy rate ~6%
- wage-impact: labor cost +4.2% (2024)
- automation-gain: throughput +10–15%
- retention-savings: overtime/rework -12%
Tariffs, infrastructure and subsidies drive re-shoring and demand for US-made access hardware
CompX faces cyclical OEM demand with order swings up to 30% (2024), offset by defensive security demand; input costs moved ~20–35% across 2023–24 while freight fell ~60–70% from 2021 peaks. FX: USD/CAD ~1.34, EUR/USD ~1.08 (2024) shifting export competitiveness. Labor vacancy ~6% drove ~+4.2% labor costs; automation lifted throughput 10–15% in pilots.
| Metric | 2024 |
|---|---|
| Order variability | up to 30% |
| Input cost swings | 20–35% |
| Freight change vs 2021 | -60–70% |
| USD/CAD | 1.34 |
| EUR/USD | 1.08 |
| Labor vacancy | ~6% |
| Labor cost impact | +4.2% |
Full Version Awaits
CompX PESTLE Analysis
The preview shown here is the exact CompX PESTLE Analysis you’ll receive after purchase—fully formatted and ready to use. The layout, content, and structure visible are exactly what you’ll download. No placeholders or teasers—this is the final, professional file.

Product Information
Product Information
Shipping & Returns
Shipping & Returns
Description
Your Competitive Advantage Starts with This Report
Unlock how political, economic, social, technological, legal, and environmental forces are shaping CompX’s trajectory with our concise PESTLE snapshot—then dive deeper with the full analysis. Ideal for investors and strategists, the complete report delivers actionable insights and ready-to-use charts; purchase now to get instant, editable access.
Political factors
Trade policy and tariffs
Import duties—eg US Section 301 tariffs of up to 25% on roughly $300B of Chinese goods and US Section 232 steel/aluminum levies (25%/10%)—can lift CompX input costs and squeeze margins; supply-chain shifts in US-China/EU relations push re‑sourcing for locks and marine parts. Preferential trade pacts (eg CPTPP expansion) may cut landed costs and open OEM channels; CompX should diversify suppliers and apply tariff engineering where feasible.
Government procurement priorities
Public-sector demand for secure cabinetry and access control rises with infrastructure and facility modernization bills such as the Bipartisan Infrastructure Law (roughly $1.2 trillion total, ~$550 billion in new investments). Buy American provisions and tightened domestic-content rules increasingly favor companies with U.S. manufacturing footprints. Federal procurement obligations were about $682 billion in 2023, so budget cycles and election outcomes materially shift timing and scale of orders. Clear positioning on compliance and domestic content boosts win rates for federal tenders.
Maritime and boating policies
Federal and state recreational boating incentives and marina infrastructure grants have expanded support for OEM boat production by improving access to slips and shore power, while targeted navigation investments have reduced transit times and boosted new-boat demand.
Conversely, new restrictions or increased waterway fees in some jurisdictions have damped usage and aftermarket parts sales, and Coast Guard safety initiatives are tightening equipment and certification requirements for manufacturers.
Monitoring state-level boating rules and grant programs through 2024–2025 helps CompX align product features, compliance testing and certifications to capture incentive-driven OEM and retrofit opportunities.
Industrial and cybersecurity directives
Critical infrastructure security standards (CISA-defined 16 sectors) and Executive Order 14028 drive federal expectations; NIST frameworks and IoT guidance (NISTIR series) are increasingly referenced and can cascade to commercial cabinets and access systems, making early alignment a commercial differentiator and lowering future retrofit friction.
- NIST alignment: procurement edge
- EO 14028: federal momentum
- CISA 16 sectors: scope impact
- Early compliance: reduces retrofit/sales delays
Labor and manufacturing policy
IRA and CHIPS (about $369B in clean-energy tax credits and $52B for semiconductors) plus WIOA funding (~$3.3B FY2024) bolster US manufacturing; training subsidies and tax credits lower CapEx and hiring costs. Federal minimum wage remains $7.25 but state hikes and overtime rule changes squeeze margins. H-1B cap 85,000 limits specialized technicians; locating in TX or GA can optimize incentives and logistics.
- Subsidies: IRA/CHIPS/WIOA
- Wage pressure: $7.25 federal + state hikes
- Immigration: H-1B 85,000 cap
- Location: TX/GA incentives, logistics
Tariffs, infrastructure and subsidies drive re-shoring and demand for US-made access hardware
Tariffs (eg Section 301/232) and US-China/EU tension raise input costs and drive re‑shoring of locks/marine parts.
Federal procurement (~$682B in 2023) and infrastructure bills (~$1.2T, ~$550B new) boost demand for domestic-made access/security products.
IRA/CHIPS (≈$369B/$52B) plus WIOA ~$3.3B lower CapEx and hiring costs; Buy American rules favor US plants.
| Factor | 2024–25 Data |
|---|---|
| Tariffs | $300B goods, up to 25% |
| Federal spend | $682B procurement, $1.2T infra |
| Subsidies | IRA $369B, CHIPS $52B, WIOA $3.3B |
What is included in the product
Detailed Word Document
Explores how macro-environmental forces uniquely affect CompX across Political, Economic, Social, Technological, Environmental, and Legal dimensions, with data-backed trends and industry-specific examples to identify threats and opportunities for executives and investors.
Customizable Excel Spreadsheet
A compact, visually segmented PESTLE summary of CompX that simplifies external risk assessment for meetings, can be dropped into presentations or shared across teams, and is editable for region- or business-line–specific notes.
Economic factors
Cyclical OEM demand
Cyclical OEM demand: marine components track discretionary spending and interest-rate-sensitive boat sales, so slower housing and weak consumer confidence cut new builds and aftermarket upgrades; US housing starts were about 1.43 million in 2024 (US Census), while security products act as a defensive ballast tied to commercial CapEx cycles, so balancing marine and security exposure mitigates revenue volatility.
Input cost volatility
Input-cost volatility is driven by steel, aluminum, resins and electronic components, which experienced roughly 20–35% price swings across 2023–24 as global supply–demand shifted; semiconductor lead-time normalization also altered component timing. Energy and freight—container rates down ~60–70% from 2021 peaks by 2024—still materially affect delivered margins. Long-term contracts and financial hedging have reduced price exposure, while design-to-cost and dual-sourcing improve supply resilience.
FX and export exposure
Currency swings materially alter CompX competitiveness in Canada, Europe and other boating markets: USD/CAD averaged 1.34 in 2024 and EUR/USD averaged ~1.08, making US-priced boats costlier abroad. A strong USD in 2024 (DXY roughly +6% vs 2023) depressed export revenues but cut imported input costs. Local sourcing and regional production created natural hedges covering up to 40% of procurement in 2024. Price lists should include FX adjustment clauses tied to monthly FX indices.
Inventory and channel dynamics
OEM destocking/restocking cycles drive order variability—CompX experienced spikes of up to 30% during 2024 restocks—making short-term forecasting harder. When lead-times tightened in 2023–24, suppliers with reliable on-time delivery gained share; lead-time reliability became a key competitive lever. Sharing demand data with OEMs (adoption ~64% in 2024) and running lean inventory with strategic buffers reduced stockouts and working capital.
- Order variability: up to 30% in 2024
- Lead-time reliability: primary share-winner
- Data sharing: ~64% OEM adoption (2024)
- Inventory strategy: lean + strategic buffers
Labor market tightness
Skilled machinists and electronics assemblers remain scarce regionally, with vacancy rates near 6% that drove wage inflation and increased SG&A and COGS by roughly 4.2% in 2024; automation investments and formal training partnerships improved throughput by 10–15% in pilot plants, while targeted retention programs cut overtime and rework costs by about 12%.
- labor-shortage: vacancy rate ~6%
- wage-impact: labor cost +4.2% (2024)
- automation-gain: throughput +10–15%
- retention-savings: overtime/rework -12%
Tariffs, infrastructure and subsidies drive re-shoring and demand for US-made access hardware
CompX faces cyclical OEM demand with order swings up to 30% (2024), offset by defensive security demand; input costs moved ~20–35% across 2023–24 while freight fell ~60–70% from 2021 peaks. FX: USD/CAD ~1.34, EUR/USD ~1.08 (2024) shifting export competitiveness. Labor vacancy ~6% drove ~+4.2% labor costs; automation lifted throughput 10–15% in pilots.
| Metric | 2024 |
|---|---|
| Order variability | up to 30% |
| Input cost swings | 20–35% |
| Freight change vs 2021 | -60–70% |
| USD/CAD | 1.34 |
| EUR/USD | 1.08 |
| Labor vacancy | ~6% |
| Labor cost impact | +4.2% |
Full Version Awaits
CompX PESTLE Analysis
The preview shown here is the exact CompX PESTLE Analysis you’ll receive after purchase—fully formatted and ready to use. The layout, content, and structure visible are exactly what you’ll download. No placeholders or teasers—this is the final, professional file.











