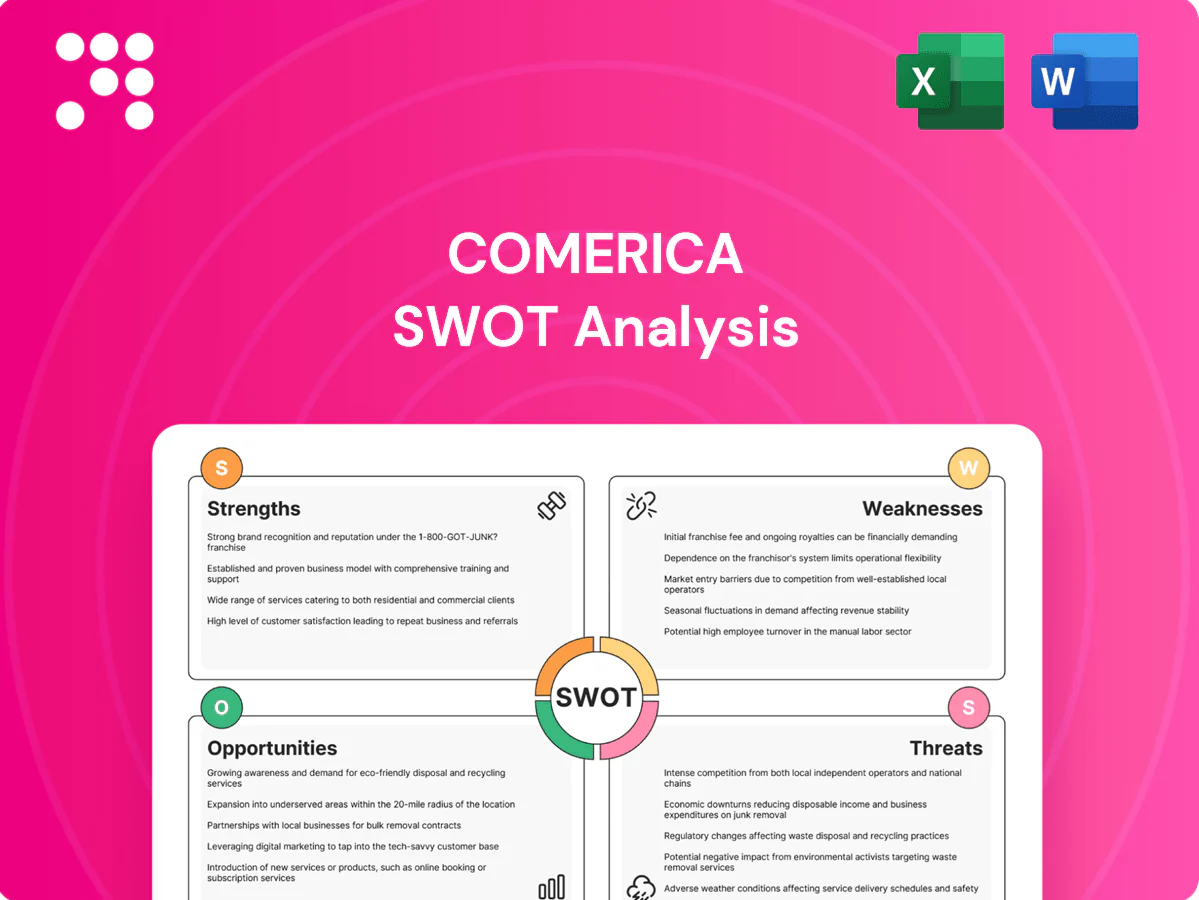
Comerica SWOT Analysis

Your Strategic Toolkit Starts Here
Comerica’s strong regional franchise, diversified commercial lending and improving digital capabilities position it well, but margin pressure, credit volatility, and competitive fintech disruption are key risks. Want the full strategic picture with actionable recommendations? Purchase the complete SWOT analysis for a professional, editable Word report and Excel matrix to plan, pitch, or invest with confidence.
Strengths

Strong regional footprint in key growth markets
Comerica’s footprint across Texas, Michigan, California, Arizona and Florida places it in diverse, high-growth regions covering roughly 107 million residents (2024 est.), giving access to large middle-market and small-business ecosystems. Geographic diversity helps dampen local cyclical swings, while close proximity supports relationship-driven banking and tailored commercial solutions.
Diverse product suite across retail, business, and wealth
Comerica bundles checking and savings, commercial and consumer loans, treasury management, and investment/wealth services under one platform, enabling coordinated cross-selling across its Commercial, Retail and Wealth segments. This breadth, spread across core markets in Texas, California, Michigan, Arizona and Florida, supports deeper client penetration and recurring fee income. Integrated solutions improve client stickiness and lifetime value while diversified revenue sources help smooth earnings through interest-rate cycles.

Middle-market and treasury management capabilities
Comerica’s middle-market and treasury management focus targets cash-intensive clients and supported roughly $51.5 billion in business deposits in 2024, embedding the bank in clients’ daily cash flows. Robust treasury services drove meaningful fee income—about $540 million in 2024—creating switching costs and durable relationships. Scale in these niches supports pricing power and higher profitability per client.

Relationship banking brand and advisory focus
Comerica’s relationship-banking, advisory-first model differentiates it from commoditized lenders by delivering high-touch service that drove a 2024 fee-income resilience with noninterest income supporting operations amid margin pressure; advisory-led lending and wealth management foster trust and referrals, helping retain clients during competitive pricing cycles and enabling more prudent underwriting through deeper client data.
Institutional and wealth management cross-sell
Comerica leverages institutional and wealth management cross-sell to expand share of wallet, with wealth and institutional channels managing about $55 billion in AUM/A (2024) and driving higher fee revenue. Integrated investment and cash management deepen engagement with business owners and affluent clients, raising client stickiness. Fee-based income—roughly a quarter of noninterest revenue—diversifies beyond net interest income and helps stabilize returns through cycles.
- Cross-sell: expands wallet share
- Integrated services: boost client engagement
- Fee-based: ~25% of noninterest revenue
- Resilience: improves cyclicality of returns
Large regional bank: 107M residents, $51.5B business deposits, $55B AUM and stable fee revenue
Comerica’s large footprint in five high-growth states covers ~107 million residents (2024), enabling deep middle-market and SMB penetration. Integrated commercial, treasury, wealth and deposit capabilities drove $51.5B business deposits and ~$540M treasury fee income in 2024, supporting cross-sell and client stickiness. Wealth/institutional channels manage ~$55B AUM, with fee-based revenue ~25% of noninterest income, stabilizing earnings.
| Metric | 2024 |
|---|---|
| Footprint population | ~107M |
| Business deposits | $51.5B |
| Treasury fee income | $540M |
| AUM | $55B |
| Fee-based share | ~25% |
What is included in the product
 Detailed Word Document
Delivers a strategic overview of Comerica’s internal and external business factors, outlining strengths, weaknesses, opportunities, and threats to assess its competitive position and growth prospects.

 Customizable Excel Spreadsheet
Provides a concise Comerica SWOT matrix for fast, visual strategy alignment, ideal for executives needing a snapshot of competitive positioning and risk; easily editable to update strengths, weaknesses, opportunities, and threats as priorities evolve.
Weaknesses

Regional concentration risk
Comerica’s loan and deposit footprint is concentrated in Texas, California, Arizona, Florida and Michigan, exposing results to localized economic downturns in those states. Industry shocks in regional sectors—energy in Texas, auto in Michigan, and commercial real estate in Sun Belt metros—can rapidly pressure credit quality. Frequent hurricanes and severe weather in Sun Belt markets add earnings volatility, and expanding diversification beyond core states has proven slow and challenging.
Commercial lending concentration
Comerica’s heavy commercial lending concentration—with commercial loans accounting for over 60% of its loan book in 2024—increases sensitivity to the credit cycle; middle‑market and CRE exposures can incur outsized losses in recessions. Borrower performance is closely tied to interest‑rate movements and GDP trends, and this concentration limits strategic flexibility when key sectors weaken.

Interest-rate and deposit-beta sensitivity
Comerica faces interest-rate and deposit-beta sensitivity as funding costs can rise quickly when customers demand higher yields, compressing net interest margin and hurting profitability in tightening cycles. Ongoing efforts to shift deposit mix toward stable, low-cost balances are required, but hedging and balance-sheet repositioning can lag rapid rate moves, leaving short-term margin pressure and funding volatility.

Competitive pressure from large banks and fintechs
- Higher tech spend by large banks
- Fintechs: agile SMB/payment focus
- Rising CAC and fee compression
- Accelerated digital expectations
Operational and compliance complexity
Comerica’s multiple product lines and regional footprint amplify regulatory and compliance complexity, requiring layered controls across banking, wealth and commercial segments. Sustained investment is needed to maintain cybersecurity and fraud prevention as threats evolve, while third-party and legacy-technology dependencies raise operational-risk exposure and outage potential. Process inefficiencies have contributed to a higher cost-to-income profile versus peers.
- Regulatory scope: multi-division oversight
- Cybersecurity: ongoing capex and controls
- Third-party risk: vendor/tech dependencies
- Efficiency: elevated cost-to-income pressure
Five-state concentration and >60% commercial loans raise CRE, funding and tech risk
Concentration in five states (TX, CA, AZ, FL, MI) leaves earnings exposed to regional downturns and severe-weather shocks.
Heavy commercial lending (commercial loans >60% of book in 2024) heightens credit-cycle and CRE/middle‑market risk.
Funding sensitivity, digital/tech investment gaps versus mega-banks, and legacy/third‑party dependencies pressure margins and efficiency.
| Metric | Value / Example |
|---|---|
| Commercial loans (2024) | >60% |
| Core states | TX, CA, AZ, FL, MI |
| Big-bank tech spend | JPMorgan ~$15B (2023) |
| Fintech competitors | Stripe, Block |
Same Document Delivered
Comerica SWOT Analysis
This is a real excerpt from the complete Comerica SWOT analysis you'll receive upon purchase—no surprises, just professional quality. The preview below is taken directly from the full report, and the entire editable document is unlocked after checkout.

Product Information
Product Information
Shipping & Returns
Shipping & Returns
Description
Your Strategic Toolkit Starts Here
Comerica’s strong regional franchise, diversified commercial lending and improving digital capabilities position it well, but margin pressure, credit volatility, and competitive fintech disruption are key risks. Want the full strategic picture with actionable recommendations? Purchase the complete SWOT analysis for a professional, editable Word report and Excel matrix to plan, pitch, or invest with confidence.
Strengths
Strong regional footprint in key growth markets
Comerica’s footprint across Texas, Michigan, California, Arizona and Florida places it in diverse, high-growth regions covering roughly 107 million residents (2024 est.), giving access to large middle-market and small-business ecosystems. Geographic diversity helps dampen local cyclical swings, while close proximity supports relationship-driven banking and tailored commercial solutions.
Diverse product suite across retail, business, and wealth
Comerica bundles checking and savings, commercial and consumer loans, treasury management, and investment/wealth services under one platform, enabling coordinated cross-selling across its Commercial, Retail and Wealth segments. This breadth, spread across core markets in Texas, California, Michigan, Arizona and Florida, supports deeper client penetration and recurring fee income. Integrated solutions improve client stickiness and lifetime value while diversified revenue sources help smooth earnings through interest-rate cycles.
Middle-market and treasury management capabilities
Comerica’s middle-market and treasury management focus targets cash-intensive clients and supported roughly $51.5 billion in business deposits in 2024, embedding the bank in clients’ daily cash flows. Robust treasury services drove meaningful fee income—about $540 million in 2024—creating switching costs and durable relationships. Scale in these niches supports pricing power and higher profitability per client.
Relationship banking brand and advisory focus
Comerica’s relationship-banking, advisory-first model differentiates it from commoditized lenders by delivering high-touch service that drove a 2024 fee-income resilience with noninterest income supporting operations amid margin pressure; advisory-led lending and wealth management foster trust and referrals, helping retain clients during competitive pricing cycles and enabling more prudent underwriting through deeper client data.
Institutional and wealth management cross-sell
Comerica leverages institutional and wealth management cross-sell to expand share of wallet, with wealth and institutional channels managing about $55 billion in AUM/A (2024) and driving higher fee revenue. Integrated investment and cash management deepen engagement with business owners and affluent clients, raising client stickiness. Fee-based income—roughly a quarter of noninterest revenue—diversifies beyond net interest income and helps stabilize returns through cycles.
- Cross-sell: expands wallet share
- Integrated services: boost client engagement
- Fee-based: ~25% of noninterest revenue
- Resilience: improves cyclicality of returns
Large regional bank: 107M residents, $51.5B business deposits, $55B AUM and stable fee revenue
Comerica’s large footprint in five high-growth states covers ~107 million residents (2024), enabling deep middle-market and SMB penetration. Integrated commercial, treasury, wealth and deposit capabilities drove $51.5B business deposits and ~$540M treasury fee income in 2024, supporting cross-sell and client stickiness. Wealth/institutional channels manage ~$55B AUM, with fee-based revenue ~25% of noninterest income, stabilizing earnings.
| Metric | 2024 |
|---|---|
| Footprint population | ~107M |
| Business deposits | $51.5B |
| Treasury fee income | $540M |
| AUM | $55B |
| Fee-based share | ~25% |
What is included in the product
Detailed Word Document
Delivers a strategic overview of Comerica’s internal and external business factors, outlining strengths, weaknesses, opportunities, and threats to assess its competitive position and growth prospects.
Customizable Excel Spreadsheet
Provides a concise Comerica SWOT matrix for fast, visual strategy alignment, ideal for executives needing a snapshot of competitive positioning and risk; easily editable to update strengths, weaknesses, opportunities, and threats as priorities evolve.
Weaknesses
Regional concentration risk
Comerica’s loan and deposit footprint is concentrated in Texas, California, Arizona, Florida and Michigan, exposing results to localized economic downturns in those states. Industry shocks in regional sectors—energy in Texas, auto in Michigan, and commercial real estate in Sun Belt metros—can rapidly pressure credit quality. Frequent hurricanes and severe weather in Sun Belt markets add earnings volatility, and expanding diversification beyond core states has proven slow and challenging.
Commercial lending concentration
Comerica’s heavy commercial lending concentration—with commercial loans accounting for over 60% of its loan book in 2024—increases sensitivity to the credit cycle; middle‑market and CRE exposures can incur outsized losses in recessions. Borrower performance is closely tied to interest‑rate movements and GDP trends, and this concentration limits strategic flexibility when key sectors weaken.
Interest-rate and deposit-beta sensitivity
Comerica faces interest-rate and deposit-beta sensitivity as funding costs can rise quickly when customers demand higher yields, compressing net interest margin and hurting profitability in tightening cycles. Ongoing efforts to shift deposit mix toward stable, low-cost balances are required, but hedging and balance-sheet repositioning can lag rapid rate moves, leaving short-term margin pressure and funding volatility.
Competitive pressure from large banks and fintechs
- Higher tech spend by large banks
- Fintechs: agile SMB/payment focus
- Rising CAC and fee compression
- Accelerated digital expectations
Operational and compliance complexity
Comerica’s multiple product lines and regional footprint amplify regulatory and compliance complexity, requiring layered controls across banking, wealth and commercial segments. Sustained investment is needed to maintain cybersecurity and fraud prevention as threats evolve, while third-party and legacy-technology dependencies raise operational-risk exposure and outage potential. Process inefficiencies have contributed to a higher cost-to-income profile versus peers.
- Regulatory scope: multi-division oversight
- Cybersecurity: ongoing capex and controls
- Third-party risk: vendor/tech dependencies
- Efficiency: elevated cost-to-income pressure
Five-state concentration and >60% commercial loans raise CRE, funding and tech risk
Concentration in five states (TX, CA, AZ, FL, MI) leaves earnings exposed to regional downturns and severe-weather shocks.
Heavy commercial lending (commercial loans >60% of book in 2024) heightens credit-cycle and CRE/middle‑market risk.
Funding sensitivity, digital/tech investment gaps versus mega-banks, and legacy/third‑party dependencies pressure margins and efficiency.
| Metric | Value / Example |
|---|---|
| Commercial loans (2024) | >60% |
| Core states | TX, CA, AZ, FL, MI |
| Big-bank tech spend | JPMorgan ~$15B (2023) |
| Fintech competitors | Stripe, Block |
Same Document Delivered
Comerica SWOT Analysis
This is a real excerpt from the complete Comerica SWOT analysis you'll receive upon purchase—no surprises, just professional quality. The preview below is taken directly from the full report, and the entire editable document is unlocked after checkout.











