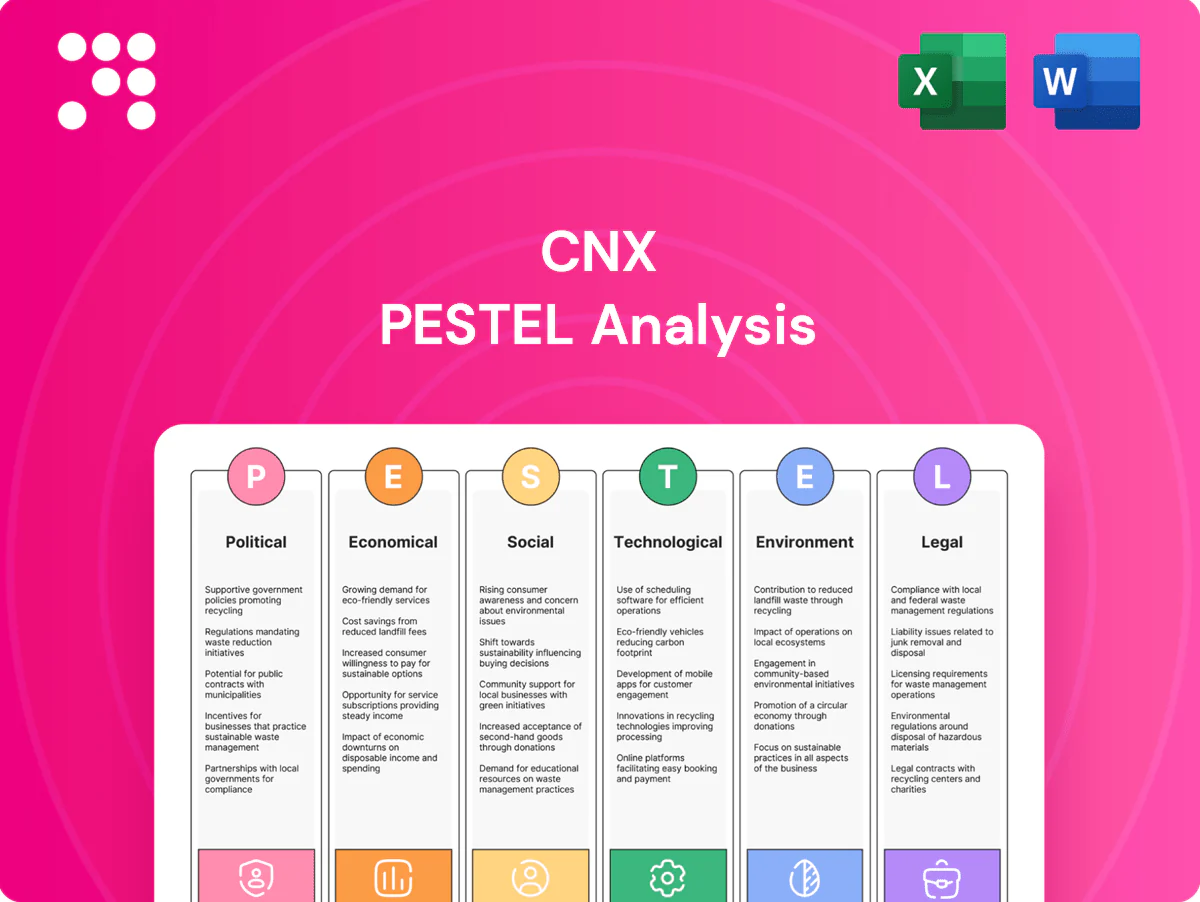
CNX PESTLE Analysis

Skip the Research. Get the Strategy.
Unlock how political shifts, economic cycles, social trends, technological advances, legal changes, and environmental pressures are shaping CNX’s trajectory with our targeted PESTLE analysis. This concise briefing highlights key risks and opportunities for investors and strategists. Purchase the full report to access the complete, actionable insights and ready-made slides for immediate use.
Political factors

Federal energy policy direction
Federal energy priorities shape CNX via drilling permits, pipeline approvals, and tax incentives; the Inflation Reduction Act allocates roughly 369 billion for clean energy tax credits, shifting investment math away from fossil projects. Flips between pro-fossil and decarbonization administrations alter CNX planning horizons and valuation assumptions. Methane fee design and DOE LNG export policies (US export capacity ~13 Bcf/d in 2024) can materially affect returns, so CNX uses strategic engagement and scenario planning to mitigate policy whiplash.
State-level governance in Appalachia
Pennsylvania, West Virginia and Ohio set key rules on permitting, severance-like fees and setbacks that govern development timelines and costs. Gubernatorial and legislative election cycles occur every 4 years, frequently shifting regulatory tone and permitting pace. Local ordinances and county commissions—PA 67 counties, WV 55, OH 88—further shape site access. CNX must sustain active multi-jurisdictional stakeholder relations.

Pipeline and midstream politics
High-profile pipeline debates, including Mountain Valley Pipeline cost overruns (~$6.6B), raise barriers to new takeaway capacity and delay projects. FERC’s 3-2 commission split and interstate politics drive approvals and recurring legal challenges. Limited midstream tightens Appalachia basis—regional output near 30 Bcf/d faces constrained takeaway, widening differentials. CNX economics hinge on stable pipeline policy and regional cooperation.

Geopolitical gas dynamics
Global gas security elevates U.S. supply’s strategic value; U.S. LNG capacity reached about 12.9 Bcf/d by mid‑2025 and 2024 Henry Hub averaged roughly 2.9 USD/MMBtu, so export policy and shocks in Europe/Asia continue to ripple into domestic prices and basis. Political support for exports sustains long‑term demand, and CNX benefits from predictable export frameworks that reduce market volatility risk.
- US LNG capacity ~12.9 Bcf/d (mid‑2025)
- 2024 Henry Hub avg ~2.9 USD/MMBtu
- Predictable export policy = lower price volatility for CNX
Public subsidies and incentives
Credits for methane abatement, electrification and CCS materially boost project economics—45Q CCS credits now reach up to $85 per tCO2 for secure geological storage—while expanding renewables subsidies are likely to pressure gas demand over the next decade. Navigating eligibility and complex reporting regimes is essential, and aligning the asset portfolio secures policy tailwinds.
- 45Q up to $85/tCO2
- Renewables ramp compress gas demand
- Strict eligibility & reporting
- Portfolio alignment = policy upside
IRA, methane fee and 45Q ($85/tCO2) reshape capital allocation; US LNG 12.9 Bcf/d raises basis risk
Federal and state shifts (IRA, methane fee, 45Q up to $85/tCO2) reshape CNX capital allocation and permitting risk; US LNG capacity ~12.9 Bcf/d (mid‑2025) and 2024 Henry Hub avg ~$2.9/MMBtu tie exports to domestic valuation. Pipeline constraints (Appalachia ~30 Bcf/d, MVP ~$6.6B overruns) widen basis risk, making stakeholder engagement and scenario planning essential.
| Metric | Value |
|---|---|
| US LNG cap | 12.9 Bcf/d |
| Henry Hub 2024 | $2.9/MMBtu |
| 45Q | $85/tCO2 |
What is included in the product
 Detailed Word Document
Explores how external macro-environmental factors uniquely affect the CNX across Political, Economic, Social, Technological, Environmental and Legal dimensions, with data-backed trends and region-specific examples. Designed for executives, consultants and investors to identify threats, opportunities and inform scenario planning.

 Customizable Excel Spreadsheet
Provides a clean, summarized CNX PESTLE that’s visually segmented by category for quick interpretation, easily droppable into presentations or shared across teams to streamline risk discussions and strategic planning.
Economic factors

Gas price volatility
Henry Hub swings and regional basis drive CNX revenue variability; EIA shows a 2024 Henry Hub average near 3.49 USD/MMBtu. Appalachian takeaway constraints often widen discounts to multi-dollar differentials during peak demand and outages. Hedging programs stabilize cash flows but cap upside potential. CNX must align capex with price cycles to protect cash returns and balance growth timing.
Demand from power and LNG
Gas-fired generation (~40% of US power mix in 2024) and rising LNG exports (US liquefaction ~13 Bcf/d in 2024; global LNG trade ~380 mt) underpin medium-term demand. Weather, coal-to-gas switching and faster renewables deployment shift load profiles. Periodic LNG capacity additions tighten markets cyclically. CNX should prioritize long‑dated, reliable offtake contracts.

Capital costs and interest rates
Higher policy rates (Fed funds ~5.25–5.50% mid‑2025) lift WACC by roughly 200–300 bps, pushing drilling hurdle rates above 15% for CNX. Oilfield service inflation (~7% YoY) raises completion and labor expenses, while supply‑chain tightness stretches lead times to 6–9 months for pads and major equipment. Operational discipline and long‑term vendor partnerships have preserved margins, delivering an estimated 10–15% procurement cost reduction.

Product mix and midstream margins
CNX's product mix is ~90% dry gas vs liquids, so realized prices track Henry Hub (2024 average ~2.99 $/MMBtu), muting NGL upside but stabilizing cash flow; gathering/transport contracts and owned midstream materially affect netbacks by reducing third-party tolls and curtailments. Optimization of routes lowers fees and downtime; integrated logistics lets CNX capture incremental value across the chain.
- gas_mix: ~90% dry gas (CNX)
- henry_hub_2024: 2.99 $/MMBtu
- midstream_edge: owned gathering cuts third-party tolls/curtailments
- optimize: route optimization raises netbacks
Employment and regional economy
Appalachian labor markets, covering 420 counties and about 25 million people per Appalachian Regional Commission, shape availability and wage trends for CNX’s Marcellus/Utica operations; regional labor shortages push wages above local averages while local procurement lowers logistics and input costs and builds community goodwill. Economic downturns can reduce service and contract costs but typically cut gas demand and drilling activity; balanced workforce planning and flexible staffing reduce cyclical risk.
- 420 counties, ~25 million residents
- Local sourcing lowers input/logistics costs
- Downturns: lower service costs but weaker demand
- Workforce flexibility reduces cyclic exposure
IRA, methane fee and 45Q ($85/tCO2) reshape capital allocation; US LNG 12.9 Bcf/d raises basis risk
Henry Hub volatility (2024 avg 2.99 $/MMBtu) and Appalachian basis differentials drive CNX revenue; hedges stabilize cash but cap upside. Demand from gas-fired power (~40% US mix 2024) and US LNG (~13 Bcf/d 2024) supports medium-term outlook while Fed funds ~5.25–5.50% mid‑2025 raises WACC and drilling hurdles. CNX ~90% dry gas; owned midstream and Appalachian labor (420 counties, ~25M) shape netbacks and costs.
| Metric | Value |
|---|---|
| Henry Hub (2024) | 2.99 $/MMBtu |
| Fed funds (mid‑2025) | 5.25–5.50% |
| US LNG (2024) | ~13 Bcf/d |
| Gas mix | ~90% dry gas |
| Appalachia | 420 counties, ~25M pop |
Preview Before You Purchase
CNX PESTLE Analysis
The preview shown here is the exact CNX PESTLE Analysis document you’ll receive after purchase—fully formatted and ready to use. The layout, content, and structure visible are the same file you’ll download immediately after payment. No placeholders or teasers—this is the final, professionally structured report you’ll own upon checkout.

Product Information
Product Information
Shipping & Returns
Shipping & Returns
Description
Skip the Research. Get the Strategy.
Unlock how political shifts, economic cycles, social trends, technological advances, legal changes, and environmental pressures are shaping CNX’s trajectory with our targeted PESTLE analysis. This concise briefing highlights key risks and opportunities for investors and strategists. Purchase the full report to access the complete, actionable insights and ready-made slides for immediate use.
Political factors
Federal energy policy direction
Federal energy priorities shape CNX via drilling permits, pipeline approvals, and tax incentives; the Inflation Reduction Act allocates roughly 369 billion for clean energy tax credits, shifting investment math away from fossil projects. Flips between pro-fossil and decarbonization administrations alter CNX planning horizons and valuation assumptions. Methane fee design and DOE LNG export policies (US export capacity ~13 Bcf/d in 2024) can materially affect returns, so CNX uses strategic engagement and scenario planning to mitigate policy whiplash.
State-level governance in Appalachia
Pennsylvania, West Virginia and Ohio set key rules on permitting, severance-like fees and setbacks that govern development timelines and costs. Gubernatorial and legislative election cycles occur every 4 years, frequently shifting regulatory tone and permitting pace. Local ordinances and county commissions—PA 67 counties, WV 55, OH 88—further shape site access. CNX must sustain active multi-jurisdictional stakeholder relations.
Pipeline and midstream politics
High-profile pipeline debates, including Mountain Valley Pipeline cost overruns (~$6.6B), raise barriers to new takeaway capacity and delay projects. FERC’s 3-2 commission split and interstate politics drive approvals and recurring legal challenges. Limited midstream tightens Appalachia basis—regional output near 30 Bcf/d faces constrained takeaway, widening differentials. CNX economics hinge on stable pipeline policy and regional cooperation.
Geopolitical gas dynamics
Global gas security elevates U.S. supply’s strategic value; U.S. LNG capacity reached about 12.9 Bcf/d by mid‑2025 and 2024 Henry Hub averaged roughly 2.9 USD/MMBtu, so export policy and shocks in Europe/Asia continue to ripple into domestic prices and basis. Political support for exports sustains long‑term demand, and CNX benefits from predictable export frameworks that reduce market volatility risk.
- US LNG capacity ~12.9 Bcf/d (mid‑2025)
- 2024 Henry Hub avg ~2.9 USD/MMBtu
- Predictable export policy = lower price volatility for CNX
Public subsidies and incentives
Credits for methane abatement, electrification and CCS materially boost project economics—45Q CCS credits now reach up to $85 per tCO2 for secure geological storage—while expanding renewables subsidies are likely to pressure gas demand over the next decade. Navigating eligibility and complex reporting regimes is essential, and aligning the asset portfolio secures policy tailwinds.
- 45Q up to $85/tCO2
- Renewables ramp compress gas demand
- Strict eligibility & reporting
- Portfolio alignment = policy upside
IRA, methane fee and 45Q ($85/tCO2) reshape capital allocation; US LNG 12.9 Bcf/d raises basis risk
Federal and state shifts (IRA, methane fee, 45Q up to $85/tCO2) reshape CNX capital allocation and permitting risk; US LNG capacity ~12.9 Bcf/d (mid‑2025) and 2024 Henry Hub avg ~$2.9/MMBtu tie exports to domestic valuation. Pipeline constraints (Appalachia ~30 Bcf/d, MVP ~$6.6B overruns) widen basis risk, making stakeholder engagement and scenario planning essential.
| Metric | Value |
|---|---|
| US LNG cap | 12.9 Bcf/d |
| Henry Hub 2024 | $2.9/MMBtu |
| 45Q | $85/tCO2 |
What is included in the product
Detailed Word Document
Explores how external macro-environmental factors uniquely affect the CNX across Political, Economic, Social, Technological, Environmental and Legal dimensions, with data-backed trends and region-specific examples. Designed for executives, consultants and investors to identify threats, opportunities and inform scenario planning.
Customizable Excel Spreadsheet
Provides a clean, summarized CNX PESTLE that’s visually segmented by category for quick interpretation, easily droppable into presentations or shared across teams to streamline risk discussions and strategic planning.
Economic factors
Gas price volatility
Henry Hub swings and regional basis drive CNX revenue variability; EIA shows a 2024 Henry Hub average near 3.49 USD/MMBtu. Appalachian takeaway constraints often widen discounts to multi-dollar differentials during peak demand and outages. Hedging programs stabilize cash flows but cap upside potential. CNX must align capex with price cycles to protect cash returns and balance growth timing.
Demand from power and LNG
Gas-fired generation (~40% of US power mix in 2024) and rising LNG exports (US liquefaction ~13 Bcf/d in 2024; global LNG trade ~380 mt) underpin medium-term demand. Weather, coal-to-gas switching and faster renewables deployment shift load profiles. Periodic LNG capacity additions tighten markets cyclically. CNX should prioritize long‑dated, reliable offtake contracts.
Capital costs and interest rates
Higher policy rates (Fed funds ~5.25–5.50% mid‑2025) lift WACC by roughly 200–300 bps, pushing drilling hurdle rates above 15% for CNX. Oilfield service inflation (~7% YoY) raises completion and labor expenses, while supply‑chain tightness stretches lead times to 6–9 months for pads and major equipment. Operational discipline and long‑term vendor partnerships have preserved margins, delivering an estimated 10–15% procurement cost reduction.
Product mix and midstream margins
CNX's product mix is ~90% dry gas vs liquids, so realized prices track Henry Hub (2024 average ~2.99 $/MMBtu), muting NGL upside but stabilizing cash flow; gathering/transport contracts and owned midstream materially affect netbacks by reducing third-party tolls and curtailments. Optimization of routes lowers fees and downtime; integrated logistics lets CNX capture incremental value across the chain.
- gas_mix: ~90% dry gas (CNX)
- henry_hub_2024: 2.99 $/MMBtu
- midstream_edge: owned gathering cuts third-party tolls/curtailments
- optimize: route optimization raises netbacks
Employment and regional economy
Appalachian labor markets, covering 420 counties and about 25 million people per Appalachian Regional Commission, shape availability and wage trends for CNX’s Marcellus/Utica operations; regional labor shortages push wages above local averages while local procurement lowers logistics and input costs and builds community goodwill. Economic downturns can reduce service and contract costs but typically cut gas demand and drilling activity; balanced workforce planning and flexible staffing reduce cyclical risk.
- 420 counties, ~25 million residents
- Local sourcing lowers input/logistics costs
- Downturns: lower service costs but weaker demand
- Workforce flexibility reduces cyclic exposure
IRA, methane fee and 45Q ($85/tCO2) reshape capital allocation; US LNG 12.9 Bcf/d raises basis risk
Henry Hub volatility (2024 avg 2.99 $/MMBtu) and Appalachian basis differentials drive CNX revenue; hedges stabilize cash but cap upside. Demand from gas-fired power (~40% US mix 2024) and US LNG (~13 Bcf/d 2024) supports medium-term outlook while Fed funds ~5.25–5.50% mid‑2025 raises WACC and drilling hurdles. CNX ~90% dry gas; owned midstream and Appalachian labor (420 counties, ~25M) shape netbacks and costs.
| Metric | Value |
|---|---|
| Henry Hub (2024) | 2.99 $/MMBtu |
| Fed funds (mid‑2025) | 5.25–5.50% |
| US LNG (2024) | ~13 Bcf/d |
| Gas mix | ~90% dry gas |
| Appalachia | 420 counties, ~25M pop |
Preview Before You Purchase
CNX PESTLE Analysis
The preview shown here is the exact CNX PESTLE Analysis document you’ll receive after purchase—fully formatted and ready to use. The layout, content, and structure visible are the same file you’ll download immediately after payment. No placeholders or teasers—this is the final, professionally structured report you’ll own upon checkout.











