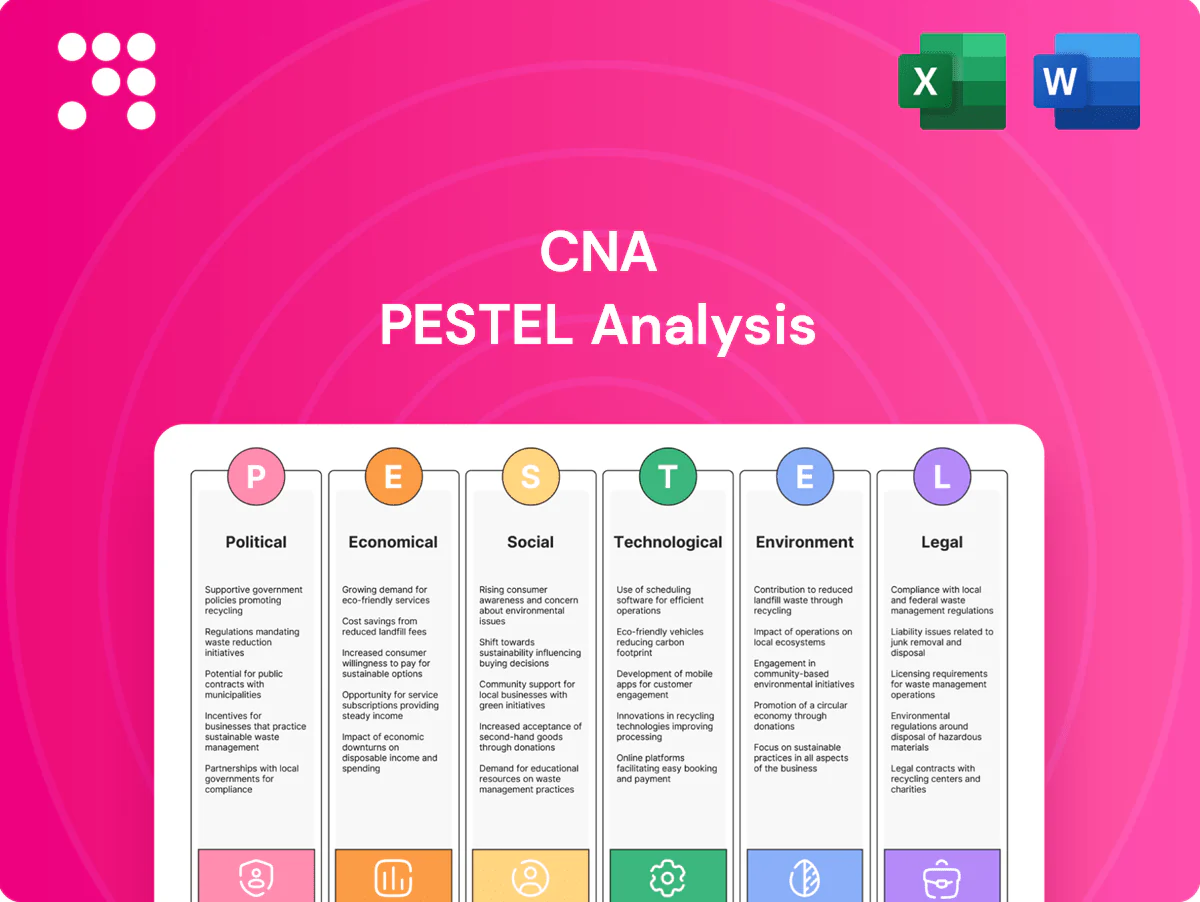
CNA PESTLE Analysis

Plan Smarter. Present Sharper. Compete Stronger.
Unlock how political, economic, social, technological, legal and environmental forces shape CNA’s trajectory with our concise PESTLE briefing — perfect for investors and strategists seeking actionable external insights. Purchase the full analysis to access detailed risk scores, trend impacts and ready-to-use recommendations for immediate strategy application.
Political factors

Regulatory oversight and policy direction
Insurance is politically sensitive, with state-based regulation (NAIC membership: 56 jurisdictions) and federal oversight (FSOC created 2010) shaping market conduct, solvency rules, and rate approvals. For CNA, NAIC model changes or state department actions can constrain pricing flexibility and capital planning. Monitoring policy agendas helps anticipate compliance investments and product adjustments. Active engagement in industry associations can influence timelines and outcomes.
Geopolitical tensions and trade dynamics
Geopolitical tensions and shifting trade policies reshape exposures for CNA clients as global merchandise trade — roughly $32 trillion in 2023 — alters cargo flows, escalating marine and specialty line risk. Expanding sanctions and export controls heighten underwriting complexity and compliance costs, forcing stricter policy terms. Political instability raises loss frequency for multinational operations, requiring tighter risk selection. Scenario planning aligns reinsurance and aggregation limits to these stressors.

Public infrastructure and resilience spending
Government investment in resilient infrastructure, exemplified by the 2021 Bipartisan Infrastructure Law providing roughly 1.2 trillion dollars in total authorizations, can reduce catastrophe losses over time by strengthening networks and mitigation. Conversely, ASCE estimated a U.S. infrastructure investment gap of about 2.59 trillion dollars by 2029, and deferred maintenance elevates property and casualty claim severity. CNA should track federal and state funding streams and FEMA grant programs to map shifting regional risk profiles and pursue public-private partnerships to expand loss control services.

Disaster relief and socialization of risk
Government backstops and disaster aid can crowd out private insurance or blunt pricing signals; US federal disaster assistance averaged about 20 billion USD/year (2010–2019), while the NFIP held roughly 4.7 million policies by 2024, shaping flood risk take-up and terms. CNA must coordinate with public schemes to avoid adverse selection and coverage gaps, and rapidly recalibrate products when policy shifts occur.
- Policy interaction: coordinate with NFIP and state programs
- Adverse selection: monitor take-up and pricing signals
- Product agility: update rates/terms after legislative changes
Tax policy and incentives
Corporate tax policy — US federal rate 21% — plus rules on loss reserve deductibility and investment income taxation materially affect insurer after-tax results and capital deployment.
Tax credits and incentives from the Inflation Reduction Act and related 2023–25 state programs for cyber, resilience, and green investments support product innovation and underwriting of emerging risks.
Unexpected tax changes can force shifts in capital allocation and reinsurance structuring; proactive tax planning helps preserve ROE targets.
- US federal corporate tax rate: 21%
- IRA and state credits bolster green/resilience investment
- Loss reserve deductibility influences taxable income
Regulatory, trade and infrastructure shifts reshape insurance pricing, capital and risk
Political and regulatory shifts (NAIC: 56 jurisdictions; FSOC est. 2010) constrain pricing, capital and compliance; federal/state model changes force product and reserve adjustments. Geopolitical trade ($32T global trade, 2023) and sanctions raise specialty exposures and compliance costs. Infrastructure funding (BIL ≈ $1.2T, 2021) and ASCE gap ($2.59T by 2029) alter regional loss trends; disaster aid (~$20B/yr 2010–2019) and NFIP (≈4.7M policies, 2024) affect private uptake. Corporate tax 21% impacts after-tax returns and capital strategy.
| Metric | Value | Implication |
|---|---|---|
| NAIC jurisdictions | 56 | Regulatory variability |
| Global trade | $32T (2023) | Marine/supply risk |
| BIL | $1.2T (2021) | Mitigation reduces CAT losses |
| Corp tax | 21% | After-tax ROE impact |
What is included in the product
 Detailed Word Document
Examines how macro-environmental forces—Political, Economic, Social, Technological, Environmental, and Legal—specifically impact the CNA, combining current data and trend analysis to identify risks and opportunities; tailored for executives and investors, it supports strategic planning, scenario design, and investor-ready reporting.

 Customizable Excel Spreadsheet
Condensed CNA PESTLE summary that’s visually segmented and editable—ideal for quick reference in meetings, slide decks, or cross-team briefings to speed decision-making and surface external risks affecting strategy.
Economic factors

Interest rate environment
Investment yields are a key driver of insurer earnings and pricing strategy; with the federal funds target at 5.25–5.50% in mid‑2025, higher short‑term rates materially lift portfolio income for carriers like CNA. Rising rates support higher investment returns but create unrealized mark‑to‑market losses and duration management challenges on long‑dated bonds. CNA must balance asset‑liability matching with return targets, while rate paths drive competitive pricing and growth dynamics.
Inflation and loss cost trends
General and social inflation push up claim severities across commercial lines as CPI rose 3.4% in 2024, increasing baseline loss severity.
Wage growth near 4.0%, medical services CPI +4.2% and elevated vehicle repair costs force faster rate adequacy and tighter terms.
CNA needs robust reserving and claims analytics to avoid reserve drift, as supplier constraints and parts/backlog delays lengthen claim durations and raise expenses.

Economic cycles and business activity
Commercial exposures track payrolls, sales and capital spending—US nonfarm payrolls rose by about 2.74 million in 2023 and real GDP grew 2.5% that year, lifting insured exposure bases. Economic slowdowns compress payrolls and sales, reducing premium growth and raising surety default risk. Expansions enlarge exposures but often trigger competitive pricing pressure. Industry diversification smooths these cycle-driven swings.

Reinsurance capacity and pricing
Global reinsurance pricing rose about 10–20% at 2024 renewals, tightening capacity and pressuring CNAs net retention, capital efficiency and CAT risk appetite. Hard markets lift ceded costs and can force portfolio reshaping; CNA must optimize attachment points and ceded structures to control volatility while monitoring reinsurer credit quality.
- 2024 price rise: ~10–20%
- Impact: lower retention, higher ceded cost
- Action: optimize attachment/ceded structures
- Risk: reinsurer counterparty credit
Credit markets and client solvency
Client bankruptcies elevate claims severity and E&O exposures and stress surety obligations; FDIC and regulators noted rising commercial real estate loan delinquencies through 2023–24, worsening counterparty risk and tightening credit availability. Tight credit can reduce insured values and project starts, pressuring premium volumes; CNA should intensify credit monitoring and underwriting discipline during downturns and deploy tailored risk engineering to bolster client resilience.
- Monitor: strengthen credit surveillance and covenant tracking
- Underwrite: tighten terms on high CRE/supply-chain exposures
- Engineer: offer loss-prevention programs to reduce claims
- Surety: increase collateral/limits on stressed obligors
Regulatory, trade and infrastructure shifts reshape insurance pricing, capital and risk
Higher policy yields (fed funds 5.25–5.50% mid‑2025) boost investment income but raise duration risk; CPI 2024 +3.4% with wage growth ~4.0% and medical CPI +4.2% drive claim severity and faster rate adequacy; reinsurance pricing +10–20% in 2024 tightens capacity and raises ceded costs; CRE delinquencies and tighter credit compress premium growth and elevate counterparty risk.
| Metric | Value |
|---|---|
| Fed funds | 5.25–5.50% (mid‑2025) |
| CPI 2024 | +3.4% |
| Wage growth | ~4.0% |
| Medical CPI | +4.2% |
| Reins. pricing 2024 | +10–20% |
| US real GDP 2023 | +2.5% |
Preview the Actual Deliverable
CNA PESTLE Analysis
The CNA PESTLE Analysis provides a structured review of political, economic, social, technological, legal, and environmental factors affecting CNA. The preview shown here is the exact document you’ll receive after purchase—fully formatted and ready to use. No placeholders or teasers; the file is the final, professionally structured report available for immediate download.

Original: $10.00
-65%$10.00
$3.50Product Information
Product Information
Shipping & Returns
Shipping & Returns
Description
Plan Smarter. Present Sharper. Compete Stronger.
Unlock how political, economic, social, technological, legal and environmental forces shape CNA’s trajectory with our concise PESTLE briefing — perfect for investors and strategists seeking actionable external insights. Purchase the full analysis to access detailed risk scores, trend impacts and ready-to-use recommendations for immediate strategy application.
Political factors
Regulatory oversight and policy direction
Insurance is politically sensitive, with state-based regulation (NAIC membership: 56 jurisdictions) and federal oversight (FSOC created 2010) shaping market conduct, solvency rules, and rate approvals. For CNA, NAIC model changes or state department actions can constrain pricing flexibility and capital planning. Monitoring policy agendas helps anticipate compliance investments and product adjustments. Active engagement in industry associations can influence timelines and outcomes.
Geopolitical tensions and trade dynamics
Geopolitical tensions and shifting trade policies reshape exposures for CNA clients as global merchandise trade — roughly $32 trillion in 2023 — alters cargo flows, escalating marine and specialty line risk. Expanding sanctions and export controls heighten underwriting complexity and compliance costs, forcing stricter policy terms. Political instability raises loss frequency for multinational operations, requiring tighter risk selection. Scenario planning aligns reinsurance and aggregation limits to these stressors.
Public infrastructure and resilience spending
Government investment in resilient infrastructure, exemplified by the 2021 Bipartisan Infrastructure Law providing roughly 1.2 trillion dollars in total authorizations, can reduce catastrophe losses over time by strengthening networks and mitigation. Conversely, ASCE estimated a U.S. infrastructure investment gap of about 2.59 trillion dollars by 2029, and deferred maintenance elevates property and casualty claim severity. CNA should track federal and state funding streams and FEMA grant programs to map shifting regional risk profiles and pursue public-private partnerships to expand loss control services.
Disaster relief and socialization of risk
Government backstops and disaster aid can crowd out private insurance or blunt pricing signals; US federal disaster assistance averaged about 20 billion USD/year (2010–2019), while the NFIP held roughly 4.7 million policies by 2024, shaping flood risk take-up and terms. CNA must coordinate with public schemes to avoid adverse selection and coverage gaps, and rapidly recalibrate products when policy shifts occur.
- Policy interaction: coordinate with NFIP and state programs
- Adverse selection: monitor take-up and pricing signals
- Product agility: update rates/terms after legislative changes
Tax policy and incentives
Corporate tax policy — US federal rate 21% — plus rules on loss reserve deductibility and investment income taxation materially affect insurer after-tax results and capital deployment.
Tax credits and incentives from the Inflation Reduction Act and related 2023–25 state programs for cyber, resilience, and green investments support product innovation and underwriting of emerging risks.
Unexpected tax changes can force shifts in capital allocation and reinsurance structuring; proactive tax planning helps preserve ROE targets.
- US federal corporate tax rate: 21%
- IRA and state credits bolster green/resilience investment
- Loss reserve deductibility influences taxable income
Regulatory, trade and infrastructure shifts reshape insurance pricing, capital and risk
Political and regulatory shifts (NAIC: 56 jurisdictions; FSOC est. 2010) constrain pricing, capital and compliance; federal/state model changes force product and reserve adjustments. Geopolitical trade ($32T global trade, 2023) and sanctions raise specialty exposures and compliance costs. Infrastructure funding (BIL ≈ $1.2T, 2021) and ASCE gap ($2.59T by 2029) alter regional loss trends; disaster aid (~$20B/yr 2010–2019) and NFIP (≈4.7M policies, 2024) affect private uptake. Corporate tax 21% impacts after-tax returns and capital strategy.
| Metric | Value | Implication |
|---|---|---|
| NAIC jurisdictions | 56 | Regulatory variability |
| Global trade | $32T (2023) | Marine/supply risk |
| BIL | $1.2T (2021) | Mitigation reduces CAT losses |
| Corp tax | 21% | After-tax ROE impact |
What is included in the product
Detailed Word Document
Examines how macro-environmental forces—Political, Economic, Social, Technological, Environmental, and Legal—specifically impact the CNA, combining current data and trend analysis to identify risks and opportunities; tailored for executives and investors, it supports strategic planning, scenario design, and investor-ready reporting.
Customizable Excel Spreadsheet
Condensed CNA PESTLE summary that’s visually segmented and editable—ideal for quick reference in meetings, slide decks, or cross-team briefings to speed decision-making and surface external risks affecting strategy.
Economic factors
Interest rate environment
Investment yields are a key driver of insurer earnings and pricing strategy; with the federal funds target at 5.25–5.50% in mid‑2025, higher short‑term rates materially lift portfolio income for carriers like CNA. Rising rates support higher investment returns but create unrealized mark‑to‑market losses and duration management challenges on long‑dated bonds. CNA must balance asset‑liability matching with return targets, while rate paths drive competitive pricing and growth dynamics.
Inflation and loss cost trends
General and social inflation push up claim severities across commercial lines as CPI rose 3.4% in 2024, increasing baseline loss severity.
Wage growth near 4.0%, medical services CPI +4.2% and elevated vehicle repair costs force faster rate adequacy and tighter terms.
CNA needs robust reserving and claims analytics to avoid reserve drift, as supplier constraints and parts/backlog delays lengthen claim durations and raise expenses.
Economic cycles and business activity
Commercial exposures track payrolls, sales and capital spending—US nonfarm payrolls rose by about 2.74 million in 2023 and real GDP grew 2.5% that year, lifting insured exposure bases. Economic slowdowns compress payrolls and sales, reducing premium growth and raising surety default risk. Expansions enlarge exposures but often trigger competitive pricing pressure. Industry diversification smooths these cycle-driven swings.
Reinsurance capacity and pricing
Global reinsurance pricing rose about 10–20% at 2024 renewals, tightening capacity and pressuring CNAs net retention, capital efficiency and CAT risk appetite. Hard markets lift ceded costs and can force portfolio reshaping; CNA must optimize attachment points and ceded structures to control volatility while monitoring reinsurer credit quality.
- 2024 price rise: ~10–20%
- Impact: lower retention, higher ceded cost
- Action: optimize attachment/ceded structures
- Risk: reinsurer counterparty credit
Credit markets and client solvency
Client bankruptcies elevate claims severity and E&O exposures and stress surety obligations; FDIC and regulators noted rising commercial real estate loan delinquencies through 2023–24, worsening counterparty risk and tightening credit availability. Tight credit can reduce insured values and project starts, pressuring premium volumes; CNA should intensify credit monitoring and underwriting discipline during downturns and deploy tailored risk engineering to bolster client resilience.
- Monitor: strengthen credit surveillance and covenant tracking
- Underwrite: tighten terms on high CRE/supply-chain exposures
- Engineer: offer loss-prevention programs to reduce claims
- Surety: increase collateral/limits on stressed obligors
Regulatory, trade and infrastructure shifts reshape insurance pricing, capital and risk
Higher policy yields (fed funds 5.25–5.50% mid‑2025) boost investment income but raise duration risk; CPI 2024 +3.4% with wage growth ~4.0% and medical CPI +4.2% drive claim severity and faster rate adequacy; reinsurance pricing +10–20% in 2024 tightens capacity and raises ceded costs; CRE delinquencies and tighter credit compress premium growth and elevate counterparty risk.
| Metric | Value |
|---|---|
| Fed funds | 5.25–5.50% (mid‑2025) |
| CPI 2024 | +3.4% |
| Wage growth | ~4.0% |
| Medical CPI | +4.2% |
| Reins. pricing 2024 | +10–20% |
| US real GDP 2023 | +2.5% |
Preview the Actual Deliverable
CNA PESTLE Analysis
The CNA PESTLE Analysis provides a structured review of political, economic, social, technological, legal, and environmental factors affecting CNA. The preview shown here is the exact document you’ll receive after purchase—fully formatted and ready to use. No placeholders or teasers; the file is the final, professionally structured report available for immediate download.











