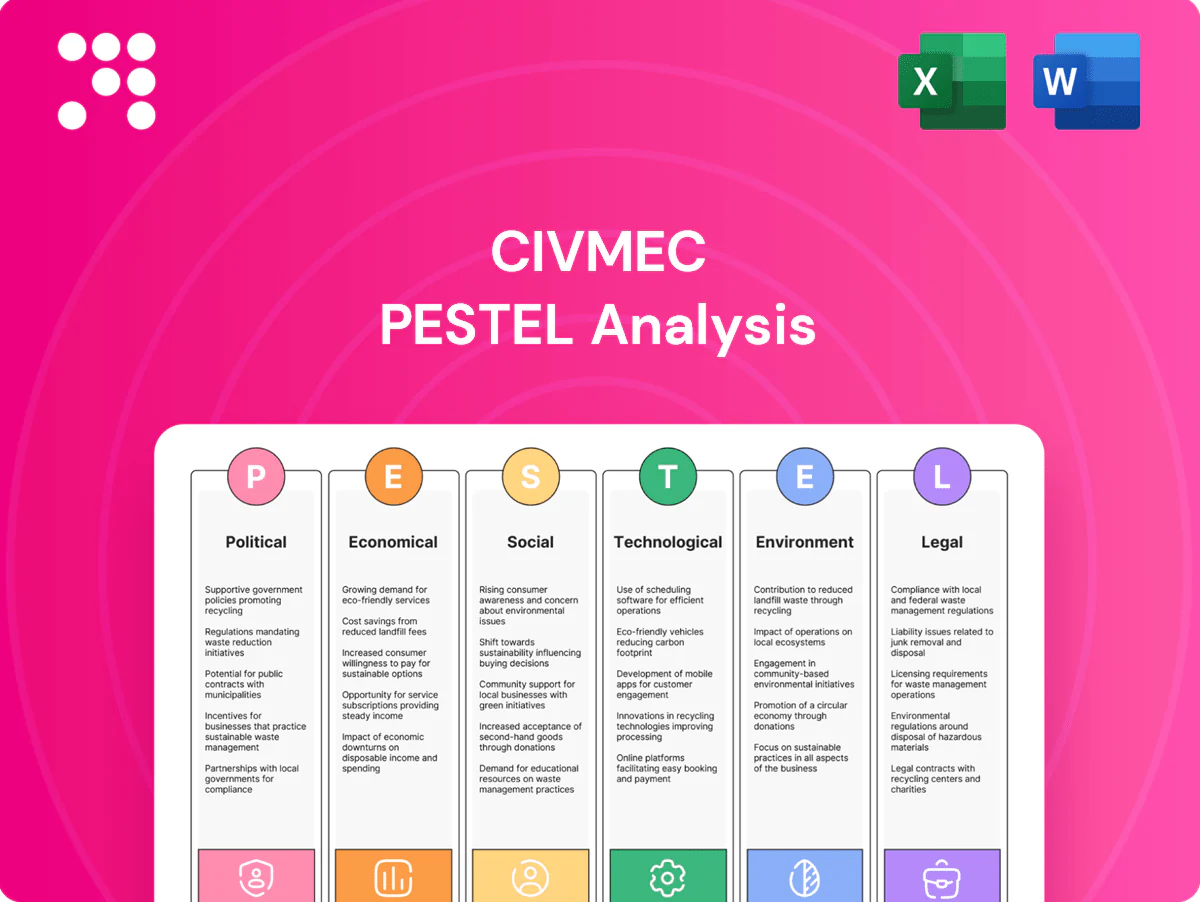
Civmec PESTLE Analysis

Plan Smarter. Present Sharper. Compete Stronger.
Gain a competitive edge with our targeted PESTLE analysis of Civmec, revealing the external forces shaping its strategic outlook. Explore political, economic, social, technological, legal, and environmental factors that could alter risks and opportunities. Purchase the full report to access actionable insights and ready-to-use recommendations for investors and strategists.
Political factors

Australian defence spending and priorities
Australia’s defence budget rose to about A$59.3 billion in 2024–25, with major naval shipbuilding programs underpinning higher yard utilisation and a stronger Civmec order book; continuous ship sustainment and Collins/SSN-AUKUS preparatory work represent multi-year revenue streams. AUKUS-related fabrication and sustainment workstreams could expand Civmec’s scope into higher-complexity steel and systems integration. Policy continuity across elections is critical for program timing; delays or reprioritisation would shift revenue recognition and capacity planning.
Infrastructure stimulus and public procurement
Federal and state infrastructure pipelines exceeding A$100 billion underpin SMP, civil and precast demand, with many programs running 5–10 year horizons. Periodic fiscal shifts and cost reviews have recently reprofilied projects, delaying spend and altering cashflow. Local procurement and social‑value criteria (often up to 10% tender weighting) raise competitiveness for regional suppliers. Transparent tender rules are critical to justify 5–7 year capacity investments.

Resources and energy policy settings
Approvals, royalties and decarbonisation mandates materially alter miners and energy clients capital spend, driving scope changes and schedule risk that can reduce near-term tendering and defer FIDs. Support for critical minerals — backed by Australia’s A$2 billion Critical Minerals initiatives — plus LNG and renewables policy steers Civmec toward mine-site, LNG and green energy projects. Grid and transmission policy and funding unlock large civil and structural works, while policy uncertainty can push clients to delay FIDs, compressing backlog visibility and cashflow.

Trade relations and market access
Australia–Singapore ties and regional pacts (RCEP: 15 members; CPTPP: 11 members) ease cross-border sourcing and deployment, with Australia–Singapore two-way trade around A$26.6bn in 2022–23 supporting Civmec supply chains. Geopolitical frictions with major suppliers can disrupt steel and equipment imports, causing raw‑material price and lead‑time spikes. Tariffs or sanctions would materially alter cost structures and schedules; stable diplomacy underpins predictable supply and client investment.
- RCEP: 15 members
- CPTPP: 11 members
- A$26.6bn Australia–Singapore trade (2022–23)
- Tariffs/sanctions = higher costs, delays
Local content and sovereign capability agendas
Government emphasis on domestic manufacturing and shipbuilding favors Australian fabricators like Civmec, supported by a 2024–25 defence budget of about A$52.7bn and a 22-item Sovereign Industrial Capability Priorities list that steers procurement toward local yards.
- Local wins: offsets can channel subcontracting to qualified yards
- Competitive edge: compliance/reporting raises costs but differentiates Civmec
- Risk: policy drift may widen or narrow eligible scopes over time
Defence A$59.3bn and infra > A$100bn drive naval fabrication; AUKUS raises complexity
Rising 2024–25 defence spend (A$59.3bn) and shipbuilding programs drive multi‑year naval fabrication and sustainment work for Civmec, while AUKUS expands higher‑complexity scope. Federal/state A$100bn+ infrastructure pipelines and A$2bn Critical Minerals funding steer civil, precast and mine‑site demand. Local procurement/Sovereign Industrial Capability (22 items) and Australia–Singapore trade (A$26.6bn) favor domestic yards but geopolitical supply risks raise costs and delays.
| Metric | 2024/25 value |
|---|---|
| Defence budget | A$59.3bn |
| Infra pipelines | >A$100bn |
| Critical Minerals fund | A$2bn |
| Aus–SG trade (2022–23) | A$26.6bn |
What is included in the product
 Detailed Word Document
Offers a concise PESTLE review showing how political, economic, social, technological, environmental and legal forces shape Civmec’s operations and strategy, with data‑backed trends, industry‑specific examples and forward‑looking insights to support executive decision‑making, funding pitches and scenario planning.

 Customizable Excel Spreadsheet
Civmec PESTLE provides a concise, visually segmented summary of external risks and opportunities, easily dropped into presentations or shared for quick team alignment.
Economic factors

Commodity and capex cycles
Iron ore (~USD120/t mid‑2024), LNG JKM spot (~USD12/MMBtu) and critical mineral prices (eg. lithium carbonate ~USD20,000/t) strongly drive client capex and project approvals; price upswings boost SMP and modularisation demand while downturns compress pipelines. Civmec must flex labour and yard capacity to prevent margin erosion, and diversification across energy, defence and infrastructure smooths revenue volatility.
Inflation, interest rates, and input costs
Materials, labour and energy inflation have pressured fixed-price Civmec contracts, with Australian CPI around 3.9% YoY (mid-2025) while construction wage growth ran near 6% in 2024, squeezing margins. Central bank policy — RBA cash rate about 4.35% in July 2025 — elevates client WACC and can delay final investment decisions. Escalation clauses and hedging of steel and fuel are essential to protect margins. Strategic procurement timing and deep supplier partnerships reduce input volatility and delivery risk.

Currency movements (AUD, SGD, USD)
Movements in AUD, SGD and USD drive imported steel and equipment costs and shape Civmec’s export competitiveness; AUD has traded near 0.63 USD and SGD near 0.73 USD in mid-2025, lifting USD-priced input costs. USD-linked energy and defence contracts provide partial natural hedges for revenue streams denominated in USD. Where contract and cost currencies mismatch, active hedging policies and FX risk limits are required. FX shifts also affect translation of Singapore operations into AUD.

Labour market tightness and wages
Skilled-trades shortages increase Civmec's labour costs and schedule risk as competing megaprojects in resource states bid up pay; Australia’s Wage Price Index rose about 4.1% year to June 2024 while unemployment sat near 3.8%, tightening supply. Expanding apprenticeships and deploying productivity tools can partly offset margin pressure, but poor labour availability can cap revenue even with strong project demand.
- Skilled shortages: raises costs/schedule risk
- WPI ~4.1% y/y (Jun 2024)
- Unemployment ~3.8% tight market
- Apprenticeships + tech = partial mitigation
- Labour constraints can cap revenue
Supply chain reliability and logistics
Global container spot rates fell roughly 60% from 2021 peaks by mid-2024, shortening lead-time uncertainty but schedules for Civmec modules and precast still hinge on shipment windows and factory capacity.
Nearshoring and dual-sourcing adopted across construction supply chains in 2023–24 have materially improved resilience and cut transit time variance; inventory buffering trades higher working capital for delivery certainty.
Port congestion or disruptions can add 7–14 days to pipelines and cascade into contractual penalties and delay claims for large modular projects.
- shipping-rate decline ~60% vs 2021
- nearshoring/dual-sourcing reduces transit variance
- inventory raises working capital but secures delivery
- port delays add 7–14 days, risk penalties
Defence A$59.3bn and infra > A$100bn drive naval fabrication; AUKUS raises complexity
Commodity and energy price swings (iron ore ~USD120/t mid‑2024; JKM ~USD12/MMBtu) drive client capex and modular demand, requiring flexible yard/labour capacity. Inflation and wages (CPI ~3.9% mid‑2025; WPI ~4.1% Jun‑24) plus RBA cash rate ~4.35% (Jul‑2025) squeeze margins on fixed‑price contracts. FX (AUD ~0.63 USD mid‑2025) and shipping lead times (container rates -60% vs 2021) affect input costs and delivery risk.
| Metric | Value |
|---|---|
| Iron ore | ~USD120/t (mid‑2024) |
| JKM | ~USD12/MMBtu |
| CPI | ~3.9% (mid‑2025) |
| RBA rate | ~4.35% (Jul‑2025) |
| AUD/USD | ~0.63 (mid‑2025) |
Same Document Delivered
Civmec PESTLE Analysis
The preview shown here is the exact Civmec PESTLE Analysis you’ll receive after purchase—fully formatted and ready to use. The content, layout, and structure visible in this sample are the finished document you’ll download instantly after payment. No placeholders or teasers—this is the real, professionally prepared file.

Product Information
Product Information
Shipping & Returns
Shipping & Returns
Description
Plan Smarter. Present Sharper. Compete Stronger.
Gain a competitive edge with our targeted PESTLE analysis of Civmec, revealing the external forces shaping its strategic outlook. Explore political, economic, social, technological, legal, and environmental factors that could alter risks and opportunities. Purchase the full report to access actionable insights and ready-to-use recommendations for investors and strategists.
Political factors
Australian defence spending and priorities
Australia’s defence budget rose to about A$59.3 billion in 2024–25, with major naval shipbuilding programs underpinning higher yard utilisation and a stronger Civmec order book; continuous ship sustainment and Collins/SSN-AUKUS preparatory work represent multi-year revenue streams. AUKUS-related fabrication and sustainment workstreams could expand Civmec’s scope into higher-complexity steel and systems integration. Policy continuity across elections is critical for program timing; delays or reprioritisation would shift revenue recognition and capacity planning.
Infrastructure stimulus and public procurement
Federal and state infrastructure pipelines exceeding A$100 billion underpin SMP, civil and precast demand, with many programs running 5–10 year horizons. Periodic fiscal shifts and cost reviews have recently reprofilied projects, delaying spend and altering cashflow. Local procurement and social‑value criteria (often up to 10% tender weighting) raise competitiveness for regional suppliers. Transparent tender rules are critical to justify 5–7 year capacity investments.
Resources and energy policy settings
Approvals, royalties and decarbonisation mandates materially alter miners and energy clients capital spend, driving scope changes and schedule risk that can reduce near-term tendering and defer FIDs. Support for critical minerals — backed by Australia’s A$2 billion Critical Minerals initiatives — plus LNG and renewables policy steers Civmec toward mine-site, LNG and green energy projects. Grid and transmission policy and funding unlock large civil and structural works, while policy uncertainty can push clients to delay FIDs, compressing backlog visibility and cashflow.
Trade relations and market access
Australia–Singapore ties and regional pacts (RCEP: 15 members; CPTPP: 11 members) ease cross-border sourcing and deployment, with Australia–Singapore two-way trade around A$26.6bn in 2022–23 supporting Civmec supply chains. Geopolitical frictions with major suppliers can disrupt steel and equipment imports, causing raw‑material price and lead‑time spikes. Tariffs or sanctions would materially alter cost structures and schedules; stable diplomacy underpins predictable supply and client investment.
- RCEP: 15 members
- CPTPP: 11 members
- A$26.6bn Australia–Singapore trade (2022–23)
- Tariffs/sanctions = higher costs, delays
Local content and sovereign capability agendas
Government emphasis on domestic manufacturing and shipbuilding favors Australian fabricators like Civmec, supported by a 2024–25 defence budget of about A$52.7bn and a 22-item Sovereign Industrial Capability Priorities list that steers procurement toward local yards.
- Local wins: offsets can channel subcontracting to qualified yards
- Competitive edge: compliance/reporting raises costs but differentiates Civmec
- Risk: policy drift may widen or narrow eligible scopes over time
Defence A$59.3bn and infra > A$100bn drive naval fabrication; AUKUS raises complexity
Rising 2024–25 defence spend (A$59.3bn) and shipbuilding programs drive multi‑year naval fabrication and sustainment work for Civmec, while AUKUS expands higher‑complexity scope. Federal/state A$100bn+ infrastructure pipelines and A$2bn Critical Minerals funding steer civil, precast and mine‑site demand. Local procurement/Sovereign Industrial Capability (22 items) and Australia–Singapore trade (A$26.6bn) favor domestic yards but geopolitical supply risks raise costs and delays.
| Metric | 2024/25 value |
|---|---|
| Defence budget | A$59.3bn |
| Infra pipelines | >A$100bn |
| Critical Minerals fund | A$2bn |
| Aus–SG trade (2022–23) | A$26.6bn |
What is included in the product
Detailed Word Document
Offers a concise PESTLE review showing how political, economic, social, technological, environmental and legal forces shape Civmec’s operations and strategy, with data‑backed trends, industry‑specific examples and forward‑looking insights to support executive decision‑making, funding pitches and scenario planning.
Customizable Excel Spreadsheet
Civmec PESTLE provides a concise, visually segmented summary of external risks and opportunities, easily dropped into presentations or shared for quick team alignment.
Economic factors
Commodity and capex cycles
Iron ore (~USD120/t mid‑2024), LNG JKM spot (~USD12/MMBtu) and critical mineral prices (eg. lithium carbonate ~USD20,000/t) strongly drive client capex and project approvals; price upswings boost SMP and modularisation demand while downturns compress pipelines. Civmec must flex labour and yard capacity to prevent margin erosion, and diversification across energy, defence and infrastructure smooths revenue volatility.
Inflation, interest rates, and input costs
Materials, labour and energy inflation have pressured fixed-price Civmec contracts, with Australian CPI around 3.9% YoY (mid-2025) while construction wage growth ran near 6% in 2024, squeezing margins. Central bank policy — RBA cash rate about 4.35% in July 2025 — elevates client WACC and can delay final investment decisions. Escalation clauses and hedging of steel and fuel are essential to protect margins. Strategic procurement timing and deep supplier partnerships reduce input volatility and delivery risk.
Currency movements (AUD, SGD, USD)
Movements in AUD, SGD and USD drive imported steel and equipment costs and shape Civmec’s export competitiveness; AUD has traded near 0.63 USD and SGD near 0.73 USD in mid-2025, lifting USD-priced input costs. USD-linked energy and defence contracts provide partial natural hedges for revenue streams denominated in USD. Where contract and cost currencies mismatch, active hedging policies and FX risk limits are required. FX shifts also affect translation of Singapore operations into AUD.
Labour market tightness and wages
Skilled-trades shortages increase Civmec's labour costs and schedule risk as competing megaprojects in resource states bid up pay; Australia’s Wage Price Index rose about 4.1% year to June 2024 while unemployment sat near 3.8%, tightening supply. Expanding apprenticeships and deploying productivity tools can partly offset margin pressure, but poor labour availability can cap revenue even with strong project demand.
- Skilled shortages: raises costs/schedule risk
- WPI ~4.1% y/y (Jun 2024)
- Unemployment ~3.8% tight market
- Apprenticeships + tech = partial mitigation
- Labour constraints can cap revenue
Supply chain reliability and logistics
Global container spot rates fell roughly 60% from 2021 peaks by mid-2024, shortening lead-time uncertainty but schedules for Civmec modules and precast still hinge on shipment windows and factory capacity.
Nearshoring and dual-sourcing adopted across construction supply chains in 2023–24 have materially improved resilience and cut transit time variance; inventory buffering trades higher working capital for delivery certainty.
Port congestion or disruptions can add 7–14 days to pipelines and cascade into contractual penalties and delay claims for large modular projects.
- shipping-rate decline ~60% vs 2021
- nearshoring/dual-sourcing reduces transit variance
- inventory raises working capital but secures delivery
- port delays add 7–14 days, risk penalties
Defence A$59.3bn and infra > A$100bn drive naval fabrication; AUKUS raises complexity
Commodity and energy price swings (iron ore ~USD120/t mid‑2024; JKM ~USD12/MMBtu) drive client capex and modular demand, requiring flexible yard/labour capacity. Inflation and wages (CPI ~3.9% mid‑2025; WPI ~4.1% Jun‑24) plus RBA cash rate ~4.35% (Jul‑2025) squeeze margins on fixed‑price contracts. FX (AUD ~0.63 USD mid‑2025) and shipping lead times (container rates -60% vs 2021) affect input costs and delivery risk.
| Metric | Value |
|---|---|
| Iron ore | ~USD120/t (mid‑2024) |
| JKM | ~USD12/MMBtu |
| CPI | ~3.9% (mid‑2025) |
| RBA rate | ~4.35% (Jul‑2025) |
| AUD/USD | ~0.63 (mid‑2025) |
Same Document Delivered
Civmec PESTLE Analysis
The preview shown here is the exact Civmec PESTLE Analysis you’ll receive after purchase—fully formatted and ready to use. The content, layout, and structure visible in this sample are the finished document you’ll download instantly after payment. No placeholders or teasers—this is the real, professionally prepared file.











