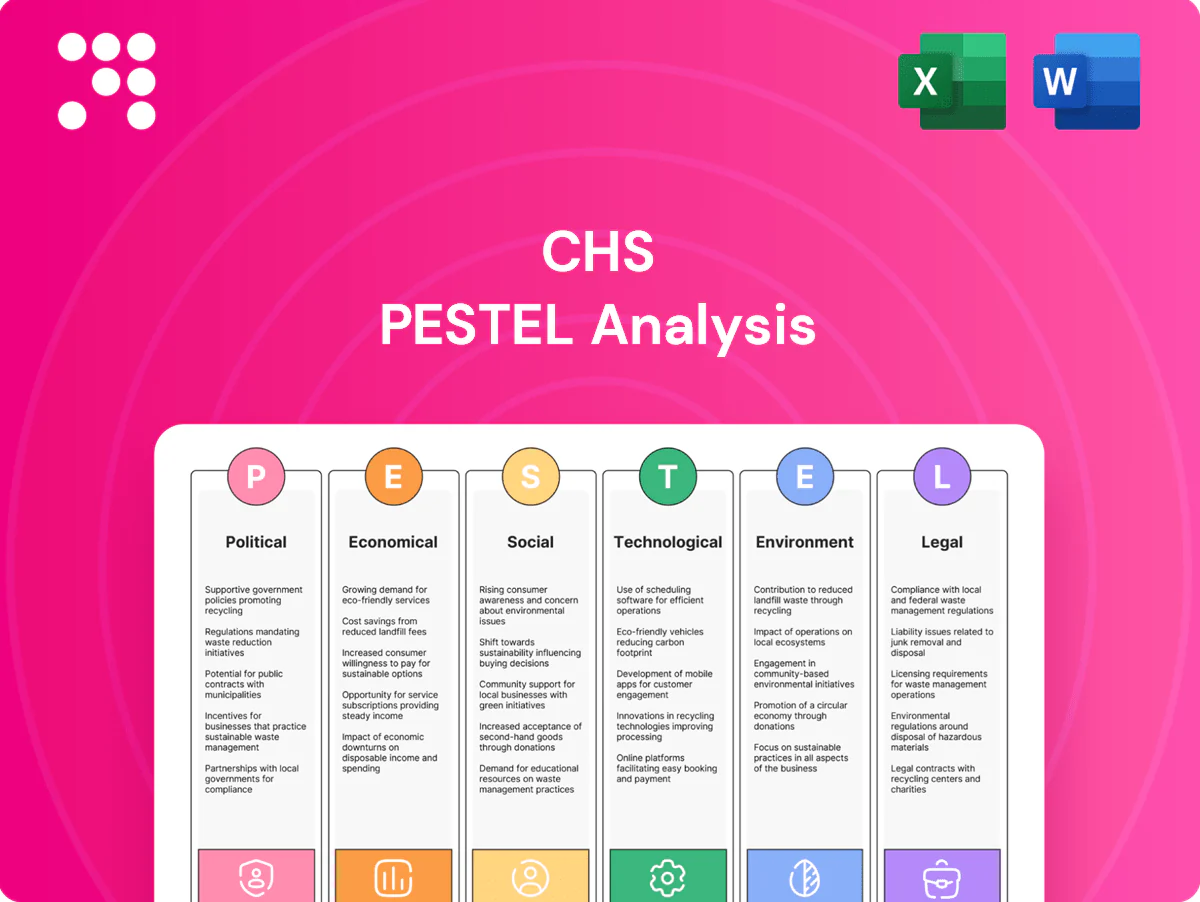
CHS PESTLE Analysis

Your Competitive Advantage Starts with This Report
Unlock strategic clarity with our CHS PESTLE Analysis — concise, expert-led insight into the political, economic, social, technological, legal, and environmental forces shaping CHS. Perfect for investors, advisors, and strategists who need fast, reliable context. Purchase the full report for the complete, ready-to-use breakdown and actionable recommendations.
Political factors

U.S. farm bill and subsidies
U.S. farm bill supports, crop insurance (federal premium subsidy ~62%, ~$10–12B program cost annually) and conservation programs shape planting incentives and CHS demand mix by altering crop profitability and input use. Renewal timing and policy shifts drive member cash flow variability and credit needs. Program design influences fertilizer demand and grain origination volumes, while cooperative-specific provisions affect patronage allocations and governance power.
Renewable fuel standards
RFS and state LCFS mandates drive ethanol and renewable diesel economics: EPA set the 2024 RVO at 20.84 billion gallons, while California LCFS credits averaged roughly $140/MT in 2024, materially supporting renewable diesel margins. Policy clarity affects CHS energy blending, crush margins, and feedstock procurement by determining blending demand and RIN/credit values. Waivers or quota changes can swing margins quickly, and cross-party dynamics introduce compliance cost uncertainty.

Trade policy and tariffs
Tariffs, quotas and SPS rules directly shape export flows for grains, oilseeds and fertilizers; e.g., China imported about 92 Mt of soybeans in 2023/24 while Mexico imported ~14.5 Mt of corn in 2023, making access critical for basis and elevation margins. Retaliatory measures can strand inventory and increase storage pressure and costs, and government export credits and diplomacy (trade finance lines) materially speed or slow sales velocity.

Geopolitical supply disruptions
Conflicts in the Black Sea or Middle East reroute freight and grain flows, noting Russia and Ukraine supplied roughly 30% of global wheat and about 20% of maize pre-2022, amplifying market volatility and basis shifts in CHS regions. Sanctions regimes reweight origination and counterparty risk, while elevated war premiums and freight insurance materially raise landed costs. Policy-driven corridor openings or closures abruptly change local basis and logistics costs.
- Black Sea ~30% wheat, ~20% maize (pre-2022)
- Sanctions increase counterparty risk and rerouting
- War premiums raise landed costs
- Corridor policy shifts alter regional basis
Rural infrastructure funding
Federal spending under the Bipartisan Infrastructure Law committed about 17 billion dollars for ports, waterways and coastal resilience and BEAD allocates 42.45 billion dollars for broadband, and these flows directly affect CHS throughput, demurrage exposure and members’ digital adoption.
- Rails/locks/ports funding: BIL ~17B
- Broadband: BEAD 42.45B
- Permitting: multi-year timelines affect terminal expansion
- Rural political focus: drives CHS capital planning
Farm bill 62% subsidy + RFS 20.84B gal boost biofuels
Farm bill supports (federal crop‑insurance premium subsidy ~62%, program cost ~$10–12B/yr) shape planting incentives, margins and member credit; RFS RVO 2024 at 20.84B gallons and CA LCFS credits ~140 $/MT (2024) materially boost biofuel economics; trade barriers, sanctions and Black Sea disruption (pre‑2022 ~30% wheat, ~20% maize) shift basis and logistics; BIL ports $17B and BEAD $42.45B change throughput and digital adoption.
| Policy | Key 2024/25 Metric |
|---|---|
| Crop insurance | ~62% subsidy; $10–12B/yr |
| RFS/LCFS | RVO 20.84B gal; LCFS ~140 $/MT |
| Black Sea supply | ~30% wheat; ~20% maize (pre‑2022) |
| Infrastructure | BIL $17B ports; BEAD $42.45B |
What is included in the product
 Detailed Word Document
Explores how external macro-environmental factors uniquely affect CHS across Political, Economic, Social, Technological, Environmental and Legal dimensions, with data-backed, region-specific insights and forward-looking analysis to help executives, investors and entrepreneurs identify risks, opportunities and strategic responses.

 Customizable Excel Spreadsheet
Clean, visually segmented CHS PESTLE summary that condenses external risks and opportunities into editable, shareable slides or notes for quick alignment across teams and streamlined decision-making during planning sessions.
Economic factors

Commodity price volatility
Grain, oilseed, fertilizer and energy swings create material margin upside and downside for CHS; after 2022 peaks the FAO Cereal Price Index fell roughly 18% through 2024, while fertilizer benchmark indexes retraced about 25% from 2022 highs, reopening margin pressure and opportunity.
Volatility raises hedging and working capital needs as CHS must cover larger forward positions and inventory financing during wide price ranges.
Basis and carry dynamics now drive storage returns more than spot moves, and multiyear price cycles continue to shape member buying and selling timing and cooperative procurement strategies.
Interest rates and credit
Higher rates (fed funds ≈5.25% in 2024–25, 10yr ≈4.2%) lift CHS inventory financing and member lending costs—U.S. farm operating loan rates averaged about 7–8% in 2024—while tight credit can delay input purchases and capital projects. Rate cuts would likely expand planting and upgrade cycles. Treasury and liquidity management therefore become margin-critical for CHS.

Exchange rates
A strong dollar (U.S. dollar index around 105 mid-2025) dampens U.S. export competitiveness for CHS-originated grain versus competitors, widening basis pressures. Currency swings alter imported fertilizer and energy costs—global potash fell ~15% in 2024 while Brent crude averaged ~$80/bbl in 2024–25—raising input cost volatility. Hedging effectiveness and counterparty exposure need constant monitoring because FX moves directly affect cooperative patronage distributions.

Freight and logistics costs
Freight and logistics costs materially affect CHS margins: rail tariffs and barge rates set by Class I carriers and tow operators, plus trucking availability, dictate elevator spreads—2024–25 supply-chain tightness elevated inland basis intermittently. Low Mississippi River levels and periodic rail congestion have produced sharp cost spikes during 2023–24 harvest windows. Fuel price trends through 2024 showed diesel easing from 2022 peaks, but fuel remains a significant driver of transport and farmer input costs; logistics efficiency is therefore a primary profit lever for CHS networks.
- Rail tariffs and congestion — upswing pressure on elevator margins
- Barge rates impacted by Mississippi low-water and seasonality
- Diesel/input cost correlation — logistics efficiency = margin control
Global demand cycles
- Asia/LatAm demand: high-volume drivers
- China soybean imports ~100 Mt (2023/24)
- Biofuel scale: US ethanol ~16bn gal (2023)
- Recession risk: trims discretionary consumption
- Population: ~8.5bn by 2030 supports grain flows
Farm bill 62% subsidy + RFS 20.84B gal boost biofuels
Commodity and input price swings (FAO cereals -18% from 2022 to 2024; fertilizers -25%) drive CHS margin volatility and working-capital needs. Higher rates (fed funds ≈5.25%, 10yr ≈4.2%) raise inventory financing costs while USD strength (DXY ≈105 mid-2025) pressures export basis. Freight/logistics disruptions and China soy imports (~100 Mt 2023/24) shape volumes and spreads.
| Indicator | 2024–25 | Impact |
|---|---|---|
| FAO Cereal Index | -18% vs 2022 | Margin volatility |
| Fertilizer indexes | -25% vs 2022 | Input cost swings |
| Fed funds / 10yr | ≈5.25% / ≈4.2% | Financing costs |
| DXY | ≈105 | Export basis pressure |
| China soy | ~100 Mt (23/24) | Trade volumes |
What You See Is What You Get
CHS PESTLE Analysis
The CHS PESTLE Analysis preview shown here is the exact document you’ll receive after purchase—fully formatted and ready to use. The layout, content, and structure visible are identical to the downloadable file, with no placeholders or surprises. After payment you’ll instantly receive this final, professionally structured report.

Product Information
Product Information
Shipping & Returns
Shipping & Returns
Description
Your Competitive Advantage Starts with This Report
Unlock strategic clarity with our CHS PESTLE Analysis — concise, expert-led insight into the political, economic, social, technological, legal, and environmental forces shaping CHS. Perfect for investors, advisors, and strategists who need fast, reliable context. Purchase the full report for the complete, ready-to-use breakdown and actionable recommendations.
Political factors
U.S. farm bill and subsidies
U.S. farm bill supports, crop insurance (federal premium subsidy ~62%, ~$10–12B program cost annually) and conservation programs shape planting incentives and CHS demand mix by altering crop profitability and input use. Renewal timing and policy shifts drive member cash flow variability and credit needs. Program design influences fertilizer demand and grain origination volumes, while cooperative-specific provisions affect patronage allocations and governance power.
Renewable fuel standards
RFS and state LCFS mandates drive ethanol and renewable diesel economics: EPA set the 2024 RVO at 20.84 billion gallons, while California LCFS credits averaged roughly $140/MT in 2024, materially supporting renewable diesel margins. Policy clarity affects CHS energy blending, crush margins, and feedstock procurement by determining blending demand and RIN/credit values. Waivers or quota changes can swing margins quickly, and cross-party dynamics introduce compliance cost uncertainty.
Trade policy and tariffs
Tariffs, quotas and SPS rules directly shape export flows for grains, oilseeds and fertilizers; e.g., China imported about 92 Mt of soybeans in 2023/24 while Mexico imported ~14.5 Mt of corn in 2023, making access critical for basis and elevation margins. Retaliatory measures can strand inventory and increase storage pressure and costs, and government export credits and diplomacy (trade finance lines) materially speed or slow sales velocity.
Geopolitical supply disruptions
Conflicts in the Black Sea or Middle East reroute freight and grain flows, noting Russia and Ukraine supplied roughly 30% of global wheat and about 20% of maize pre-2022, amplifying market volatility and basis shifts in CHS regions. Sanctions regimes reweight origination and counterparty risk, while elevated war premiums and freight insurance materially raise landed costs. Policy-driven corridor openings or closures abruptly change local basis and logistics costs.
- Black Sea ~30% wheat, ~20% maize (pre-2022)
- Sanctions increase counterparty risk and rerouting
- War premiums raise landed costs
- Corridor policy shifts alter regional basis
Rural infrastructure funding
Federal spending under the Bipartisan Infrastructure Law committed about 17 billion dollars for ports, waterways and coastal resilience and BEAD allocates 42.45 billion dollars for broadband, and these flows directly affect CHS throughput, demurrage exposure and members’ digital adoption.
- Rails/locks/ports funding: BIL ~17B
- Broadband: BEAD 42.45B
- Permitting: multi-year timelines affect terminal expansion
- Rural political focus: drives CHS capital planning
Farm bill 62% subsidy + RFS 20.84B gal boost biofuels
Farm bill supports (federal crop‑insurance premium subsidy ~62%, program cost ~$10–12B/yr) shape planting incentives, margins and member credit; RFS RVO 2024 at 20.84B gallons and CA LCFS credits ~140 $/MT (2024) materially boost biofuel economics; trade barriers, sanctions and Black Sea disruption (pre‑2022 ~30% wheat, ~20% maize) shift basis and logistics; BIL ports $17B and BEAD $42.45B change throughput and digital adoption.
| Policy | Key 2024/25 Metric |
|---|---|
| Crop insurance | ~62% subsidy; $10–12B/yr |
| RFS/LCFS | RVO 20.84B gal; LCFS ~140 $/MT |
| Black Sea supply | ~30% wheat; ~20% maize (pre‑2022) |
| Infrastructure | BIL $17B ports; BEAD $42.45B |
What is included in the product
Detailed Word Document
Explores how external macro-environmental factors uniquely affect CHS across Political, Economic, Social, Technological, Environmental and Legal dimensions, with data-backed, region-specific insights and forward-looking analysis to help executives, investors and entrepreneurs identify risks, opportunities and strategic responses.
Customizable Excel Spreadsheet
Clean, visually segmented CHS PESTLE summary that condenses external risks and opportunities into editable, shareable slides or notes for quick alignment across teams and streamlined decision-making during planning sessions.
Economic factors
Commodity price volatility
Grain, oilseed, fertilizer and energy swings create material margin upside and downside for CHS; after 2022 peaks the FAO Cereal Price Index fell roughly 18% through 2024, while fertilizer benchmark indexes retraced about 25% from 2022 highs, reopening margin pressure and opportunity.
Volatility raises hedging and working capital needs as CHS must cover larger forward positions and inventory financing during wide price ranges.
Basis and carry dynamics now drive storage returns more than spot moves, and multiyear price cycles continue to shape member buying and selling timing and cooperative procurement strategies.
Interest rates and credit
Higher rates (fed funds ≈5.25% in 2024–25, 10yr ≈4.2%) lift CHS inventory financing and member lending costs—U.S. farm operating loan rates averaged about 7–8% in 2024—while tight credit can delay input purchases and capital projects. Rate cuts would likely expand planting and upgrade cycles. Treasury and liquidity management therefore become margin-critical for CHS.
Exchange rates
A strong dollar (U.S. dollar index around 105 mid-2025) dampens U.S. export competitiveness for CHS-originated grain versus competitors, widening basis pressures. Currency swings alter imported fertilizer and energy costs—global potash fell ~15% in 2024 while Brent crude averaged ~$80/bbl in 2024–25—raising input cost volatility. Hedging effectiveness and counterparty exposure need constant monitoring because FX moves directly affect cooperative patronage distributions.
Freight and logistics costs
Freight and logistics costs materially affect CHS margins: rail tariffs and barge rates set by Class I carriers and tow operators, plus trucking availability, dictate elevator spreads—2024–25 supply-chain tightness elevated inland basis intermittently. Low Mississippi River levels and periodic rail congestion have produced sharp cost spikes during 2023–24 harvest windows. Fuel price trends through 2024 showed diesel easing from 2022 peaks, but fuel remains a significant driver of transport and farmer input costs; logistics efficiency is therefore a primary profit lever for CHS networks.
- Rail tariffs and congestion — upswing pressure on elevator margins
- Barge rates impacted by Mississippi low-water and seasonality
- Diesel/input cost correlation — logistics efficiency = margin control
Global demand cycles
- Asia/LatAm demand: high-volume drivers
- China soybean imports ~100 Mt (2023/24)
- Biofuel scale: US ethanol ~16bn gal (2023)
- Recession risk: trims discretionary consumption
- Population: ~8.5bn by 2030 supports grain flows
Farm bill 62% subsidy + RFS 20.84B gal boost biofuels
Commodity and input price swings (FAO cereals -18% from 2022 to 2024; fertilizers -25%) drive CHS margin volatility and working-capital needs. Higher rates (fed funds ≈5.25%, 10yr ≈4.2%) raise inventory financing costs while USD strength (DXY ≈105 mid-2025) pressures export basis. Freight/logistics disruptions and China soy imports (~100 Mt 2023/24) shape volumes and spreads.
| Indicator | 2024–25 | Impact |
|---|---|---|
| FAO Cereal Index | -18% vs 2022 | Margin volatility |
| Fertilizer indexes | -25% vs 2022 | Input cost swings |
| Fed funds / 10yr | ≈5.25% / ≈4.2% | Financing costs |
| DXY | ≈105 | Export basis pressure |
| China soy | ~100 Mt (23/24) | Trade volumes |
What You See Is What You Get
CHS PESTLE Analysis
The CHS PESTLE Analysis preview shown here is the exact document you’ll receive after purchase—fully formatted and ready to use. The layout, content, and structure visible are identical to the downloadable file, with no placeholders or surprises. After payment you’ll instantly receive this final, professionally structured report.











