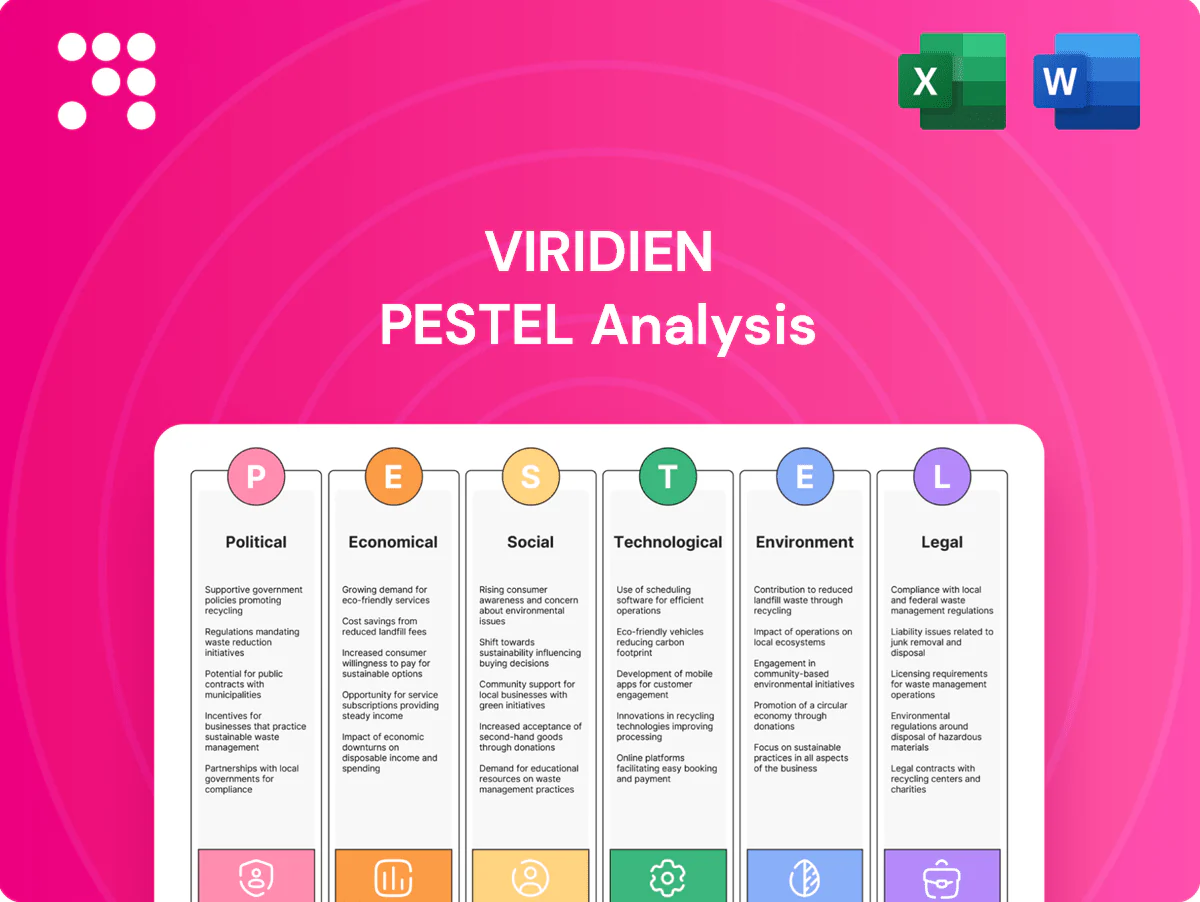
Viridien PESTLE Analysis

Your Shortcut to Market Insight Starts Here
Gain a strategic advantage with our tailored PESTLE analysis of Viridien—spot regulatory threats, economic drivers, and technological shifts shaping its future. This concise briefing highlights opportunities and risks; buy the full PESTLE to access detailed, ready-to-use intelligence and forecasts. Get your copy now.
Political factors

Energy policy volatility
Shifts in national energy strategies directly affect demand for Viridien’s subsurface imaging, CCS, geothermal and wind-siting work; global wind capacity reached about 840 GW and geothermal ~17 GW while operational CCS was ~50 MtCO2/yr (Global CCS Institute/IRENA, 2023–24), shaping market size. Elections and coalition changes can rapidly reallocate transition budgets—US IRA deploys roughly $369 billion for clean energy incentives—speeding or stalling projects. Viridien benefits from pro-transition incentives but faces revenue swings if hydrocarbons regain priority; scenario planning and diversified end-markets hedge policy risk.
Geopolitical tensions
Geopolitical tensions—sanctions, conflicts and maritime disputes—have disrupted offshore campaigns and data acquisition, with the International Maritime Bureau reporting 132 piracy/armed robbery incidents in 2023 that complicate field operations. Access to certain basins or clients can be restricted, delaying projects and receivables; the UN maintained 14 active sanctions regimes in 2024 that affect cross-border work. Diversified geographic exposure and remote delivery reduce but do not eliminate this risk. Robust insurance, partner vetting and contingency logistics remain critical to mitigate financial and operational impacts.

Public funding & infrastructure agendas
Government-backed programs (EU NextGenerationEU ~€800bn, US Infrastructure Law ~$1.2tn) are driving growth in monitoring and environmental services spend, unlocking tender opportunities. Winning grants/tenders requires compliance, local presence and measurable social benefits; long approval cycles create multi-quarter backlog timing risks. Aligning with national resilience and climate adaptation priorities improves pipeline visibility and win rates.

Trade policy & export controls
Advanced sensing, HPC, and certain software are covered by tightened export controls after US Commerce actions in 2023 and follow‑on measures in 2024; compliance drives delivery delays, hardware substitutions, and data‑residency changes. Supply‑chain rerouting and licensing increase cost and complexity, often adding low‑single to double‑digit percent budget impacts. Early screening and modular architectures materially reduce disruption.
- 2023 US Commerce expansion covers HPC and related software
- Compliance affects timelines, hardware selection, and data residency
- Routing/licensing can add low‑single to double‑digit % costs
- Early screening and modular design mitigate risk
ESG-driven procurement
Public and quasi-public buyers increasingly embed ESG criteria into awards, with public procurement representing roughly 12–15% of GDP in many OECD economies and thus a major market lever. Low-carbon operations, transparency and measurable community impact now influence win rates, so Viridien’s transition positioning helps score higher but requires quantified KPIs (emissions intensity, % local hiring). Third-party ratings and assurance act as growing commercial differentiators.
- procurement share: 12–15% GDP
- KPI examples: tCO2e/€ revenue, % local employment
- assurance: third-party ratings boost bid competitiveness
Policy shifts + IRA $369bn boost demand; sanctions, piracy, export controls add timing risk
National energy policy shifts (global wind ~840 GW, geothermal ~17 GW, CCS ~50 MtCO2/yr) and US IRA ~$369bn drive demand but create political timing risk; elections can reallocate funds. Geopolitics, sanctions (14 active, 2024) and 132 piracy incidents (2023) disrupt fieldwork. Export controls on HPC/software raise costs; public procurement ~12–15% GDP favors ESG-compliant bids.
| Factor | Key metric |
|---|---|
| Energy market | Wind 840 GW; Geothermal 17 GW; CCS 50 MtCO2/yr |
| Funding | US IRA $369bn; EU NextGen €800bn; US Infra ~$1.2tn |
| Risk | 14 sanctions (2024); 132 piracy (2023) |
| Procurement | 12–15% GDP; ESG KPIs |
What is included in the product
 Detailed Word Document
Explores how Political, Economic, Social, Technological, Environmental and Legal forces uniquely shape Viridien’s operating environment, with data-backed subpoints and region-specific examples to reveal risks and openings. Designed for executives, investors and advisors, it delivers forward-looking insights and clean formatting ready for plans, decks or scenario planning to support strategy and funding decisions.

 Customizable Excel Spreadsheet
Viridien's PESTLE analysis condenses complex external factors into a visually segmented, editable summary ideal for presentations or quick alignment across teams, and uses clear language so all stakeholders can grasp risks and opportunities at a glance.
Economic factors

Commodity price cycles
Brent crude averaged about $86/bbl in 2024, and oil and gas price swings continue to drive exploration and reservoir imaging demand cycles. Upswings expand multi-client data sales and processing revenue while downturns compress E&P budgets and postpone projects. Diversification into renewables and infrastructure—clean energy investment topped $1 trillion in 2023—helps smooth cyclicality, making a flexible cost base and variable utilization essential.
Capex and interest rates
Higher rates pressure client capex and raise Viridien’s financing costs for data libraries and equipment, with US policy rates peaking near 5.25% in 2024 which elevated borrowing spreads and lease costs.
Lower rates catalyze infrastructure and clean energy investment—global clean energy investment reached roughly $1.5 trillion in 2024 (IEA), expanding addressable markets.
Project prioritization therefore favors short-payback, regulatory-driven monitoring; balance sheet discipline and co-invest structures help mitigate financing strain and preserve growth optionality.

Inflation and supply chain
Sensor hardware, compute, and labor inflation (U.S. CPI ~3.4% in 2024) are squeezing Viridien’s margins as component and wage costs rise; volatile lead times and shipping rate swings (container rates down ~60% from 2021 peaks but still volatile) risk project schedules. Index-linked pricing and multi-year supplier contracts mitigate input volatility, while automation and cloud-led productivity gains (pilot savings ~15–20%) improve unit economics.

Currency fluctuations
Revenue and costs span USD, EUR, GBP and emerging market currencies, exposing reported earnings and cash flows to FX moves; global FX daily turnover was $7.5 trillion per BIS 2022 triennial, illustrating market scale. Natural hedges and financial hedging tools are used to reduce volatility, while pricing in client currency and diversified billing balance exposures.
- FX scope: USD/EUR/GBP/EM currencies
- BIS FX turnover: $7.5T (2022)
- Mitigation: natural hedges + financial hedging
- Revenue tools: client-currency pricing, diversified billing
Growth of energy transition spend
Accelerating investment in CCS, offshore wind, geothermal and grid resilience—backed by US grid funding of roughly 65 billion from the 2021 Infrastructure Act and global offshore wind capacity near 72 GW (2023) —expands Viridien’s addressable market; subsidy and permitting timelines remain key decision drivers.
- Subsurface expertise = higher-value services
- Bundled data-to-decision increases wallet share
- Permitting/subsidies dictate project cycles
Policy shifts + IRA $369bn boost demand; sanctions, piracy, export controls add timing risk
Commodity swings (Brent ~$86/bbl in 2024) drive cyclical demand for imaging and multi-client data; diversification into renewables smooths revenue volatility.
Higher rates (US policy ~5.25% in 2024) and input inflation (US CPI ~3.4% in 2024) pressure capex, margins and financing costs; balance-sheet discipline and co-invests mitigate risk.
FX exposure (BIS turnover $7.5T) and expanding clean-energy spend ($1.5T global 2024) reshape addressable markets and pricing strategies.
| Metric | Value | Year |
|---|---|---|
| Brent | $86/bbl | 2024 |
| Clean energy invest | $1.5T | 2024 |
| US policy rate | 5.25% | 2024 |
| US CPI | 3.4% | 2024 |
| FX turnover | $7.5T | 2022 |
What You See Is What You Get
Viridien PESTLE Analysis
The Viridien PESTLE Analysis preview shown here is the exact document you’ll receive after purchase—fully formatted, professionally structured, and ready to use. The content, layout, and analysis visible in this screenshot are the final version with no placeholders or teasers. After payment you’ll instantly download this same complete file, allowing immediate application in your research or presentations.

Original: $10.00
-65%$10.00
$3.50Product Information
Product Information
Shipping & Returns
Shipping & Returns
Description
Your Shortcut to Market Insight Starts Here
Gain a strategic advantage with our tailored PESTLE analysis of Viridien—spot regulatory threats, economic drivers, and technological shifts shaping its future. This concise briefing highlights opportunities and risks; buy the full PESTLE to access detailed, ready-to-use intelligence and forecasts. Get your copy now.
Political factors
Energy policy volatility
Shifts in national energy strategies directly affect demand for Viridien’s subsurface imaging, CCS, geothermal and wind-siting work; global wind capacity reached about 840 GW and geothermal ~17 GW while operational CCS was ~50 MtCO2/yr (Global CCS Institute/IRENA, 2023–24), shaping market size. Elections and coalition changes can rapidly reallocate transition budgets—US IRA deploys roughly $369 billion for clean energy incentives—speeding or stalling projects. Viridien benefits from pro-transition incentives but faces revenue swings if hydrocarbons regain priority; scenario planning and diversified end-markets hedge policy risk.
Geopolitical tensions
Geopolitical tensions—sanctions, conflicts and maritime disputes—have disrupted offshore campaigns and data acquisition, with the International Maritime Bureau reporting 132 piracy/armed robbery incidents in 2023 that complicate field operations. Access to certain basins or clients can be restricted, delaying projects and receivables; the UN maintained 14 active sanctions regimes in 2024 that affect cross-border work. Diversified geographic exposure and remote delivery reduce but do not eliminate this risk. Robust insurance, partner vetting and contingency logistics remain critical to mitigate financial and operational impacts.
Public funding & infrastructure agendas
Government-backed programs (EU NextGenerationEU ~€800bn, US Infrastructure Law ~$1.2tn) are driving growth in monitoring and environmental services spend, unlocking tender opportunities. Winning grants/tenders requires compliance, local presence and measurable social benefits; long approval cycles create multi-quarter backlog timing risks. Aligning with national resilience and climate adaptation priorities improves pipeline visibility and win rates.
Trade policy & export controls
Advanced sensing, HPC, and certain software are covered by tightened export controls after US Commerce actions in 2023 and follow‑on measures in 2024; compliance drives delivery delays, hardware substitutions, and data‑residency changes. Supply‑chain rerouting and licensing increase cost and complexity, often adding low‑single to double‑digit percent budget impacts. Early screening and modular architectures materially reduce disruption.
- 2023 US Commerce expansion covers HPC and related software
- Compliance affects timelines, hardware selection, and data residency
- Routing/licensing can add low‑single to double‑digit % costs
- Early screening and modular design mitigate risk
ESG-driven procurement
Public and quasi-public buyers increasingly embed ESG criteria into awards, with public procurement representing roughly 12–15% of GDP in many OECD economies and thus a major market lever. Low-carbon operations, transparency and measurable community impact now influence win rates, so Viridien’s transition positioning helps score higher but requires quantified KPIs (emissions intensity, % local hiring). Third-party ratings and assurance act as growing commercial differentiators.
- procurement share: 12–15% GDP
- KPI examples: tCO2e/€ revenue, % local employment
- assurance: third-party ratings boost bid competitiveness
Policy shifts + IRA $369bn boost demand; sanctions, piracy, export controls add timing risk
National energy policy shifts (global wind ~840 GW, geothermal ~17 GW, CCS ~50 MtCO2/yr) and US IRA ~$369bn drive demand but create political timing risk; elections can reallocate funds. Geopolitics, sanctions (14 active, 2024) and 132 piracy incidents (2023) disrupt fieldwork. Export controls on HPC/software raise costs; public procurement ~12–15% GDP favors ESG-compliant bids.
| Factor | Key metric |
|---|---|
| Energy market | Wind 840 GW; Geothermal 17 GW; CCS 50 MtCO2/yr |
| Funding | US IRA $369bn; EU NextGen €800bn; US Infra ~$1.2tn |
| Risk | 14 sanctions (2024); 132 piracy (2023) |
| Procurement | 12–15% GDP; ESG KPIs |
What is included in the product
Detailed Word Document
Explores how Political, Economic, Social, Technological, Environmental and Legal forces uniquely shape Viridien’s operating environment, with data-backed subpoints and region-specific examples to reveal risks and openings. Designed for executives, investors and advisors, it delivers forward-looking insights and clean formatting ready for plans, decks or scenario planning to support strategy and funding decisions.
Customizable Excel Spreadsheet
Viridien's PESTLE analysis condenses complex external factors into a visually segmented, editable summary ideal for presentations or quick alignment across teams, and uses clear language so all stakeholders can grasp risks and opportunities at a glance.
Economic factors
Commodity price cycles
Brent crude averaged about $86/bbl in 2024, and oil and gas price swings continue to drive exploration and reservoir imaging demand cycles. Upswings expand multi-client data sales and processing revenue while downturns compress E&P budgets and postpone projects. Diversification into renewables and infrastructure—clean energy investment topped $1 trillion in 2023—helps smooth cyclicality, making a flexible cost base and variable utilization essential.
Capex and interest rates
Higher rates pressure client capex and raise Viridien’s financing costs for data libraries and equipment, with US policy rates peaking near 5.25% in 2024 which elevated borrowing spreads and lease costs.
Lower rates catalyze infrastructure and clean energy investment—global clean energy investment reached roughly $1.5 trillion in 2024 (IEA), expanding addressable markets.
Project prioritization therefore favors short-payback, regulatory-driven monitoring; balance sheet discipline and co-invest structures help mitigate financing strain and preserve growth optionality.
Inflation and supply chain
Sensor hardware, compute, and labor inflation (U.S. CPI ~3.4% in 2024) are squeezing Viridien’s margins as component and wage costs rise; volatile lead times and shipping rate swings (container rates down ~60% from 2021 peaks but still volatile) risk project schedules. Index-linked pricing and multi-year supplier contracts mitigate input volatility, while automation and cloud-led productivity gains (pilot savings ~15–20%) improve unit economics.
Currency fluctuations
Revenue and costs span USD, EUR, GBP and emerging market currencies, exposing reported earnings and cash flows to FX moves; global FX daily turnover was $7.5 trillion per BIS 2022 triennial, illustrating market scale. Natural hedges and financial hedging tools are used to reduce volatility, while pricing in client currency and diversified billing balance exposures.
- FX scope: USD/EUR/GBP/EM currencies
- BIS FX turnover: $7.5T (2022)
- Mitigation: natural hedges + financial hedging
- Revenue tools: client-currency pricing, diversified billing
Growth of energy transition spend
Accelerating investment in CCS, offshore wind, geothermal and grid resilience—backed by US grid funding of roughly 65 billion from the 2021 Infrastructure Act and global offshore wind capacity near 72 GW (2023) —expands Viridien’s addressable market; subsidy and permitting timelines remain key decision drivers.
- Subsurface expertise = higher-value services
- Bundled data-to-decision increases wallet share
- Permitting/subsidies dictate project cycles
Policy shifts + IRA $369bn boost demand; sanctions, piracy, export controls add timing risk
Commodity swings (Brent ~$86/bbl in 2024) drive cyclical demand for imaging and multi-client data; diversification into renewables smooths revenue volatility.
Higher rates (US policy ~5.25% in 2024) and input inflation (US CPI ~3.4% in 2024) pressure capex, margins and financing costs; balance-sheet discipline and co-invests mitigate risk.
FX exposure (BIS turnover $7.5T) and expanding clean-energy spend ($1.5T global 2024) reshape addressable markets and pricing strategies.
| Metric | Value | Year |
|---|---|---|
| Brent | $86/bbl | 2024 |
| Clean energy invest | $1.5T | 2024 |
| US policy rate | 5.25% | 2024 |
| US CPI | 3.4% | 2024 |
| FX turnover | $7.5T | 2022 |
What You See Is What You Get
Viridien PESTLE Analysis
The Viridien PESTLE Analysis preview shown here is the exact document you’ll receive after purchase—fully formatted, professionally structured, and ready to use. The content, layout, and analysis visible in this screenshot are the final version with no placeholders or teasers. After payment you’ll instantly download this same complete file, allowing immediate application in your research or presentations.











