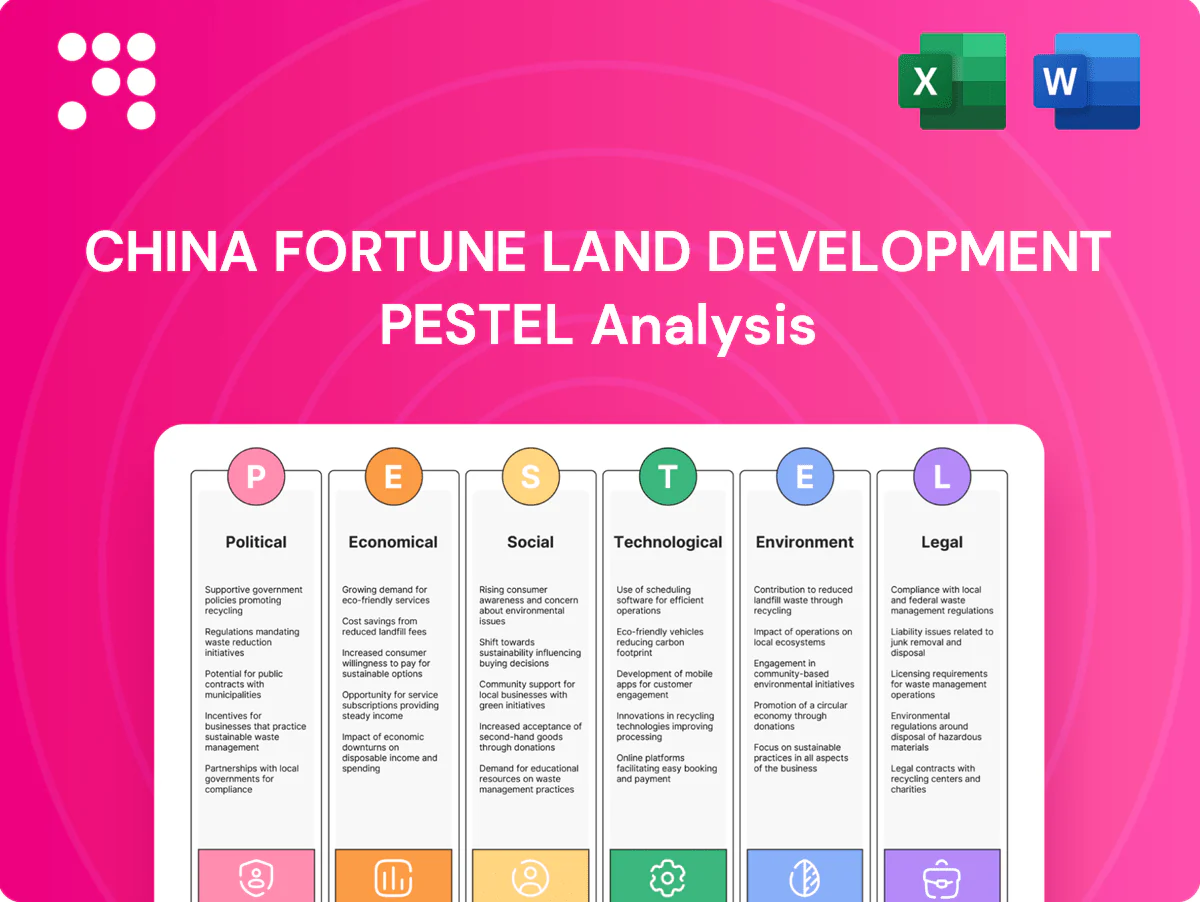
China Fortune Land Development PESTLE Analysis

Your Competitive Advantage Starts with This Report
Gain a strategic advantage with our targeted PESTLE Analysis of China Fortune Land Development—revealing how political shifts, economic cycles, social trends, and regulatory pressures shape its prospects. Use these concise, actionable insights to refine investment theses or competitive strategies. Purchase the full report for the complete, editable breakdown and make decisions with confidence.
Political factors

Central–local policy alignment
Urban new-city projects hinge on approvals and coordination across central and municipal bodies; China’s urbanization rate reached about 65% in 2023 (NBS), keeping demand high but intensifying competition for approvals. Supportive national strategies speed land conversion, rezoning and infrastructure permits, while local leadership rotation or policy misalignment can stall project pipelines and delay cash collections. CFLD must sustain multi-tier government ties and continuous policy monitoring to de-risk execution.
Industrial policy priorities
China Fortune Land must align park clusters with the 14th Five-Year Plan (2021–2025) emphasis on advanced manufacturing, EVs and semiconductors to access central and local incentives and drive tenant demand. Sudden policy pivots can deprioritize targeted industries and depress occupancy in planned parks. Curating flexible, multi-industry clusters preserves resilience and tenant attraction.

Fiscal stimulus and infrastructure push
China's 2024 counter-cyclical push, with a 3.8 trillion yuan local government special bond quota, can revive municipal budgets to fund roads, transit and utilities that support CFLD projects. Expanded infrastructure quotas accelerate ancillary works in CFLD cities and improve cash flow timing. Conversely, local austerity delays reimbursements and milestone payments, so CFLD should phase projects to align with fiscal visibility.

Public–private partnership stance
PPP guidelines and clearer risk-sharing norms materially affect project bankability, while tightened scrutiny of off-balance-sheet obligations has increasingly delayed financial close on large infrastructure deals. Transparent concession frameworks de-risk receivables and improve lender comfort, and CFLD benefits from standardized PPP contracts and disclosure practices across Chinas 31 provincial-level regions.
- PPP risk-sharing improves bankability
- Off-balance scrutiny delays financial close
- Transparent concessions de-risk receivables
- CFLD gains from standardized contracts & disclosure
Geopolitical and regional competition
Global tensions can depress FDI into industrial parks and reshape supply-chain placement; UNCTAD reported global FDI flows fell to about 1.3 trillion USD in 2023, amplifying competition for projects. Competing development zones often gain preferential treatment, prompting incentive races that CFLD cannot match sustainably. CFLD must instead compete on cluster depth and service quality while leveraging regional integration to expand catchment markets.
- FDI pressure: UNCTAD 2023 = 1.3T USD
- Strategy: differentiate via cluster depth & services
- Opportunity: regional integration expands market reach
Urban approvals drive project cadence; 65% urbanization sustains demand
Urban approvals and multi-tier coordination determine project cadence; China urbanization ~65% (NBS 2023) sustains demand but heightens approval competition.
Alignment with 14th Five-Year priorities (advanced manufacturing, EVs, semis) unlocks incentives; policy pivots risk occupancy and cash flow.
2024 fiscal support (3.8tn yuan LG special bond quota) boosts infrastructure timing, while PPP standardization and off-balance scrutiny shape bankability.
| Risk | Impact | 2023–24 datapoint |
|---|---|---|
| Approvals | Delays | Urbanization 65% |
| Funding | Timing | 3.8tn RMB bonds (2024) |
What is included in the product
 Detailed Word Document
Explores how Political, Economic, Social, Technological, Environmental and Legal forces shape China Fortune Land Development, combining data-backed trends and region-specific regulatory insights to identify risks, opportunities and forward-looking scenarios for executives, investors and strategists.

 Customizable Excel Spreadsheet
A concise, PESTLE-segmented summary of China Fortune Land Development that can be dropped into presentations, shared across teams, and annotated for regional or business-line context—facilitating quick alignment on external risks, regulatory shifts, and strategic positioning during planning sessions.
Economic factors

Property cycle and liquidity
China’s real estate downturn—property investment contracted about 8.4% and new home sales value fell roughly 28% in 2023 (NBS)—is pressuring cash flows, valuations and higher financing costs for developers. Industrial-park assets held up better than residential, but tenant capex cycles still affect rental uplift and vacancy. Weaker presales limit cross-subsidization of infrastructure, so CFLD must enforce disciplined capital recycling and diversify funding sources.
Local government fiscal health
Local government fiscal health heavily influences China Fortune Land Development cashflows as land-sale revenues, which fell to about CNY 5.8 trillion in 2023, and LGFV leverage—estimated at c. CNY 50 trillion by mid-2024—shape city budgets and payment reliability. Strained municipal finances raise receivable risk and commonly extend settlement cycles beyond contractual terms. Prioritizing fiscally stronger counterparties and embedding payment safeguards, step-in rights and escrow mechanics reduces working-capital drag.

Industrial demand and manufacturing upgrade
China accounted for roughly 27% of global manufacturing output in 2023, with a shift toward high-value sectors driving demand for specialized industrial parks and services; tenant affordability depends heavily on energy, logistics and skilled-talent costs, while export growth slowed to about 0.9% in 2023, which can delay expansions; CFLD can counter by offering modular facilities and OPEX-saving utilities to keep propositions compelling.

Interest rates and credit access
Monetary easing (1-yr LPR 3.45%, 5-yr 4.20% in 2024–25) lowers borrowing costs but credit transmission is uneven; CF Land still faces tighter bank scrutiny and episodic bond-market windows after 2023 stress. Stronger governance and asset-backed structures have expanded access; staggered maturities and onshore RMB financing cut refinancing risk.
- 1-yr LPR 3.45%
- 5-yr LPR 4.20%
- Onshore bond yields ~4–6% (2024)
Regional income and consumption trends
Household income growth and rising urbanization (urbanization ~65% in 2023) directly affect residential absorption in CFLD new cities; slower real income gains and weak retail demand (household consumption ~38% of GDP in 2023) lengthen ramp-up and amenity payback. Mature service ecosystems increase resident and SME stickiness, so phased amenity delivery tied to occupancy preserves returns.
- Income growth moderates absorption
- Service maturity = higher retention
- Weak consumption delays payback
- Phased amenities protect IRR
Urban approvals drive project cadence; 65% urbanization sustains demand
China’s 2023 property slump (property investment -8.4%, new-home sales value -28%) and constrained presales pressure CFLD cashflow and valuations, forcing disciplined capital recycling and diversified funding. Municipal fiscal strain (land sales CNY5.8tn in 2023; LGFV leverage ~CNY50tn mid-2024) raises receivable risk and settlement delays. Moderate monetary easing (1-yr LPR 3.45%, 5-yr 4.20%) lowers costs but credit access remains uneven.
| Metric | Value |
|---|---|
| Property investment (2023) | -8.4% |
| New-home sales value (2023) | -28% |
| Land-sale revenue (2023) | CNY5.8tn |
| LGFV leverage (mid-2024) | ~CNY50tn |
| 1-yr LPR / 5-yr LPR (2024–25) | 3.45% / 4.20% |
Preview the Actual Deliverable
China Fortune Land Development PESTLE Analysis
The preview shown here is the exact China Fortune Land Development PESTLE Analysis document you’ll receive after purchase—fully formatted and ready to use. It includes the full Political, Economic, Social, Technological, Legal and Environmental assessment plus a structured executive summary. No placeholders or teasers—this is the final file available for immediate download.

Original: $10.00
-65%$10.00
$3.50Product Information
Product Information
Shipping & Returns
Shipping & Returns
Description
Your Competitive Advantage Starts with This Report
Gain a strategic advantage with our targeted PESTLE Analysis of China Fortune Land Development—revealing how political shifts, economic cycles, social trends, and regulatory pressures shape its prospects. Use these concise, actionable insights to refine investment theses or competitive strategies. Purchase the full report for the complete, editable breakdown and make decisions with confidence.
Political factors
Central–local policy alignment
Urban new-city projects hinge on approvals and coordination across central and municipal bodies; China’s urbanization rate reached about 65% in 2023 (NBS), keeping demand high but intensifying competition for approvals. Supportive national strategies speed land conversion, rezoning and infrastructure permits, while local leadership rotation or policy misalignment can stall project pipelines and delay cash collections. CFLD must sustain multi-tier government ties and continuous policy monitoring to de-risk execution.
Industrial policy priorities
China Fortune Land must align park clusters with the 14th Five-Year Plan (2021–2025) emphasis on advanced manufacturing, EVs and semiconductors to access central and local incentives and drive tenant demand. Sudden policy pivots can deprioritize targeted industries and depress occupancy in planned parks. Curating flexible, multi-industry clusters preserves resilience and tenant attraction.
Fiscal stimulus and infrastructure push
China's 2024 counter-cyclical push, with a 3.8 trillion yuan local government special bond quota, can revive municipal budgets to fund roads, transit and utilities that support CFLD projects. Expanded infrastructure quotas accelerate ancillary works in CFLD cities and improve cash flow timing. Conversely, local austerity delays reimbursements and milestone payments, so CFLD should phase projects to align with fiscal visibility.
Public–private partnership stance
PPP guidelines and clearer risk-sharing norms materially affect project bankability, while tightened scrutiny of off-balance-sheet obligations has increasingly delayed financial close on large infrastructure deals. Transparent concession frameworks de-risk receivables and improve lender comfort, and CFLD benefits from standardized PPP contracts and disclosure practices across Chinas 31 provincial-level regions.
- PPP risk-sharing improves bankability
- Off-balance scrutiny delays financial close
- Transparent concessions de-risk receivables
- CFLD gains from standardized contracts & disclosure
Geopolitical and regional competition
Global tensions can depress FDI into industrial parks and reshape supply-chain placement; UNCTAD reported global FDI flows fell to about 1.3 trillion USD in 2023, amplifying competition for projects. Competing development zones often gain preferential treatment, prompting incentive races that CFLD cannot match sustainably. CFLD must instead compete on cluster depth and service quality while leveraging regional integration to expand catchment markets.
- FDI pressure: UNCTAD 2023 = 1.3T USD
- Strategy: differentiate via cluster depth & services
- Opportunity: regional integration expands market reach
Urban approvals drive project cadence; 65% urbanization sustains demand
Urban approvals and multi-tier coordination determine project cadence; China urbanization ~65% (NBS 2023) sustains demand but heightens approval competition.
Alignment with 14th Five-Year priorities (advanced manufacturing, EVs, semis) unlocks incentives; policy pivots risk occupancy and cash flow.
2024 fiscal support (3.8tn yuan LG special bond quota) boosts infrastructure timing, while PPP standardization and off-balance scrutiny shape bankability.
| Risk | Impact | 2023–24 datapoint |
|---|---|---|
| Approvals | Delays | Urbanization 65% |
| Funding | Timing | 3.8tn RMB bonds (2024) |
What is included in the product
Detailed Word Document
Explores how Political, Economic, Social, Technological, Environmental and Legal forces shape China Fortune Land Development, combining data-backed trends and region-specific regulatory insights to identify risks, opportunities and forward-looking scenarios for executives, investors and strategists.
Customizable Excel Spreadsheet
A concise, PESTLE-segmented summary of China Fortune Land Development that can be dropped into presentations, shared across teams, and annotated for regional or business-line context—facilitating quick alignment on external risks, regulatory shifts, and strategic positioning during planning sessions.
Economic factors
Property cycle and liquidity
China’s real estate downturn—property investment contracted about 8.4% and new home sales value fell roughly 28% in 2023 (NBS)—is pressuring cash flows, valuations and higher financing costs for developers. Industrial-park assets held up better than residential, but tenant capex cycles still affect rental uplift and vacancy. Weaker presales limit cross-subsidization of infrastructure, so CFLD must enforce disciplined capital recycling and diversify funding sources.
Local government fiscal health
Local government fiscal health heavily influences China Fortune Land Development cashflows as land-sale revenues, which fell to about CNY 5.8 trillion in 2023, and LGFV leverage—estimated at c. CNY 50 trillion by mid-2024—shape city budgets and payment reliability. Strained municipal finances raise receivable risk and commonly extend settlement cycles beyond contractual terms. Prioritizing fiscally stronger counterparties and embedding payment safeguards, step-in rights and escrow mechanics reduces working-capital drag.
Industrial demand and manufacturing upgrade
China accounted for roughly 27% of global manufacturing output in 2023, with a shift toward high-value sectors driving demand for specialized industrial parks and services; tenant affordability depends heavily on energy, logistics and skilled-talent costs, while export growth slowed to about 0.9% in 2023, which can delay expansions; CFLD can counter by offering modular facilities and OPEX-saving utilities to keep propositions compelling.
Interest rates and credit access
Monetary easing (1-yr LPR 3.45%, 5-yr 4.20% in 2024–25) lowers borrowing costs but credit transmission is uneven; CF Land still faces tighter bank scrutiny and episodic bond-market windows after 2023 stress. Stronger governance and asset-backed structures have expanded access; staggered maturities and onshore RMB financing cut refinancing risk.
- 1-yr LPR 3.45%
- 5-yr LPR 4.20%
- Onshore bond yields ~4–6% (2024)
Regional income and consumption trends
Household income growth and rising urbanization (urbanization ~65% in 2023) directly affect residential absorption in CFLD new cities; slower real income gains and weak retail demand (household consumption ~38% of GDP in 2023) lengthen ramp-up and amenity payback. Mature service ecosystems increase resident and SME stickiness, so phased amenity delivery tied to occupancy preserves returns.
- Income growth moderates absorption
- Service maturity = higher retention
- Weak consumption delays payback
- Phased amenities protect IRR
Urban approvals drive project cadence; 65% urbanization sustains demand
China’s 2023 property slump (property investment -8.4%, new-home sales value -28%) and constrained presales pressure CFLD cashflow and valuations, forcing disciplined capital recycling and diversified funding. Municipal fiscal strain (land sales CNY5.8tn in 2023; LGFV leverage ~CNY50tn mid-2024) raises receivable risk and settlement delays. Moderate monetary easing (1-yr LPR 3.45%, 5-yr 4.20%) lowers costs but credit access remains uneven.
| Metric | Value |
|---|---|
| Property investment (2023) | -8.4% |
| New-home sales value (2023) | -28% |
| Land-sale revenue (2023) | CNY5.8tn |
| LGFV leverage (mid-2024) | ~CNY50tn |
| 1-yr LPR / 5-yr LPR (2024–25) | 3.45% / 4.20% |
Preview the Actual Deliverable
China Fortune Land Development PESTLE Analysis
The preview shown here is the exact China Fortune Land Development PESTLE Analysis document you’ll receive after purchase—fully formatted and ready to use. It includes the full Political, Economic, Social, Technological, Legal and Environmental assessment plus a structured executive summary. No placeholders or teasers—this is the final file available for immediate download.











