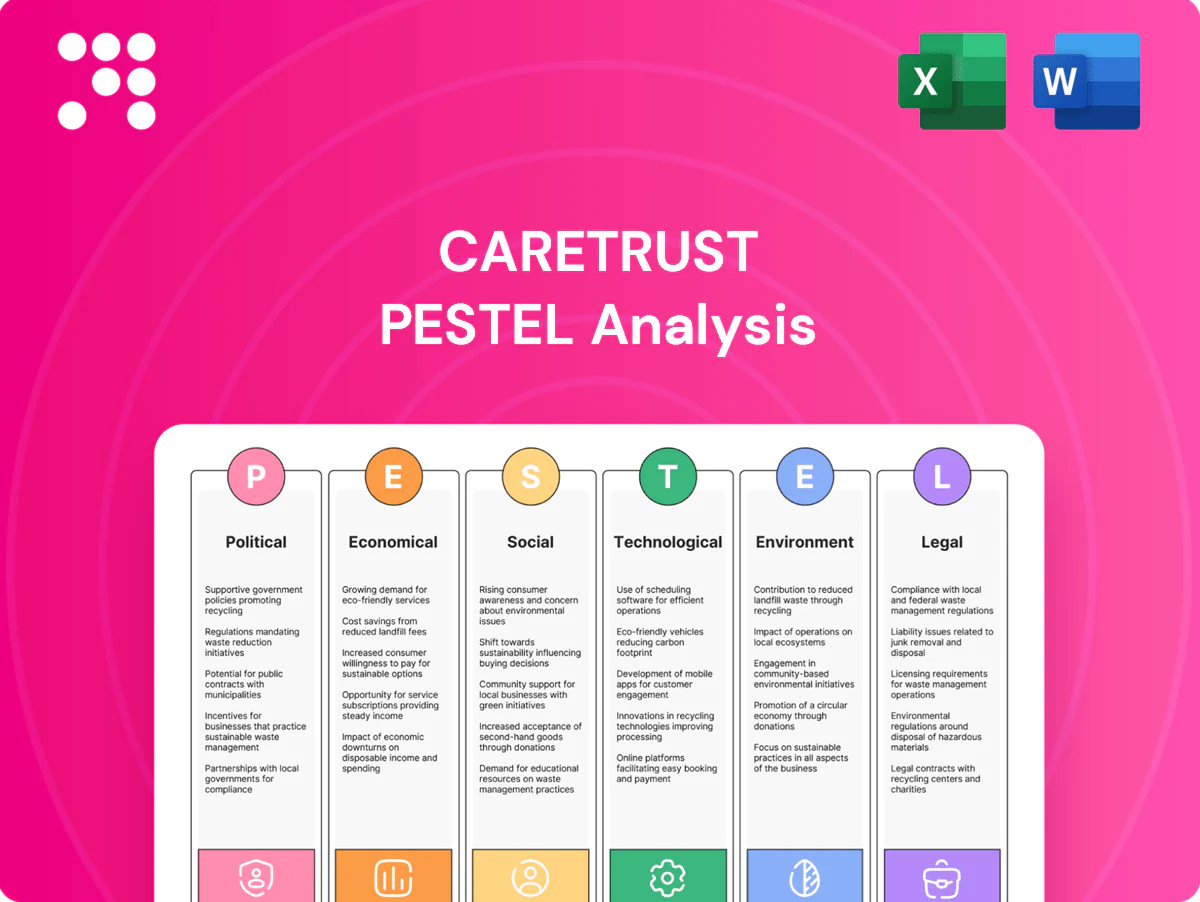
CareTrust PESTLE Analysis

Your Competitive Advantage Starts with This Report
Unlock strategic clarity with our targeted PESTLE Analysis of CareTrust—three to five concise sections revealing how political, economic, social, technological, legal, and environmental forces shape its outlook. Perfect for investors and strategists who need immediate, actionable intelligence. Purchase the full report for a complete, editable breakdown and make confident, data-driven decisions today.
Political factors

Medicare and Medicaid reimbursement policy
Public payers drive operator cash flows: Medicaid financed about 62% of U.S. nursing facility expenditures (CMS, 2020), which fund triple-net rents to CareTrust tenants. Federal or state reimbursement cuts can compress tenant coverage ratios and elevate default risk, while rate increases or value-based incentives improve rent collections. Monitoring CMS rulemaking and state budget cycles is critical for underwriting.
State-level licensure and CON regimes
State-level certificate-of-need (CON) and licensure regimes—present in 35 states in 2024—directly shape supply, occupancy and operator stability; national skilled nursing occupancy averaged ~77% in 2024, supporting stable rental pricing where regimes are restrictive. Liberalization tends to raise competition and pressure rents. Political shifts can flip approval timelines from ~3 months to over 18 months, so market selection must weigh policy durability.

Long-term care funding priorities
Policy shifts favoring aging-in-place have pushed home- and community-based services to over half of Medicaid long-term services and supports spending (around 56% in recent CMS reports), diverting volumes from skilled nursing as occupancy averages near 75–80% post-pandemic. Federal waivers and grant programs are reallocating resources across settings, so CareTrust must target acquisitions in states still prioritizing institutional care where acuity remains high and use advocacy and provider partnerships to mitigate demand displacement.

Infrastructure and disaster-resilience incentives
Government resilience subsidies and state grant programs can lower landlords capex burdens and accelerate upgrades; by 2025 over 20 states maintain dedicated resilience incentives that improve upgrade economics. Political support for climate adaptation shifts property risk in coastal and heat-stressed markets, affecting insurance and valuation. Accessing tax credits or grants (often covering 10–30% of retrofit costs) enhances NOI via lower operating expenses, so site selection should reflect local policy traction.
- subsidy-impact: reduces upfront capex, shortens payback
- policy-risk: coastal/heat markets tied to adaptation funding
- financial-levers: 10–30% retrofit aid boosts NOI
- site-criteria: prioritize jurisdictions with active incentives
Trade and labor immigration stances
Political attitudes toward immigration shape caregiver supply and wage pressure for CareTrust; U.S. long-term care vacancy rates averaged about 8% in 2024 and BLS projects personal care aide demand rising roughly 30% by 2032, driving upward wage trends that compress operator margins and rent coverage.
Supportive visa pathways for nurses and aides (e.g., expanded H-2C proposals) improve operational stability and reduce portfolio risk as predictable labor pipelines lower staffing-related rent delinquencies and vacancy-driven margin shocks.
- Impact: higher wages → lower tenant coverage
- Stat: ~8% LTC vacancy (2024)
- Projection: ~30% aide demand rise by 2032
- Mitigator: visa pathways reduce portfolio risk
Medicaid funding 62% fuels nursing home rent risk amid HCBS shift
Medicaid funds ~62% of U.S. nursing facility spend (CMS 2020), so federal/state rate cuts raise tenant default risk while rate increases/value-based payments improve rent coverage. Thirty-five states had CON/licensure rules in 2024, supporting ~77% skilled nursing occupancy; liberalization raises competition. HCBS now ~56% of Medicaid LTSS spend, shifting volumes; LTC vacancy ~8% (2024) with aide demand +30% by 2032.
| Metric | Value |
|---|---|
| Medicaid share | ~62% |
| CON states (2024) | 35 |
| Skilled occupancy (2024) | ~77% |
| HCBS share | ~56% |
| LTC vacancy (2024) | ~8% |
| Aide demand by 2032 | +30% |
What is included in the product
 Detailed Word Document
Explores how macro-environmental factors uniquely affect CareTrust across Political, Economic, Social, Technological, Environmental and Legal dimensions, with data-backed trends and multiple business-specific sub-points. Designed for executives and investors, it offers forward-looking insights and clean formatting ready for decks and reports.

 Customizable Excel Spreadsheet
Visually segmented by PESTLE categories for CareTrust, allowing stakeholders to quickly spot regulatory, economic, and demographic pressures and alleviate planning bottlenecks in strategy and investment discussions.
Economic factors

Interest rates and cost of capital
REIT valuations and acquisition yields hinge on benchmark rates and credit spreads; with the federal funds target near 5.25–5.50% and 10-year Treasury around 4.2% in mid-2025, rising rates compress investment spreads and can slow external growth. Higher refinancing costs directly pressure AFFO and dividend capacity, especially for maturing debt. Prudent leverage and laddered maturities buffer volatility and preserve funding optionality.
Operator credit health and rent coverage
Tenant EBITDAR-to-rent ratios, with operators commonly targeting greater than 1.5x, drive rental durability under triple-net leases and flag default risk when below that threshold. Inflation—US CPI 2024 +3.4% and continued wage pressure—squeezes margins if reimbursement lags. Diversifying operators and embedding CPI-linked escalators stabilizes cash flow. Proactive asset management and lease enforcement reduce default probability.

Demographic-driven demand
By 2030 US residents aged 65+ are projected to reach about 73 million (Census), expanding the addressable market for skilled nursing and seniors housing. Rising clinical acuity in post-acute and chronic care supports occupancy and longer LOS despite home-care growth. Private-pay demand tracks regional median household income (US median ~74,580 in 2023), so market selection should favor high senior density and stronger incomes.

Transaction market liquidity
Transaction market liquidity for CareTrust is shaped by wider bid-ask spreads and higher cap rates versus pre-2019, with cap rates for senior housing remaining roughly 200–300 basis points above 2019 troughs and the fed funds rate at 5.25–5.50% (mid-2025), which slows acquisition pacing. Periodic dislocations since 2022–24 have produced selective entry points for well-capitalized buyers. Competition from private equity and other healthcare REITs keeps pricing discipline tight. CareTrusts balance-sheet capacity and access to capital markets enable opportunistic deployment when spreads widen.
- Bid-ask spreads: wider, slowing deal flow
- Cap-rate trend: ~200–300 bps above 2019
- Competition: private equity/REITs intensify pricing
- Balance sheet: liquidity enables opportunistic buys
Inflation and lease escalators
Inflation (US CPI ~3.4% in 2024, 12-month to June 2025 ~3.3%) lifts nominal rents where CPI-linked escalators exist but compresses tenant margins, especially in healthcare operations with tight reimbursement. Fairly calibrated escalators sustain tenant viability while allowing landlord revenue growth; triple-net structures pass many opex costs but capex burdens can still fall on tenants. Careful underwriting of escalator sustainability and tenant cashflow sensitivity is essential.
Medicaid funding 62% fuels nursing home rent risk amid HCBS shift
Higher policy rates (fed funds 5.25–5.50%, 10y ~4.2% mid‑2025) compress REIT spreads and slow external growth, raising refinancing costs and pressuring AFFO/dividends. Inflation (CPI ~3.3% mid‑2025) lifts nominal rents where CPI escalators exist but squeezes tenant margins. Demographics (65+ ~73M by 2030) expand demand, while cap rates remain ~200–300bps above 2019, creating selective buying opportunities.
| Metric | Value |
|---|---|
| Fed funds | 5.25–5.50% |
| 10‑yr Treasury | ~4.2% |
| CPI (mid‑2025) | ~3.3% |
| 65+ by 2030 | ~73M |
| Cap rate vs 2019 | +200–300bps |
Preview the Actual Deliverable
CareTrust PESTLE Analysis
The preview shown here is the exact CareTrust PESTLE Analysis you’ll receive after purchase—fully formatted and ready to use. This screenshot reflects the final content, layout, and structure with no placeholders or teasers. After checkout you’ll instantly download this same professionally structured file. What you see is what you’ll get.

Original: $10.00
-65%$10.00
$3.50Product Information
Product Information
Shipping & Returns
Shipping & Returns
Description
Your Competitive Advantage Starts with This Report
Unlock strategic clarity with our targeted PESTLE Analysis of CareTrust—three to five concise sections revealing how political, economic, social, technological, legal, and environmental forces shape its outlook. Perfect for investors and strategists who need immediate, actionable intelligence. Purchase the full report for a complete, editable breakdown and make confident, data-driven decisions today.
Political factors
Medicare and Medicaid reimbursement policy
Public payers drive operator cash flows: Medicaid financed about 62% of U.S. nursing facility expenditures (CMS, 2020), which fund triple-net rents to CareTrust tenants. Federal or state reimbursement cuts can compress tenant coverage ratios and elevate default risk, while rate increases or value-based incentives improve rent collections. Monitoring CMS rulemaking and state budget cycles is critical for underwriting.
State-level licensure and CON regimes
State-level certificate-of-need (CON) and licensure regimes—present in 35 states in 2024—directly shape supply, occupancy and operator stability; national skilled nursing occupancy averaged ~77% in 2024, supporting stable rental pricing where regimes are restrictive. Liberalization tends to raise competition and pressure rents. Political shifts can flip approval timelines from ~3 months to over 18 months, so market selection must weigh policy durability.
Long-term care funding priorities
Policy shifts favoring aging-in-place have pushed home- and community-based services to over half of Medicaid long-term services and supports spending (around 56% in recent CMS reports), diverting volumes from skilled nursing as occupancy averages near 75–80% post-pandemic. Federal waivers and grant programs are reallocating resources across settings, so CareTrust must target acquisitions in states still prioritizing institutional care where acuity remains high and use advocacy and provider partnerships to mitigate demand displacement.
Infrastructure and disaster-resilience incentives
Government resilience subsidies and state grant programs can lower landlords capex burdens and accelerate upgrades; by 2025 over 20 states maintain dedicated resilience incentives that improve upgrade economics. Political support for climate adaptation shifts property risk in coastal and heat-stressed markets, affecting insurance and valuation. Accessing tax credits or grants (often covering 10–30% of retrofit costs) enhances NOI via lower operating expenses, so site selection should reflect local policy traction.
- subsidy-impact: reduces upfront capex, shortens payback
- policy-risk: coastal/heat markets tied to adaptation funding
- financial-levers: 10–30% retrofit aid boosts NOI
- site-criteria: prioritize jurisdictions with active incentives
Trade and labor immigration stances
Political attitudes toward immigration shape caregiver supply and wage pressure for CareTrust; U.S. long-term care vacancy rates averaged about 8% in 2024 and BLS projects personal care aide demand rising roughly 30% by 2032, driving upward wage trends that compress operator margins and rent coverage.
Supportive visa pathways for nurses and aides (e.g., expanded H-2C proposals) improve operational stability and reduce portfolio risk as predictable labor pipelines lower staffing-related rent delinquencies and vacancy-driven margin shocks.
- Impact: higher wages → lower tenant coverage
- Stat: ~8% LTC vacancy (2024)
- Projection: ~30% aide demand rise by 2032
- Mitigator: visa pathways reduce portfolio risk
Medicaid funding 62% fuels nursing home rent risk amid HCBS shift
Medicaid funds ~62% of U.S. nursing facility spend (CMS 2020), so federal/state rate cuts raise tenant default risk while rate increases/value-based payments improve rent coverage. Thirty-five states had CON/licensure rules in 2024, supporting ~77% skilled nursing occupancy; liberalization raises competition. HCBS now ~56% of Medicaid LTSS spend, shifting volumes; LTC vacancy ~8% (2024) with aide demand +30% by 2032.
| Metric | Value |
|---|---|
| Medicaid share | ~62% |
| CON states (2024) | 35 |
| Skilled occupancy (2024) | ~77% |
| HCBS share | ~56% |
| LTC vacancy (2024) | ~8% |
| Aide demand by 2032 | +30% |
What is included in the product
Detailed Word Document
Explores how macro-environmental factors uniquely affect CareTrust across Political, Economic, Social, Technological, Environmental and Legal dimensions, with data-backed trends and multiple business-specific sub-points. Designed for executives and investors, it offers forward-looking insights and clean formatting ready for decks and reports.
Customizable Excel Spreadsheet
Visually segmented by PESTLE categories for CareTrust, allowing stakeholders to quickly spot regulatory, economic, and demographic pressures and alleviate planning bottlenecks in strategy and investment discussions.
Economic factors
Interest rates and cost of capital
REIT valuations and acquisition yields hinge on benchmark rates and credit spreads; with the federal funds target near 5.25–5.50% and 10-year Treasury around 4.2% in mid-2025, rising rates compress investment spreads and can slow external growth. Higher refinancing costs directly pressure AFFO and dividend capacity, especially for maturing debt. Prudent leverage and laddered maturities buffer volatility and preserve funding optionality.
Operator credit health and rent coverage
Tenant EBITDAR-to-rent ratios, with operators commonly targeting greater than 1.5x, drive rental durability under triple-net leases and flag default risk when below that threshold. Inflation—US CPI 2024 +3.4% and continued wage pressure—squeezes margins if reimbursement lags. Diversifying operators and embedding CPI-linked escalators stabilizes cash flow. Proactive asset management and lease enforcement reduce default probability.
Demographic-driven demand
By 2030 US residents aged 65+ are projected to reach about 73 million (Census), expanding the addressable market for skilled nursing and seniors housing. Rising clinical acuity in post-acute and chronic care supports occupancy and longer LOS despite home-care growth. Private-pay demand tracks regional median household income (US median ~74,580 in 2023), so market selection should favor high senior density and stronger incomes.
Transaction market liquidity
Transaction market liquidity for CareTrust is shaped by wider bid-ask spreads and higher cap rates versus pre-2019, with cap rates for senior housing remaining roughly 200–300 basis points above 2019 troughs and the fed funds rate at 5.25–5.50% (mid-2025), which slows acquisition pacing. Periodic dislocations since 2022–24 have produced selective entry points for well-capitalized buyers. Competition from private equity and other healthcare REITs keeps pricing discipline tight. CareTrusts balance-sheet capacity and access to capital markets enable opportunistic deployment when spreads widen.
- Bid-ask spreads: wider, slowing deal flow
- Cap-rate trend: ~200–300 bps above 2019
- Competition: private equity/REITs intensify pricing
- Balance sheet: liquidity enables opportunistic buys
Inflation and lease escalators
Inflation (US CPI ~3.4% in 2024, 12-month to June 2025 ~3.3%) lifts nominal rents where CPI-linked escalators exist but compresses tenant margins, especially in healthcare operations with tight reimbursement. Fairly calibrated escalators sustain tenant viability while allowing landlord revenue growth; triple-net structures pass many opex costs but capex burdens can still fall on tenants. Careful underwriting of escalator sustainability and tenant cashflow sensitivity is essential.
Medicaid funding 62% fuels nursing home rent risk amid HCBS shift
Higher policy rates (fed funds 5.25–5.50%, 10y ~4.2% mid‑2025) compress REIT spreads and slow external growth, raising refinancing costs and pressuring AFFO/dividends. Inflation (CPI ~3.3% mid‑2025) lifts nominal rents where CPI escalators exist but squeezes tenant margins. Demographics (65+ ~73M by 2030) expand demand, while cap rates remain ~200–300bps above 2019, creating selective buying opportunities.
| Metric | Value |
|---|---|
| Fed funds | 5.25–5.50% |
| 10‑yr Treasury | ~4.2% |
| CPI (mid‑2025) | ~3.3% |
| 65+ by 2030 | ~73M |
| Cap rate vs 2019 | +200–300bps |
Preview the Actual Deliverable
CareTrust PESTLE Analysis
The preview shown here is the exact CareTrust PESTLE Analysis you’ll receive after purchase—fully formatted and ready to use. This screenshot reflects the final content, layout, and structure with no placeholders or teasers. After checkout you’ll instantly download this same professionally structured file. What you see is what you’ll get.











