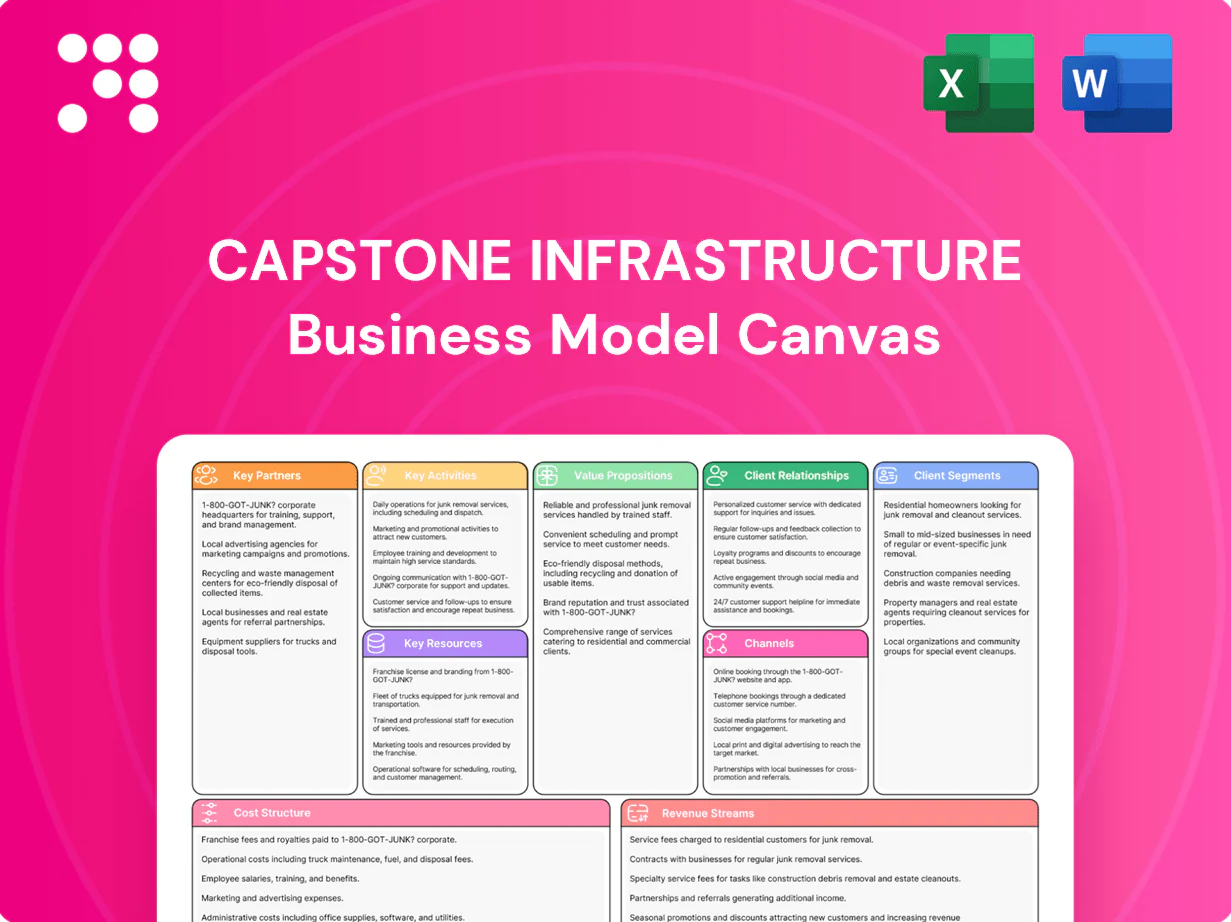
Capstone Infrastructure Business Model Canvas

Unlock a complete Business Model Canvas for infrastructure firms — editable Word & Excel toolkit
Unlock the full strategic blueprint behind Capstone Infrastructure’s business model with our complete Business Model Canvas—detailing value propositions, key partners, revenue streams and cost structure. Ideal for investors, consultants and founders, the editable Word and Excel files make benchmarking and strategic planning simple. Purchase the full Canvas to turn insight into action and accelerate decision-making.
Partnerships

Utilities, ISOs, and grid operators
Partnerships with utilities, ISOs and grid operators enable interconnection, dispatch (day‑ahead and real‑time) and financial settlement processes, with typical utility PPAs spanning 15–25 years to underpin predictable cash flows. Collaboration ensures compliance with evolving grid codes and NERC/ISO reliability standards, while joint planning tackles congestion and coordinates system upgrades to support deliverability and minimize curtailment.
EPC contractors and OEM suppliers
EPC contractors deliver projects on time and on budget, cutting typical schedule slippage and cost overruns that historically erode returns; in 2024 utility‑scale solar CAPEX averaged about $500/kW. OEMs supply turbines (up to 15–20 MW offshore), PV panels, inverters and 10–25 year service agreements, reducing construction and technology risk. Performance guarantees and availability clauses improve bankability and safeguard asset uptime.

Financiers, lenders, and institutional investors
Commercial banks, infrastructure funds and pension plans (eg CPP Investments CAD 632B AUM, 2024) supply project and corporate capital; structured debt and tax-equity solutions can cut WACC by ~200–300 bps, optimizing returns. Active refinancing partners support lifecycle repricing to boost IRRs, while these relationships underpin pipeline scaling and M&A execution amid estimated $94T global infrastructure need to 2040.

Landowners, Indigenous communities, and municipalities
Site control and community consent are critical for permitting and social license, with many renewable and infrastructure projects including 1–3% revenue-sharing or lease payments to local partners. Partnerships align benefits through leases, revenue sharing, and local jobs, often creating dozens to hundreds of construction and ongoing roles per project. Indigenous engagement supports reconciliation and long-term stewardship via negotiated agreements and joint governance. Municipal cooperation accelerates zoning and infrastructure access, shortening timelines and lowering upfront capital risk.
- Site control: essential for permits
- Revenue sharing: commonly 1–3% of project revenues
- Jobs: dozens–hundreds per project
- Indigenous agreements: joint stewardship
- Municipal cooperation: faster zoning/infrastructure
Regulators and policy bodies
Strong ties with federal, provincial and state regulators across 63 jurisdictions as of 2024 (10 provinces + 3 territories + 50 states) ensure compliance and eligibility for programs. Policy insight informs bidding strategies and technology choices, shortening permitting timelines and protecting project economics. Regulatory clarity supports utility rate cases, while continuous dialogue manages evolving ESG and market rules.
- 63 jurisdictions engaged (10 provinces + 3 territories + 50 states)
- Policy-driven bids and tech selection
- Supports rate case approvals
- Ongoing ESG and market rule coordination
Partnerships secure 15–25y PPAs and $500/kW CAPEX
Partnerships with utilities/ISOs secure interconnection, dispatch and 15–25y PPAs for stable cash flows. EPCs and OEMs limit CAPEX/schedule risk (utility solar CAPEX ~$500/kW in 2024) with 10–25y service agreements. Capital partners (eg CPP Investments CAD 632B AUM, 2024) and regulators across 63 jurisdictions enable financing, permitting and market access.
| Metric | 2024 |
|---|---|
| Utility solar CAPEX | $500/kW |
| CPP Investments AUM | CAD 632B |
| Jurisdictions engaged | 63 |
What is included in the product
 Detailed Word Document
A comprehensive, pre-written Business Model Canvas for Capstone Infrastructure that maps all nine BMC blocks with detailed value propositions, customer segments, channels and revenue logic, reflects real-world operations, includes SWOT-linked competitive analysis, and is presentation-ready for investors and lenders.

 Customizable Excel Spreadsheet
Condenses Capstone Infrastructure’s strategy into a clean, editable one-page canvas that saves hours of setup, aids team collaboration, and clarifies core value drivers for fast decision-making.
Activities

Asset acquisition and development
Sourcing, rigorous screening, and tailored deal structuring expand the portfolio by targeting high-return assets and balancing risk across technologies; global clean energy investment surpassed roughly US$1.1 trillion in 2023 and momentum continued into 2024, supporting deal flow. Greenfield and brownfield development deliver organic growth and portfolio diversification through new-build capacity and repowering projects. Robust due diligence de-risks permits, resource assessments, and interconnection; contracting secures offtake and construction pathways via PPAs and EPC agreements.
Project financing and capital recycling
Optimize leverage via project finance structures with typical debt sizing of 60–80% loan-to-capital while blending corporate facilities to lower blended cost of capital; the 10-year US Treasury averaged about 4.5% in 2024, informing pricing and hedging. Execute refinancings and asset rotations to crystallize value and recycle capital. Actively manage interest-rate and FX exposures and preserve covenant headroom to protect ratings.

Construction management and commissioning
Oversee EPC execution, assuring quality and HSE performance to minimize the delays McKinsey found when large projects run 20% longer and cost 80% over budget. Manage schedules, budgets, and change orders to control cost exposure and maintain cashflow forecasting. Coordinate interconnection, testing, and COD milestones while implementing punch lists and warranty claims workflows to accelerate final acceptance and reduce rework.

Operations, maintenance, and asset optimization
Monitor assets via SCADA and analytics to maximize availability, targeting >98% uptime; perform preventive and corrective maintenance with OEMs and O&M partners to limit unplanned outages. Optimize dispatch, curtailment, and bidding strategies to capture market value; pursue repowering and life extensions that commonly add 10–20 years and materially enhance returns.
- SCADA-driven uptime >98%
- O&M with OEMs for rapid MTTR
- Dispatch/market bids to maximize revenue
- Repowering adds 10–20 years life
Regulatory compliance and stakeholder engagement
Rigorous sourcing, tailored deals, 60–80% LTV and 4.5% 10y drive high-return clean assets
Sourcing with rigorous screening and tailored deals expands high-return assets; project finance uses 60–80% LTV and 10-year US Treasury ~4.5% (2024) to price risk. SCADA-driven O&M targets >98% uptime; repowering adds 10–20 years. CSRD rollout covers ~50,000 EU firms, guiding ESG and permitting engagement.
| Metric | 2024/Note |
|---|---|
| Clean energy investment | >$1.1T (2023) momentum into 2024 |
| 10y US Treasury | ~4.5% |
| Project debt LTV | 60–80% |
| Uptime (SCADA) | >98% |
| Repowering benefit | +10–20 years |
| CSRD scope | ~50,000 EU firms |
Delivered as Displayed
Business Model Canvas
The document you're previewing is the actual Capstone Infrastructure Business Model Canvas, not a mockup. When you purchase, you'll receive this exact file with all sections included. The deliverable comes ready-to-edit in Word and Excel formats, formatted as shown. No surprises—what you see is what you'll get.

Original: $10.00
-65%$10.00
$3.50Product Information
Product Information
Shipping & Returns
Shipping & Returns
Description
Unlock a complete Business Model Canvas for infrastructure firms — editable Word & Excel toolkit
Unlock the full strategic blueprint behind Capstone Infrastructure’s business model with our complete Business Model Canvas—detailing value propositions, key partners, revenue streams and cost structure. Ideal for investors, consultants and founders, the editable Word and Excel files make benchmarking and strategic planning simple. Purchase the full Canvas to turn insight into action and accelerate decision-making.
Partnerships
Utilities, ISOs, and grid operators
Partnerships with utilities, ISOs and grid operators enable interconnection, dispatch (day‑ahead and real‑time) and financial settlement processes, with typical utility PPAs spanning 15–25 years to underpin predictable cash flows. Collaboration ensures compliance with evolving grid codes and NERC/ISO reliability standards, while joint planning tackles congestion and coordinates system upgrades to support deliverability and minimize curtailment.
EPC contractors and OEM suppliers
EPC contractors deliver projects on time and on budget, cutting typical schedule slippage and cost overruns that historically erode returns; in 2024 utility‑scale solar CAPEX averaged about $500/kW. OEMs supply turbines (up to 15–20 MW offshore), PV panels, inverters and 10–25 year service agreements, reducing construction and technology risk. Performance guarantees and availability clauses improve bankability and safeguard asset uptime.
Financiers, lenders, and institutional investors
Commercial banks, infrastructure funds and pension plans (eg CPP Investments CAD 632B AUM, 2024) supply project and corporate capital; structured debt and tax-equity solutions can cut WACC by ~200–300 bps, optimizing returns. Active refinancing partners support lifecycle repricing to boost IRRs, while these relationships underpin pipeline scaling and M&A execution amid estimated $94T global infrastructure need to 2040.
Landowners, Indigenous communities, and municipalities
Site control and community consent are critical for permitting and social license, with many renewable and infrastructure projects including 1–3% revenue-sharing or lease payments to local partners. Partnerships align benefits through leases, revenue sharing, and local jobs, often creating dozens to hundreds of construction and ongoing roles per project. Indigenous engagement supports reconciliation and long-term stewardship via negotiated agreements and joint governance. Municipal cooperation accelerates zoning and infrastructure access, shortening timelines and lowering upfront capital risk.
- Site control: essential for permits
- Revenue sharing: commonly 1–3% of project revenues
- Jobs: dozens–hundreds per project
- Indigenous agreements: joint stewardship
- Municipal cooperation: faster zoning/infrastructure
Regulators and policy bodies
Strong ties with federal, provincial and state regulators across 63 jurisdictions as of 2024 (10 provinces + 3 territories + 50 states) ensure compliance and eligibility for programs. Policy insight informs bidding strategies and technology choices, shortening permitting timelines and protecting project economics. Regulatory clarity supports utility rate cases, while continuous dialogue manages evolving ESG and market rules.
- 63 jurisdictions engaged (10 provinces + 3 territories + 50 states)
- Policy-driven bids and tech selection
- Supports rate case approvals
- Ongoing ESG and market rule coordination
Partnerships secure 15–25y PPAs and $500/kW CAPEX
Partnerships with utilities/ISOs secure interconnection, dispatch and 15–25y PPAs for stable cash flows. EPCs and OEMs limit CAPEX/schedule risk (utility solar CAPEX ~$500/kW in 2024) with 10–25y service agreements. Capital partners (eg CPP Investments CAD 632B AUM, 2024) and regulators across 63 jurisdictions enable financing, permitting and market access.
| Metric | 2024 |
|---|---|
| Utility solar CAPEX | $500/kW |
| CPP Investments AUM | CAD 632B |
| Jurisdictions engaged | 63 |
What is included in the product
Detailed Word Document
A comprehensive, pre-written Business Model Canvas for Capstone Infrastructure that maps all nine BMC blocks with detailed value propositions, customer segments, channels and revenue logic, reflects real-world operations, includes SWOT-linked competitive analysis, and is presentation-ready for investors and lenders.
Customizable Excel Spreadsheet
Condenses Capstone Infrastructure’s strategy into a clean, editable one-page canvas that saves hours of setup, aids team collaboration, and clarifies core value drivers for fast decision-making.
Activities
Asset acquisition and development
Sourcing, rigorous screening, and tailored deal structuring expand the portfolio by targeting high-return assets and balancing risk across technologies; global clean energy investment surpassed roughly US$1.1 trillion in 2023 and momentum continued into 2024, supporting deal flow. Greenfield and brownfield development deliver organic growth and portfolio diversification through new-build capacity and repowering projects. Robust due diligence de-risks permits, resource assessments, and interconnection; contracting secures offtake and construction pathways via PPAs and EPC agreements.
Project financing and capital recycling
Optimize leverage via project finance structures with typical debt sizing of 60–80% loan-to-capital while blending corporate facilities to lower blended cost of capital; the 10-year US Treasury averaged about 4.5% in 2024, informing pricing and hedging. Execute refinancings and asset rotations to crystallize value and recycle capital. Actively manage interest-rate and FX exposures and preserve covenant headroom to protect ratings.
Construction management and commissioning
Oversee EPC execution, assuring quality and HSE performance to minimize the delays McKinsey found when large projects run 20% longer and cost 80% over budget. Manage schedules, budgets, and change orders to control cost exposure and maintain cashflow forecasting. Coordinate interconnection, testing, and COD milestones while implementing punch lists and warranty claims workflows to accelerate final acceptance and reduce rework.
Operations, maintenance, and asset optimization
Monitor assets via SCADA and analytics to maximize availability, targeting >98% uptime; perform preventive and corrective maintenance with OEMs and O&M partners to limit unplanned outages. Optimize dispatch, curtailment, and bidding strategies to capture market value; pursue repowering and life extensions that commonly add 10–20 years and materially enhance returns.
- SCADA-driven uptime >98%
- O&M with OEMs for rapid MTTR
- Dispatch/market bids to maximize revenue
- Repowering adds 10–20 years life
Regulatory compliance and stakeholder engagement
Rigorous sourcing, tailored deals, 60–80% LTV and 4.5% 10y drive high-return clean assets
Sourcing with rigorous screening and tailored deals expands high-return assets; project finance uses 60–80% LTV and 10-year US Treasury ~4.5% (2024) to price risk. SCADA-driven O&M targets >98% uptime; repowering adds 10–20 years. CSRD rollout covers ~50,000 EU firms, guiding ESG and permitting engagement.
| Metric | 2024/Note |
|---|---|
| Clean energy investment | >$1.1T (2023) momentum into 2024 |
| 10y US Treasury | ~4.5% |
| Project debt LTV | 60–80% |
| Uptime (SCADA) | >98% |
| Repowering benefit | +10–20 years |
| CSRD scope | ~50,000 EU firms |
Delivered as Displayed
Business Model Canvas
The document you're previewing is the actual Capstone Infrastructure Business Model Canvas, not a mockup. When you purchase, you'll receive this exact file with all sections included. The deliverable comes ready-to-edit in Word and Excel formats, formatted as shown. No surprises—what you see is what you'll get.