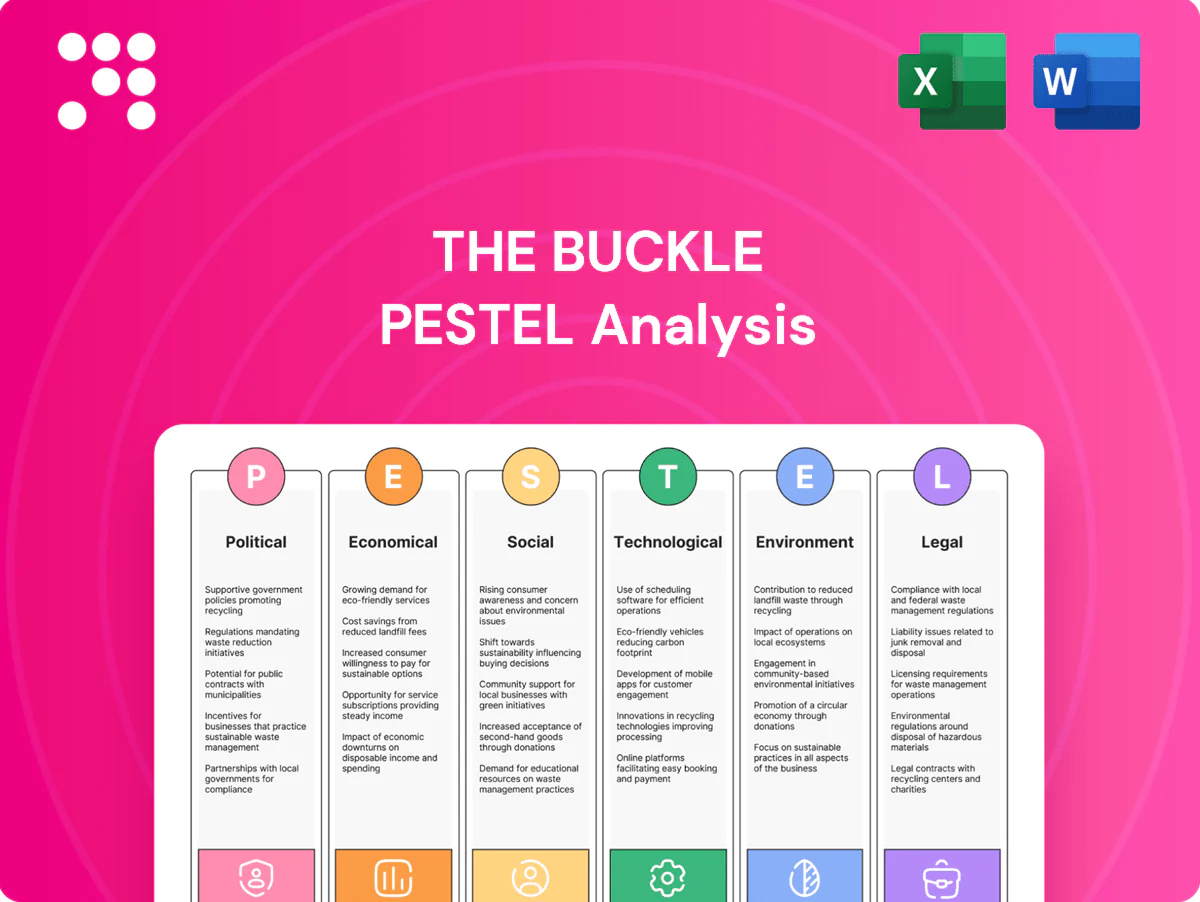
The Buckle PESTLE Analysis

Plan Smarter. Present Sharper. Compete Stronger.
Unlock strategic advantage with our PESTLE Analysis of The Buckle—concise, up-to-date insight into political, economic, social, technological, legal, and environmental forces shaping performance. Ideal for investors and strategists, it’s ready to use in boardrooms and plans. Purchase the full report for the complete, editable breakdown and actionable recommendations.
Political factors

Trade tariffs on apparel imports
Changes in U.S. trade policy, including Section 301 measures first imposed in 2018, can alter duty rates on denim, footwear and accessories—tariffs on affected Chinese apparel lines have ranged up to roughly 7.5–25% by HTS classification. Higher tariffs lift landed costs and squeeze margins or force retail price increases for chains like The Buckle. Diversifying sourcing across Mexico, Vietnam and Bangladesh and using USMCA/other FTAs can mitigate volatility. Close monitoring of USTR notices and ongoing Section 301 reviews remains essential.
State and local policy variability
State and local rules on wages, scheduling and retail operations—against a federal minimum wage of $7.25—create material cost and staffing variation for mall-based Buckle, which operates about 440 stores nationwide. Local tax incentives or zoning decisions can change store-opening economics and lease leverage, sometimes worth hundreds of thousands in incentives per location. Election cycles (notably 2024) shifted municipal priorities that affect permitting and retail subsidies. Scenario planning aligns Buckle’s footprint strategy with these policy risks.

Geopolitical supply chain disruptions
Political instability in key sourcing regions (China, Vietnam, Bangladesh) can interrupt fabric, trims and finished-goods flow, with apparel lead times lengthening by ~20% during recent disruptions. Port congestion and export controls have added 7–14 days on average and pushed spot container rates up ~25% year-over-year at peak stress. Building multi-country vendor bases and nearshoring (U.S./Mexico) reduces exposure, while strategic safety stock (8–12 weeks for critical SKUs) can buffer sudden shocks.

Crime prevention and public safety initiatives
Government strategies on organized retail crime (ORC) drive shrink and operating costs; retailers faced a national shrink rate of about 1.6% of sales in 2023 per the National Retail Federation, raising loss-prevention spend. Funding for law enforcement partnerships and prosecution standards varies by state, affecting recovery rates and legal costs. Engagement with retail associations helps shape ORC policy while store security investments must track policy effectiveness and ROI.
- ORC impact: 1.6% shrink (NRF 2023)
- Jurisdictional variance: enforcement funding differs state-by-state
- Policy influence: retail associations shape legislation
- Security capex: monitor effectiveness vs. legal outcomes
Sales tax policy and nexus rules
State-level sales tax changes directly affect The Buckle’s effective pricing and customer perception; 45 states plus DC levy sales tax, so rate or base shifts can change basket prices and margins. Post-Wayfair economic nexus rules mean multi-state e-commerce compliance complexity is widespread, and recent political momentum through 2024 has pushed states to broaden bases to capture digital sales. Strong tax engines and documented compliance processes materially limit exposure to audits, fines and back taxes.
- 45 states + DC levy sales tax
- Economic nexus widely adopted after Wayfair, raising multi-state compliance
- US e-commerce ~18% of retail in 2024, increasing tax focus
- Robust tax engines reduce audit and amnesty risk
Tariffs, ORC and port delays raise apparel landed costs; safety stock and sourcing cut risk
Trade tariffs (7.5–25% on some apparel lines) and Section 301 reviews raise landed costs for Buckle’s ~440 stores and e‑commerce. State wage/scheduling rules plus federal $7.25 minimum create store-level cost variance. ORC drove 1.6% shrink in 2023, raising security capex; port delays added ~7–14 days in disruptions. Diversified sourcing and 8–12 weeks safety stock mitigate risks.
| Issue | Impact | Key Metric |
|---|---|---|
| Tariffs | Higher COGS | 7.5–25% |
| ORC | Shrink/security cost | 1.6% (2023) |
| Sourcing delays | Lead‑time risk | +7–14 days |
| E‑tax | Compliance burden | E‑comm 18% (2024) |
What is included in the product
 Detailed Word Document
Explores how Political, Economic, Social, Technological, Environmental, and Legal forces uniquely impact The Buckle, with data-driven trends and industry-specific examples. Designed for executives, consultants, and investors, it offers forward-looking insights, scenario planning inputs, and formatted findings ready for business plans, decks, or reports.

 Customizable Excel Spreadsheet
A concise PESTLE summary of The Buckle that’s visually segmented by category and easily dropped into presentations or shared across teams, enabling quick alignment on external risks and market positioning while allowing users to add region- or business-specific notes for faster decision-making.
Economic factors

Consumer spending and confidence
Apparel demand is cyclical and tied to disposable income and sentiment; Conference Board consumer confidence averaged about 103 in 2024, shaping discretionary spend patterns. Weak confidence pushes consumers toward promotions and essentials, with apparel CPI rising roughly 3.7% YoY in 2024 signaling price sensitivity. Monitoring macro indicators guides inventory depth and fashion risk, and flexible buying helps match demand volatility.
Inflation and input cost pressures
Fabric, labor, and freight inflation continue to compress Buckle’s gross margins as input cost pressures persist; US headline inflation eased to 3.4% in 2023, but sector-specific cost inflation remains elevated. Price elasticity in mid-to-better casual wear limits full cost pass-through, so mix management and private label preserve value perception and margins. Hedging freight and tighter vendor terms help stabilize margins amid volatile logistics costs, which fell sharply from 2022 peaks into 2024.

Mall traffic and occupancy costs
Mall footfall trends directly move comp sales: U.S. mall traffic was down about 4% year-over-year in 2024, pressuring Buckle comp-store performance. Rent escalators and CAM charges, averaging roughly 8–10% of apparel retailers sales, compress four-wall profitability. Co-tenancy clauses and active landlord partnerships help optimize underperforming locations and reduce lease risks. Buckle’s omnichannel mix—e-commerce representing about 20% of sales in 2024—partially offsets mall traffic softness.

FX and sourcing currency exposure
Many apparel suppliers invoice in USD while local currencies such as BDT and VND have swung, feeding directly into FOB pricing; the US Dollar Index (DXY) rose roughly 6% year‑over‑year to mid‑2025, increasing import cost pressure. Volatile FX alters relative vendor competitiveness across Bangladesh, Vietnam and Mexico. Multi‑year purchase agreements and geographic sourcing diversification dampen price noise and currency pass‑through.
- USD invoicing common — raises exposure to DXY moves
- ~6% DXY YoY to mid‑2025 — higher import costs
- Longer contracts reduce short‑term price volatility
- Geographic diversification balances currency risk
Interest rates and credit conditions
Higher interest rates (Fed funds ~5.25–5.50% in 2024–H1 2025) push lease discount rates and raise inventory carrying costs; with US consumer credit growth and card balances up roughly 10–12% YoY in 2024, tighter credit can dent discretionary spend and mall traffic. Efficient working capital and 3–4x apparel inventory turns preserve cash, while targeted promotions protect AUR and sell-through.
- Rates: Fed ~5.25–5.50% (2024–H1 2025)
- Credit: card balances +10–12% YoY (2024)
- Inventory turns: 3–4x
- Focus: targeted promos to maintain AUR
Tariffs, ORC and port delays raise apparel landed costs; safety stock and sourcing cut risk
Apparel demand tracks disposable income; Conference Board confidence ~103 (2024) and apparel CPI +3.7% YoY (2024) drive promotion sensitivity. Input inflation (fabric, labor, freight) and ~6% DXY rise to mid‑2025 squeeze margins; Fed funds ~5.25–5.50% (2024–H1 2025) raises carrying costs while mall traffic -4% (2024) shifts sales online (~20% e‑comm 2024).
| Metric | Value |
|---|---|
| Consumer Confidence (2024) | ~103 |
| Apparel CPI YoY (2024) | +3.7% |
| Mall Traffic (2024) | -4% |
| E‑comm Share (2024) | ~20% |
| DXY YoY to mid‑2025 | +6% |
| Fed Funds (2024–H1 2025) | 5.25–5.50% |
Preview the Actual Deliverable
The Buckle PESTLE Analysis
The Buckle PESTLE Analysis preview shown here is the exact document you’ll receive after purchase—fully formatted and ready to use. This is the real file you’re buying, with the same content, structure, and professional layout visible now. No placeholders or teasers—download the finished report immediately after checkout.

Product Information
Product Information
Shipping & Returns
Shipping & Returns
Description
Plan Smarter. Present Sharper. Compete Stronger.
Unlock strategic advantage with our PESTLE Analysis of The Buckle—concise, up-to-date insight into political, economic, social, technological, legal, and environmental forces shaping performance. Ideal for investors and strategists, it’s ready to use in boardrooms and plans. Purchase the full report for the complete, editable breakdown and actionable recommendations.
Political factors
Trade tariffs on apparel imports
Changes in U.S. trade policy, including Section 301 measures first imposed in 2018, can alter duty rates on denim, footwear and accessories—tariffs on affected Chinese apparel lines have ranged up to roughly 7.5–25% by HTS classification. Higher tariffs lift landed costs and squeeze margins or force retail price increases for chains like The Buckle. Diversifying sourcing across Mexico, Vietnam and Bangladesh and using USMCA/other FTAs can mitigate volatility. Close monitoring of USTR notices and ongoing Section 301 reviews remains essential.
State and local policy variability
State and local rules on wages, scheduling and retail operations—against a federal minimum wage of $7.25—create material cost and staffing variation for mall-based Buckle, which operates about 440 stores nationwide. Local tax incentives or zoning decisions can change store-opening economics and lease leverage, sometimes worth hundreds of thousands in incentives per location. Election cycles (notably 2024) shifted municipal priorities that affect permitting and retail subsidies. Scenario planning aligns Buckle’s footprint strategy with these policy risks.
Geopolitical supply chain disruptions
Political instability in key sourcing regions (China, Vietnam, Bangladesh) can interrupt fabric, trims and finished-goods flow, with apparel lead times lengthening by ~20% during recent disruptions. Port congestion and export controls have added 7–14 days on average and pushed spot container rates up ~25% year-over-year at peak stress. Building multi-country vendor bases and nearshoring (U.S./Mexico) reduces exposure, while strategic safety stock (8–12 weeks for critical SKUs) can buffer sudden shocks.
Crime prevention and public safety initiatives
Government strategies on organized retail crime (ORC) drive shrink and operating costs; retailers faced a national shrink rate of about 1.6% of sales in 2023 per the National Retail Federation, raising loss-prevention spend. Funding for law enforcement partnerships and prosecution standards varies by state, affecting recovery rates and legal costs. Engagement with retail associations helps shape ORC policy while store security investments must track policy effectiveness and ROI.
- ORC impact: 1.6% shrink (NRF 2023)
- Jurisdictional variance: enforcement funding differs state-by-state
- Policy influence: retail associations shape legislation
- Security capex: monitor effectiveness vs. legal outcomes
Sales tax policy and nexus rules
State-level sales tax changes directly affect The Buckle’s effective pricing and customer perception; 45 states plus DC levy sales tax, so rate or base shifts can change basket prices and margins. Post-Wayfair economic nexus rules mean multi-state e-commerce compliance complexity is widespread, and recent political momentum through 2024 has pushed states to broaden bases to capture digital sales. Strong tax engines and documented compliance processes materially limit exposure to audits, fines and back taxes.
- 45 states + DC levy sales tax
- Economic nexus widely adopted after Wayfair, raising multi-state compliance
- US e-commerce ~18% of retail in 2024, increasing tax focus
- Robust tax engines reduce audit and amnesty risk
Tariffs, ORC and port delays raise apparel landed costs; safety stock and sourcing cut risk
Trade tariffs (7.5–25% on some apparel lines) and Section 301 reviews raise landed costs for Buckle’s ~440 stores and e‑commerce. State wage/scheduling rules plus federal $7.25 minimum create store-level cost variance. ORC drove 1.6% shrink in 2023, raising security capex; port delays added ~7–14 days in disruptions. Diversified sourcing and 8–12 weeks safety stock mitigate risks.
| Issue | Impact | Key Metric |
|---|---|---|
| Tariffs | Higher COGS | 7.5–25% |
| ORC | Shrink/security cost | 1.6% (2023) |
| Sourcing delays | Lead‑time risk | +7–14 days |
| E‑tax | Compliance burden | E‑comm 18% (2024) |
What is included in the product
Detailed Word Document
Explores how Political, Economic, Social, Technological, Environmental, and Legal forces uniquely impact The Buckle, with data-driven trends and industry-specific examples. Designed for executives, consultants, and investors, it offers forward-looking insights, scenario planning inputs, and formatted findings ready for business plans, decks, or reports.
Customizable Excel Spreadsheet
A concise PESTLE summary of The Buckle that’s visually segmented by category and easily dropped into presentations or shared across teams, enabling quick alignment on external risks and market positioning while allowing users to add region- or business-specific notes for faster decision-making.
Economic factors
Consumer spending and confidence
Apparel demand is cyclical and tied to disposable income and sentiment; Conference Board consumer confidence averaged about 103 in 2024, shaping discretionary spend patterns. Weak confidence pushes consumers toward promotions and essentials, with apparel CPI rising roughly 3.7% YoY in 2024 signaling price sensitivity. Monitoring macro indicators guides inventory depth and fashion risk, and flexible buying helps match demand volatility.
Inflation and input cost pressures
Fabric, labor, and freight inflation continue to compress Buckle’s gross margins as input cost pressures persist; US headline inflation eased to 3.4% in 2023, but sector-specific cost inflation remains elevated. Price elasticity in mid-to-better casual wear limits full cost pass-through, so mix management and private label preserve value perception and margins. Hedging freight and tighter vendor terms help stabilize margins amid volatile logistics costs, which fell sharply from 2022 peaks into 2024.
Mall traffic and occupancy costs
Mall footfall trends directly move comp sales: U.S. mall traffic was down about 4% year-over-year in 2024, pressuring Buckle comp-store performance. Rent escalators and CAM charges, averaging roughly 8–10% of apparel retailers sales, compress four-wall profitability. Co-tenancy clauses and active landlord partnerships help optimize underperforming locations and reduce lease risks. Buckle’s omnichannel mix—e-commerce representing about 20% of sales in 2024—partially offsets mall traffic softness.
FX and sourcing currency exposure
Many apparel suppliers invoice in USD while local currencies such as BDT and VND have swung, feeding directly into FOB pricing; the US Dollar Index (DXY) rose roughly 6% year‑over‑year to mid‑2025, increasing import cost pressure. Volatile FX alters relative vendor competitiveness across Bangladesh, Vietnam and Mexico. Multi‑year purchase agreements and geographic sourcing diversification dampen price noise and currency pass‑through.
- USD invoicing common — raises exposure to DXY moves
- ~6% DXY YoY to mid‑2025 — higher import costs
- Longer contracts reduce short‑term price volatility
- Geographic diversification balances currency risk
Interest rates and credit conditions
Higher interest rates (Fed funds ~5.25–5.50% in 2024–H1 2025) push lease discount rates and raise inventory carrying costs; with US consumer credit growth and card balances up roughly 10–12% YoY in 2024, tighter credit can dent discretionary spend and mall traffic. Efficient working capital and 3–4x apparel inventory turns preserve cash, while targeted promotions protect AUR and sell-through.
- Rates: Fed ~5.25–5.50% (2024–H1 2025)
- Credit: card balances +10–12% YoY (2024)
- Inventory turns: 3–4x
- Focus: targeted promos to maintain AUR
Tariffs, ORC and port delays raise apparel landed costs; safety stock and sourcing cut risk
Apparel demand tracks disposable income; Conference Board confidence ~103 (2024) and apparel CPI +3.7% YoY (2024) drive promotion sensitivity. Input inflation (fabric, labor, freight) and ~6% DXY rise to mid‑2025 squeeze margins; Fed funds ~5.25–5.50% (2024–H1 2025) raises carrying costs while mall traffic -4% (2024) shifts sales online (~20% e‑comm 2024).
| Metric | Value |
|---|---|
| Consumer Confidence (2024) | ~103 |
| Apparel CPI YoY (2024) | +3.7% |
| Mall Traffic (2024) | -4% |
| E‑comm Share (2024) | ~20% |
| DXY YoY to mid‑2025 | +6% |
| Fed Funds (2024–H1 2025) | 5.25–5.50% |
Preview the Actual Deliverable
The Buckle PESTLE Analysis
The Buckle PESTLE Analysis preview shown here is the exact document you’ll receive after purchase—fully formatted and ready to use. This is the real file you’re buying, with the same content, structure, and professional layout visible now. No placeholders or teasers—download the finished report immediately after checkout.











