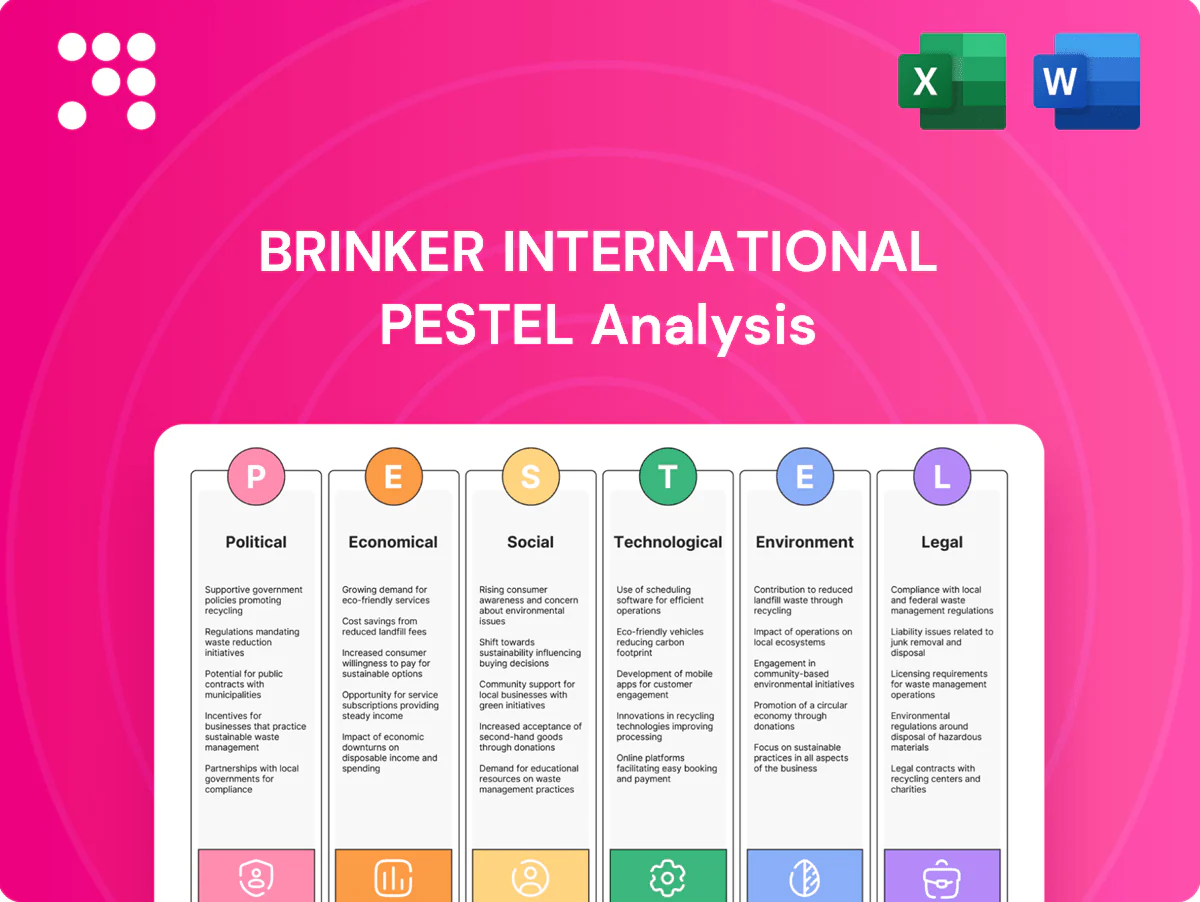
Brinker International PESTLE Analysis

Plan Smarter. Present Sharper. Compete Stronger.
Gain a strategic edge with our PESTLE analysis of Brinker International — concise insights into political, economic, social, technological, legal, and environmental forces shaping its performance. Perfect for investors and strategists, ready-to-use and editable. Purchase the full report to access detailed, actionable intelligence now.
Political factors

Food safety oversight and inspections
Government agencies including FDA (Food Code guidance), USDA and local health departments set and update food safety protocols restaurants must follow, with the CDC estimating 48 million foodborne illnesses annually in the US (about 128,000 hospitalizations, 3,000 deaths). Tighter standards raise training and compliance costs but lower incident risk and liability, given CDC’s $15.6 billion estimated annual economic burden of foodborne disease. Variability across states and countries complicates operational consistency, so proactive compliance preserves brand trust and minimizes disruption to franchise operations.
Minimum wage and labor policy shifts
Federal minimum wage remains $7.25/hr while the federal tip credit stands at $5.12, but many states (including California and Washington) have minimums above $15/hr, materially pressuring unit margins for multi-state operators like Brinker. Labor typically represents roughly 25-35% of restaurant sales, so rapid wage hikes force menu price moves and productivity initiatives. Tip-credit limits and scheduling mandates (predictive scheduling, paid sick leave) change labor models for casual dining. Varying jurisdictional rules complicate staffing and increase compliance costs across the portfolio.

Alcohol licensing and local ordinances
Serving alcohol is revenue-relevant for Brinker—on‑premise beverage sales account for about 15% of US restaurant revenue and the company operates roughly 1,300 restaurants (Chili’s, Maggiano’s). Local license availability, permitted hours and enforcement differ widely across states and municipalities, affecting bar mix and peak traffic patterns. Strong compliance programs preserve licenses and protect ancillary food and beverage sales.

Trade and tariff impacts on inputs
Tariffs on beef, produce, seafood and equipment raise landed costs for operators; US Section 301 tariffs on Chinese imports remain as high as 25%, impacting imported kitchen equipment and packaging.
Geopolitical shifts (trade tensions, port disruptions) can interrupt cross-border supply chains for Brinker, which runs roughly 1,600 restaurants globally, increasing volatility in food costs.
Sourcing diversification and menu engineering (price/portion adjustments, SKU rationalization) reduce concentration risk and help offset tariff-driven cost swings.
- Section 301 tariffs up to 25%
- Brinker ~1,600 restaurants
- Sourcing diversification lowers single-supplier exposure
- Menu engineering cushions margin pressure
Public health policy and emergencies
Government responses to health crises can force reduced dining-room capacity and shortened hours, lowering sales; U.S. restaurant receipts fell about 33% YoY at the April 2020 peak (U.S. Census). Vaccination, sanitation, and ventilation guidance shape hourly staffing, cleaning, and HVAC upgrades. Relief programs can partially offset demand shocks, while preparedness boosts continuity and guest confidence.
- Capacity limits: lower footfall, higher delivery mix
- Health protocols: added OPEX for sanitation/HVAC
- Relief support: temporary liquidity buffer
Regulatory costs, CDC 48M food illnesses, >$15 wages and tariffs press US casual-dining margins
Regulatory food-safety updates (FDA/USDA) raise compliance costs amid CDC’s 48M annual foodborne illnesses. State minimum wages often >15/hr squeeze margins for Brinker’s ~1,600 restaurants; labor is ~25–35% of sales. Alcohol ~15% of revenue; licensing varies. Tariffs (Section 301 up to 25%) and geopolitical supply shocks increase input volatility.
| Metric | Value |
|---|---|
| Restaurants | ~1,600 |
| Alcohol share | ~15% |
| Foodborne illnesses (US) | 48M/yr |
| Section 301 tariffs | Up to 25% |
What is included in the product
 Detailed Word Document
Explores how macro-environmental factors uniquely affect Brinker International across Political, Economic, Social, Technological, Environmental and Legal dimensions, with data-backed trends and specific subpoints to identify risks and opportunities. Designed for executives, investors and strategists, it delivers forward-looking insights and clean formatting ready for plans, decks, or reports.

 Customizable Excel Spreadsheet
A distilled PESTLE analysis for Brinker International that’s visually segmented, editable, and shareable—ideal for meetings, presentations, and cross-team alignment; supports external risk discussions and can be dropped into slides or strategy packs.
Economic factors

Consumer discretionary spending cycles
Casual dining traffic at Brinker brands is highly sensitive to real income and consumer confidence, so macro slowdowns typically shift demand toward value chains and at-home meals. To defend market share, promotions and price architecture must align with prevailing macro conditions. Active elasticity management—targeted discounts, menu mix, and upsell—protects comparable sales and margins.
Food commodity price volatility
Beef, chicken, dairy, wheat and produce prices can swing widely with supply-demand imbalances and weather — commonly moving 10–30% across cycles. Brinker uses hedging and supplier contracts to smooth near-term spikes, typically locking costs for 6–12 months. Menu mix, portioning and premium/ value shifts preserve margins, recovering 2–4% on targeted items. Rapid COGS moves (quarterly 3–6% swings) force an agile pricing cadence.

Labor availability and wage inflation
Tight US labor markets (unemployment ~3.7% in 2024) pushed hourly and management pay up, with restaurant-sector wage growth exceeding private‑sector averages (leisure and hospitality wages rose roughly 5–6% YoY in 2024). Brinker counters with targeted training and retention programs to cut turnover drag and labor costs. Investment in POS automation, labor scheduling and kitchen tech can offset higher wage rates. Market-by-market differences force localized staffing and pay plans.

Interest rates and capital access
- Higher rates: increased cost of capital, slower unit growth
- Debt costs: prioritize remodels vs. new openings
- Cash generation: funds upgrades and franchise support
- Balance sheet flexibility: enables opportunistic M&A or rollouts
Foreign exchange and international exposure
Operations and sourcing across borders expose Brinker to FX translation risk as revenues and cost inputs booked in multiple currencies can swing reported U.S. dollar results.
Management uses natural hedges from local sourcing and pricing plus financial hedging to limit volatility, maintaining unit economics despite exchange moves.
Local pricing power at Chili’s and Maggiano’s supports margin resilience in markets where currency pressures raise input costs.
- FX translation risk: cross-border revenues and costs
- Mitigation: natural hedges + financial hedging
- Resilience: local pricing power sustains unit economics
Regulatory costs, CDC 48M food illnesses, >$15 wages and tariffs press US casual-dining margins
Casual-dining demand is GDP- and confidence-sensitive; unemployment ~3.7% (2024) and slower consumption shift traffic to value. Input costs (beef/chicken/dairy/wheat/produce) swing 10–30% across cycles; Brinker hedges 6–12 months and manages menu mix to recover 2–4% margin. Wage inflation (leisure & hospitality +5–6% YoY 2024) raises labor cost; automation and scheduling tech offset increases. Higher rates (Fed funds 5.25–5.50% mid‑2024) constrain expansion.
| Metric | 2024/2025 |
|---|---|
| Unemployment | ~3.7% |
| Fed funds | 5.25–5.50% |
| Wage growth (L&H) | +5–6% YoY |
| Commodity swings | 10–30% |
Same Document Delivered
Brinker International PESTLE Analysis
This Brinker International PESTLE Analysis preview is the exact, fully formatted document you’ll receive after purchase—no placeholders or teasers. The layout, content, and structure shown here are identical to the downloadable file delivered immediately after payment. Use it as a ready-to-use, professionally structured report for analysis or presentation.

Product Information
Product Information
Shipping & Returns
Shipping & Returns
Description
Plan Smarter. Present Sharper. Compete Stronger.
Gain a strategic edge with our PESTLE analysis of Brinker International — concise insights into political, economic, social, technological, legal, and environmental forces shaping its performance. Perfect for investors and strategists, ready-to-use and editable. Purchase the full report to access detailed, actionable intelligence now.
Political factors
Food safety oversight and inspections
Government agencies including FDA (Food Code guidance), USDA and local health departments set and update food safety protocols restaurants must follow, with the CDC estimating 48 million foodborne illnesses annually in the US (about 128,000 hospitalizations, 3,000 deaths). Tighter standards raise training and compliance costs but lower incident risk and liability, given CDC’s $15.6 billion estimated annual economic burden of foodborne disease. Variability across states and countries complicates operational consistency, so proactive compliance preserves brand trust and minimizes disruption to franchise operations.
Minimum wage and labor policy shifts
Federal minimum wage remains $7.25/hr while the federal tip credit stands at $5.12, but many states (including California and Washington) have minimums above $15/hr, materially pressuring unit margins for multi-state operators like Brinker. Labor typically represents roughly 25-35% of restaurant sales, so rapid wage hikes force menu price moves and productivity initiatives. Tip-credit limits and scheduling mandates (predictive scheduling, paid sick leave) change labor models for casual dining. Varying jurisdictional rules complicate staffing and increase compliance costs across the portfolio.
Alcohol licensing and local ordinances
Serving alcohol is revenue-relevant for Brinker—on‑premise beverage sales account for about 15% of US restaurant revenue and the company operates roughly 1,300 restaurants (Chili’s, Maggiano’s). Local license availability, permitted hours and enforcement differ widely across states and municipalities, affecting bar mix and peak traffic patterns. Strong compliance programs preserve licenses and protect ancillary food and beverage sales.
Trade and tariff impacts on inputs
Tariffs on beef, produce, seafood and equipment raise landed costs for operators; US Section 301 tariffs on Chinese imports remain as high as 25%, impacting imported kitchen equipment and packaging.
Geopolitical shifts (trade tensions, port disruptions) can interrupt cross-border supply chains for Brinker, which runs roughly 1,600 restaurants globally, increasing volatility in food costs.
Sourcing diversification and menu engineering (price/portion adjustments, SKU rationalization) reduce concentration risk and help offset tariff-driven cost swings.
- Section 301 tariffs up to 25%
- Brinker ~1,600 restaurants
- Sourcing diversification lowers single-supplier exposure
- Menu engineering cushions margin pressure
Public health policy and emergencies
Government responses to health crises can force reduced dining-room capacity and shortened hours, lowering sales; U.S. restaurant receipts fell about 33% YoY at the April 2020 peak (U.S. Census). Vaccination, sanitation, and ventilation guidance shape hourly staffing, cleaning, and HVAC upgrades. Relief programs can partially offset demand shocks, while preparedness boosts continuity and guest confidence.
- Capacity limits: lower footfall, higher delivery mix
- Health protocols: added OPEX for sanitation/HVAC
- Relief support: temporary liquidity buffer
Regulatory costs, CDC 48M food illnesses, >$15 wages and tariffs press US casual-dining margins
Regulatory food-safety updates (FDA/USDA) raise compliance costs amid CDC’s 48M annual foodborne illnesses. State minimum wages often >15/hr squeeze margins for Brinker’s ~1,600 restaurants; labor is ~25–35% of sales. Alcohol ~15% of revenue; licensing varies. Tariffs (Section 301 up to 25%) and geopolitical supply shocks increase input volatility.
| Metric | Value |
|---|---|
| Restaurants | ~1,600 |
| Alcohol share | ~15% |
| Foodborne illnesses (US) | 48M/yr |
| Section 301 tariffs | Up to 25% |
What is included in the product
Detailed Word Document
Explores how macro-environmental factors uniquely affect Brinker International across Political, Economic, Social, Technological, Environmental and Legal dimensions, with data-backed trends and specific subpoints to identify risks and opportunities. Designed for executives, investors and strategists, it delivers forward-looking insights and clean formatting ready for plans, decks, or reports.
Customizable Excel Spreadsheet
A distilled PESTLE analysis for Brinker International that’s visually segmented, editable, and shareable—ideal for meetings, presentations, and cross-team alignment; supports external risk discussions and can be dropped into slides or strategy packs.
Economic factors
Consumer discretionary spending cycles
Casual dining traffic at Brinker brands is highly sensitive to real income and consumer confidence, so macro slowdowns typically shift demand toward value chains and at-home meals. To defend market share, promotions and price architecture must align with prevailing macro conditions. Active elasticity management—targeted discounts, menu mix, and upsell—protects comparable sales and margins.
Food commodity price volatility
Beef, chicken, dairy, wheat and produce prices can swing widely with supply-demand imbalances and weather — commonly moving 10–30% across cycles. Brinker uses hedging and supplier contracts to smooth near-term spikes, typically locking costs for 6–12 months. Menu mix, portioning and premium/ value shifts preserve margins, recovering 2–4% on targeted items. Rapid COGS moves (quarterly 3–6% swings) force an agile pricing cadence.
Labor availability and wage inflation
Tight US labor markets (unemployment ~3.7% in 2024) pushed hourly and management pay up, with restaurant-sector wage growth exceeding private‑sector averages (leisure and hospitality wages rose roughly 5–6% YoY in 2024). Brinker counters with targeted training and retention programs to cut turnover drag and labor costs. Investment in POS automation, labor scheduling and kitchen tech can offset higher wage rates. Market-by-market differences force localized staffing and pay plans.
Interest rates and capital access
- Higher rates: increased cost of capital, slower unit growth
- Debt costs: prioritize remodels vs. new openings
- Cash generation: funds upgrades and franchise support
- Balance sheet flexibility: enables opportunistic M&A or rollouts
Foreign exchange and international exposure
Operations and sourcing across borders expose Brinker to FX translation risk as revenues and cost inputs booked in multiple currencies can swing reported U.S. dollar results.
Management uses natural hedges from local sourcing and pricing plus financial hedging to limit volatility, maintaining unit economics despite exchange moves.
Local pricing power at Chili’s and Maggiano’s supports margin resilience in markets where currency pressures raise input costs.
- FX translation risk: cross-border revenues and costs
- Mitigation: natural hedges + financial hedging
- Resilience: local pricing power sustains unit economics
Regulatory costs, CDC 48M food illnesses, >$15 wages and tariffs press US casual-dining margins
Casual-dining demand is GDP- and confidence-sensitive; unemployment ~3.7% (2024) and slower consumption shift traffic to value. Input costs (beef/chicken/dairy/wheat/produce) swing 10–30% across cycles; Brinker hedges 6–12 months and manages menu mix to recover 2–4% margin. Wage inflation (leisure & hospitality +5–6% YoY 2024) raises labor cost; automation and scheduling tech offset increases. Higher rates (Fed funds 5.25–5.50% mid‑2024) constrain expansion.
| Metric | 2024/2025 |
|---|---|
| Unemployment | ~3.7% |
| Fed funds | 5.25–5.50% |
| Wage growth (L&H) | +5–6% YoY |
| Commodity swings | 10–30% |
Same Document Delivered
Brinker International PESTLE Analysis
This Brinker International PESTLE Analysis preview is the exact, fully formatted document you’ll receive after purchase—no placeholders or teasers. The layout, content, and structure shown here are identical to the downloadable file delivered immediately after payment. Use it as a ready-to-use, professionally structured report for analysis or presentation.











