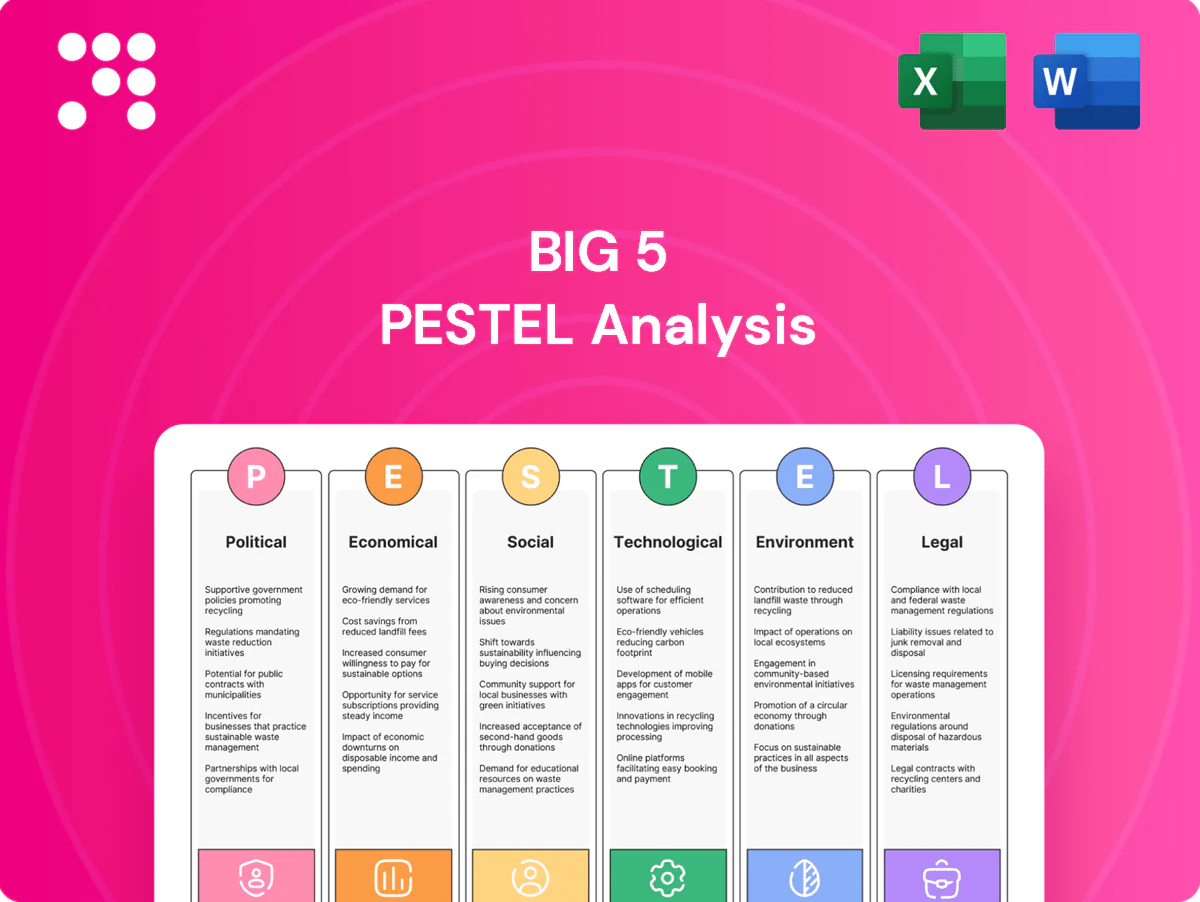
Big 5 PESTLE Analysis

Your Shortcut to Market Insight Starts Here
Unlock how political, economic, social, technological, legal, and environmental forces shape Big 5’s trajectory with our concise PESTLE snapshot—perfect for investors and strategists seeking fast, actionable insight. This expert analysis highlights key risks and opportunities you can use today. Purchase the full PESTLE to get the complete, editable report and start making data-driven decisions immediately.
Political factors

State firearms and hunting rules
Changes to hunting seasons, background checks, and ammunition laws directly alter demand and in-store procedures; over 20 million annual FBI NICS checks underline background screening scale. Stricter controls can reduce firearms and ammo sales while increasing compliance costs and recordkeeping burdens. Looser rules often lift foot traffic but require greater oversight. Monitoring 50-state variation is essential for assortment planning.
Trade policy and import tariffs
Big 5 relies heavily on imported footwear, apparel and equipment, so trade policy shifts directly affect landed costs; notably, the 2018 Section 301 tariffs placed up to 25% duties on about $250 billion of Chinese goods, raising input prices for many retailers.
New tariffs or tariff escalations on China or alternative sourcing hubs can compress margins and force retail price hikes; in 2023–24 rerouting and nearshoring raised logistics costs by mid-single digits for some apparel chains.
Diversifying sourcing across Vietnam, Bangladesh, India and Mexico, and using bonded warehouses and tariff engineering, mitigates tariff and geopolitical shocks to margin structure.

Public safety and retail theft priorities
Local prosecutorial policies and policing levels materially affect shrink and operating risk; NRF estimated retail shrink cost US retailers about $94.5 billion in 2022 (roughly 1.9% of sales),集中 in jurisdictions with lower enforcement. Rising organized retail crime drives higher security spend and compresses margins as loss-prevention budgets and insurance costs climb. Active advocacy and collaboration with law enforcement, plus store-location strategy informed by crime trends and local enforcement data, reduce incident frequency and financial impact.

Minimum wage and regional labor policy
State and municipal wage floors materially affect store-level profitability; the federal minimum remains 7.25 USD while high-cost states like California set 16.00 USD, forcing retailers to absorb higher hourly costs or raise prices.
Rapid local increases compress margins unless offset by better mix, pricing, or productivity; scheduling and break rules (varying by jurisdiction) add compliance complexity and labor-cost volatility.
Workforce planning must be tailored to jurisdictional differences to protect margins and maintain service levels.
Land use and permitting
Zoning, signage rules and store permits directly shape expansion and remodel timelines; in 2024 industry surveys found permitting delays often add 6–9 months and can raise capex roughly 10–15% while increasing opportunity cost. Outdoor product categories frequently trigger special permits and inspections, further slowing rollouts. Proactive engagement with local authorities shortens approval cycles and limits escalation of costs.
- Zoning impacts site selection speed
- Signage rules affect brand rollout
- Outdoor products may need special permits
- Permitting delays (2024) add 6–9 months, ~10–15% capex
- Engage regulators early to reduce costs
Regulation, tariffs, labor and shrink squeeze margins; NICS 20M+, $94.5B shrink
Regulatory shifts (gun laws, background checks: 20M+ NICS/year) change demand and compliance; tariffs (2018 Section 301: up to 25% on ~$250B Chinese goods) raise landed costs; shrink hits retailers ~$94.5B in 2022; labor floors (federal $7.25, CA $16.00; 30 states+DC above federal) and permitting delays (6–9 months, +10–15% capex) affect margins.
| Metric | 2022–24 |
|---|---|
| NICS checks | 20M+ |
| Shrink cost | $94.5B (2022) |
| Tariff scope | ~$250B, up to 25% |
| Min wage | Fed $7.25; CA $16.00 |
| Permitting impact | 6–9m, +10–15% capex |
What is included in the product
 Detailed Word Document
Concise PESTLE analysis of the Big 5 examining Political, Economic, Social, Technological, Environmental and Legal drivers with data-backed trends and region/industry relevance. Designed for executives and investors, it includes forward-looking insights, scenario implications and ready-to-insert formatting to inform strategy and funding decisions.

 Customizable Excel Spreadsheet
Big 5 PESTLE Analysis delivers a compact, visually segmented summary of the five key external forces for quick reference in meetings or presentations, with editable notes for adapting insights to region or business line and speeding team alignment.
Economic factors

Consumer discretionary cycles
Big 5 targets value-conscious shoppers who tightened spending during macro slowdowns; US unemployment averaged ~3.8% in 2024 and inflation eased to ~3.4% that year, supporting cautious trade-down behavior. In downturns trade-down lifts store traffic but suppresses average ticket and category mix; in expansions higher-end footwear, apparel and team-sports recover strongly. Consistent promotional discipline preserves margin across the cycle.
Inflation and input costs
Rising materials, labor and ocean freight pushed footwear and apparel input costs higher, with US CPI easing to about 3.4% year-over-year by mid-2025 while input-cost pressures in apparel firms remained elevated. Passing through these increases risks elastic demand and volume loss; retailers with private-label penetration near 20–25% in 2024 protected margins via higher SKU control and vendor-rate negotiations. Inventory turns must be tightened and repriced to reflect new cost baselines and avoid margin erosion.

Interest rates and credit conditions
Higher policy rates around 5% in major markets (2024–25) cool consumer spending on discretionary gear and tighten auto and apparel sales; US consumer credit outstanding stood near $4.5 trillion in 2024, amplifying repayment pressure. They also raise lease financing and working-capital costs by several hundred basis points, squeezing margins. Lower rates can revive big-ticket and seasonal categories as borrowing costs fall. Robust liquidity management—corporate cash buffers >$3.5 trillion in 2024—helps absorb volatility.

Labor market tightness
Tight labor markets—U.S. unemployment near 3.7% and average hourly earnings up about 4% YoY in mid‑2025—push wages and turnover higher, eroding service consistency and upsell rates when staffing stability lags. Targeted training, incentive pay and flexible scheduling tech measurably raise conversion and reduce coverage gaps.
- Wage pressure: +4% YoY
- Turnover risk: higher quits, lower retention
- Training boosts conversion
- Flexible scheduling cuts coverage gaps
Fuel and logistics volatility
- Freight volatility: spot rate normalization 2024
- Fuel impact: logistics cost variability ~10–30%
- Seasonal spikes: rate increases 15–40%
- Mitigants: regional DCs, drop-ship, cross-dock
Regulation, tariffs, labor and shrink squeeze margins; NICS 20M+, $94.5B shrink
Economic mix: 2024 US unemployment ~3.8% and inflation ~3.4% drove trade-down; policy rates ~5% (2024–25) and $4.5T consumer credit curb discretionary spend. Wages rose ~4% YoY by mid‑2025, lifting labor costs; private‑label (20–25% penetration in 2024) helped margin defense. Freight/fuel volatility altered landed costs (±10–30%; seasonal +15–40%).
| Metric | Value |
|---|---|
| Unemployment (2024) | ~3.8% |
| Inflation (2024) | ~3.4% |
| Policy rates (2024–25) | ~5% |
| Consumer credit (2024) | $4.5T |
| Wage growth (mid‑2025) | ~4% YoY |
| Private‑label (2024) | 20–25% |
| Freight volatility | ±10–30% (season +15–40%) |
Full Version Awaits
Big 5 PESTLE Analysis
The Big 5 PESTLE Analysis evaluates Political, Economic, Social, Technological and Legal drivers to clarify external risks and opportunities for strategy and planning. It distills complex macro trends into concise, actionable insights for decision makers. The preview shown here is the exact document you’ll receive after purchase—fully formatted and ready to use.

Original: $10.00
-65%$10.00
$3.50Product Information
Product Information
Shipping & Returns
Shipping & Returns
Description
Your Shortcut to Market Insight Starts Here
Unlock how political, economic, social, technological, legal, and environmental forces shape Big 5’s trajectory with our concise PESTLE snapshot—perfect for investors and strategists seeking fast, actionable insight. This expert analysis highlights key risks and opportunities you can use today. Purchase the full PESTLE to get the complete, editable report and start making data-driven decisions immediately.
Political factors
State firearms and hunting rules
Changes to hunting seasons, background checks, and ammunition laws directly alter demand and in-store procedures; over 20 million annual FBI NICS checks underline background screening scale. Stricter controls can reduce firearms and ammo sales while increasing compliance costs and recordkeeping burdens. Looser rules often lift foot traffic but require greater oversight. Monitoring 50-state variation is essential for assortment planning.
Trade policy and import tariffs
Big 5 relies heavily on imported footwear, apparel and equipment, so trade policy shifts directly affect landed costs; notably, the 2018 Section 301 tariffs placed up to 25% duties on about $250 billion of Chinese goods, raising input prices for many retailers.
New tariffs or tariff escalations on China or alternative sourcing hubs can compress margins and force retail price hikes; in 2023–24 rerouting and nearshoring raised logistics costs by mid-single digits for some apparel chains.
Diversifying sourcing across Vietnam, Bangladesh, India and Mexico, and using bonded warehouses and tariff engineering, mitigates tariff and geopolitical shocks to margin structure.
Public safety and retail theft priorities
Local prosecutorial policies and policing levels materially affect shrink and operating risk; NRF estimated retail shrink cost US retailers about $94.5 billion in 2022 (roughly 1.9% of sales),集中 in jurisdictions with lower enforcement. Rising organized retail crime drives higher security spend and compresses margins as loss-prevention budgets and insurance costs climb. Active advocacy and collaboration with law enforcement, plus store-location strategy informed by crime trends and local enforcement data, reduce incident frequency and financial impact.
Minimum wage and regional labor policy
State and municipal wage floors materially affect store-level profitability; the federal minimum remains 7.25 USD while high-cost states like California set 16.00 USD, forcing retailers to absorb higher hourly costs or raise prices.
Rapid local increases compress margins unless offset by better mix, pricing, or productivity; scheduling and break rules (varying by jurisdiction) add compliance complexity and labor-cost volatility.
Workforce planning must be tailored to jurisdictional differences to protect margins and maintain service levels.
Land use and permitting
Zoning, signage rules and store permits directly shape expansion and remodel timelines; in 2024 industry surveys found permitting delays often add 6–9 months and can raise capex roughly 10–15% while increasing opportunity cost. Outdoor product categories frequently trigger special permits and inspections, further slowing rollouts. Proactive engagement with local authorities shortens approval cycles and limits escalation of costs.
- Zoning impacts site selection speed
- Signage rules affect brand rollout
- Outdoor products may need special permits
- Permitting delays (2024) add 6–9 months, ~10–15% capex
- Engage regulators early to reduce costs
Regulation, tariffs, labor and shrink squeeze margins; NICS 20M+, $94.5B shrink
Regulatory shifts (gun laws, background checks: 20M+ NICS/year) change demand and compliance; tariffs (2018 Section 301: up to 25% on ~$250B Chinese goods) raise landed costs; shrink hits retailers ~$94.5B in 2022; labor floors (federal $7.25, CA $16.00; 30 states+DC above federal) and permitting delays (6–9 months, +10–15% capex) affect margins.
| Metric | 2022–24 |
|---|---|
| NICS checks | 20M+ |
| Shrink cost | $94.5B (2022) |
| Tariff scope | ~$250B, up to 25% |
| Min wage | Fed $7.25; CA $16.00 |
| Permitting impact | 6–9m, +10–15% capex |
What is included in the product
Detailed Word Document
Concise PESTLE analysis of the Big 5 examining Political, Economic, Social, Technological, Environmental and Legal drivers with data-backed trends and region/industry relevance. Designed for executives and investors, it includes forward-looking insights, scenario implications and ready-to-insert formatting to inform strategy and funding decisions.
Customizable Excel Spreadsheet
Big 5 PESTLE Analysis delivers a compact, visually segmented summary of the five key external forces for quick reference in meetings or presentations, with editable notes for adapting insights to region or business line and speeding team alignment.
Economic factors
Consumer discretionary cycles
Big 5 targets value-conscious shoppers who tightened spending during macro slowdowns; US unemployment averaged ~3.8% in 2024 and inflation eased to ~3.4% that year, supporting cautious trade-down behavior. In downturns trade-down lifts store traffic but suppresses average ticket and category mix; in expansions higher-end footwear, apparel and team-sports recover strongly. Consistent promotional discipline preserves margin across the cycle.
Inflation and input costs
Rising materials, labor and ocean freight pushed footwear and apparel input costs higher, with US CPI easing to about 3.4% year-over-year by mid-2025 while input-cost pressures in apparel firms remained elevated. Passing through these increases risks elastic demand and volume loss; retailers with private-label penetration near 20–25% in 2024 protected margins via higher SKU control and vendor-rate negotiations. Inventory turns must be tightened and repriced to reflect new cost baselines and avoid margin erosion.
Interest rates and credit conditions
Higher policy rates around 5% in major markets (2024–25) cool consumer spending on discretionary gear and tighten auto and apparel sales; US consumer credit outstanding stood near $4.5 trillion in 2024, amplifying repayment pressure. They also raise lease financing and working-capital costs by several hundred basis points, squeezing margins. Lower rates can revive big-ticket and seasonal categories as borrowing costs fall. Robust liquidity management—corporate cash buffers >$3.5 trillion in 2024—helps absorb volatility.
Labor market tightness
Tight labor markets—U.S. unemployment near 3.7% and average hourly earnings up about 4% YoY in mid‑2025—push wages and turnover higher, eroding service consistency and upsell rates when staffing stability lags. Targeted training, incentive pay and flexible scheduling tech measurably raise conversion and reduce coverage gaps.
- Wage pressure: +4% YoY
- Turnover risk: higher quits, lower retention
- Training boosts conversion
- Flexible scheduling cuts coverage gaps
Fuel and logistics volatility
- Freight volatility: spot rate normalization 2024
- Fuel impact: logistics cost variability ~10–30%
- Seasonal spikes: rate increases 15–40%
- Mitigants: regional DCs, drop-ship, cross-dock
Regulation, tariffs, labor and shrink squeeze margins; NICS 20M+, $94.5B shrink
Economic mix: 2024 US unemployment ~3.8% and inflation ~3.4% drove trade-down; policy rates ~5% (2024–25) and $4.5T consumer credit curb discretionary spend. Wages rose ~4% YoY by mid‑2025, lifting labor costs; private‑label (20–25% penetration in 2024) helped margin defense. Freight/fuel volatility altered landed costs (±10–30%; seasonal +15–40%).
| Metric | Value |
|---|---|
| Unemployment (2024) | ~3.8% |
| Inflation (2024) | ~3.4% |
| Policy rates (2024–25) | ~5% |
| Consumer credit (2024) | $4.5T |
| Wage growth (mid‑2025) | ~4% YoY |
| Private‑label (2024) | 20–25% |
| Freight volatility | ±10–30% (season +15–40%) |
Full Version Awaits
Big 5 PESTLE Analysis
The Big 5 PESTLE Analysis evaluates Political, Economic, Social, Technological and Legal drivers to clarify external risks and opportunities for strategy and planning. It distills complex macro trends into concise, actionable insights for decision makers. The preview shown here is the exact document you’ll receive after purchase—fully formatted and ready to use.











