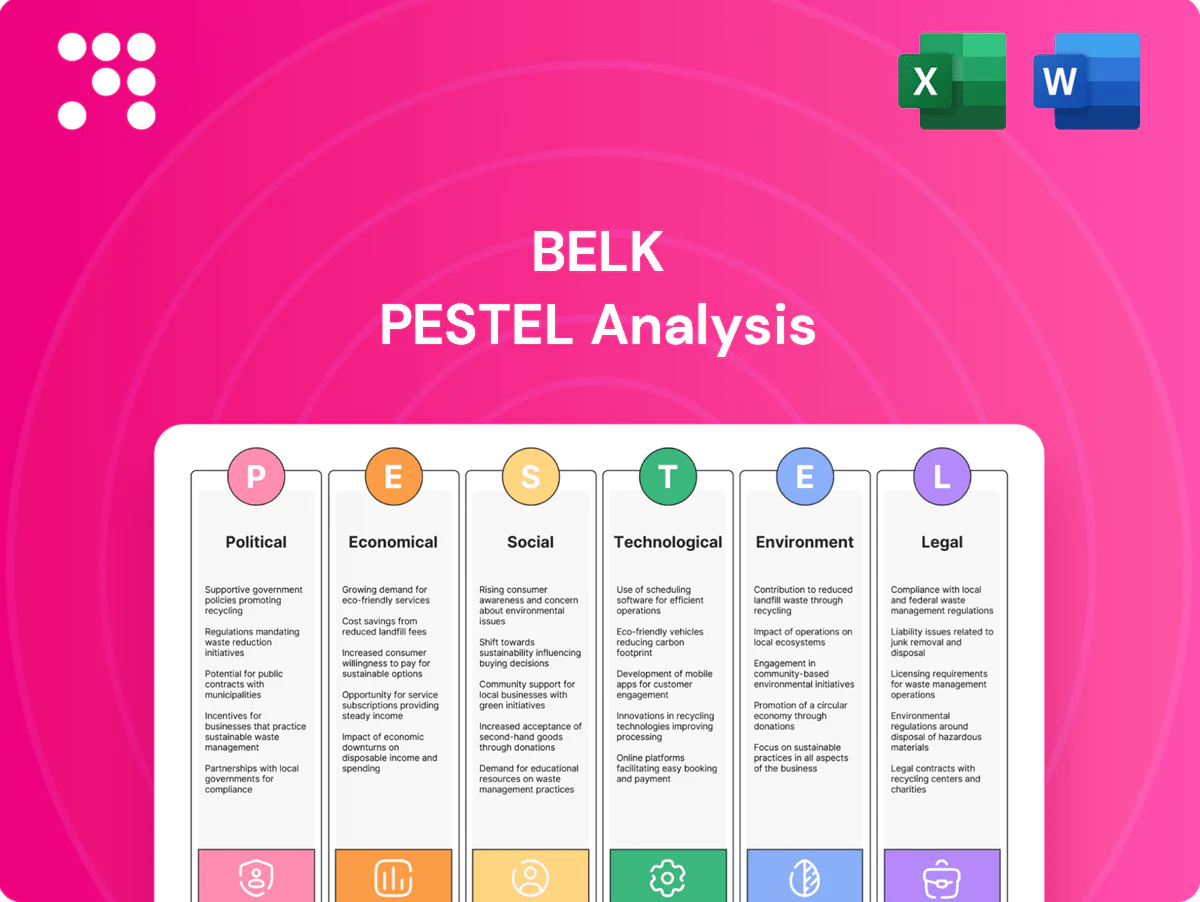
Belk PESTLE Analysis

Your Competitive Advantage Starts with This Report
Discover how political shifts, consumer trends, and technological disruption are shaping Belk’s outlook in our concise PESTLE snapshot—ideal for investors and strategists. Purchase the full, editable PESTLE analysis to access deep-dive insights, risk forecasts, and practical recommendations ready for immediate use.
Political factors

State tax policy shifts
State shifts in Southern sales-tax holidays and exemptions directly affect Belk’s pricing strategy and foot traffic, as temporary tax-free weekends can spike apparel sales and cannibalize regular-season demand. Incentive packages from states such as North Carolina and South Carolina influence store expansion timing and capex allocation. Fiscal pressures raising consumption or business taxes compress margins and force tighter promotions. Belk, based in Charlotte, must rapidly align promotions and inventory to these changing regimes.
Trade and tariff exposure
Tariffs on apparel, footwear and home goods from Asia — including additional Section 301 duties of up to 25% since 2018 — raise landed costs for Belk and squeeze gross margins. Frequent policy shifts complicate multi-year sourcing and pricing decisions, increasing working capital and lead-time risk. Diversifying countries of origin reduces exposure to country-specific tariffs. Clear pass-through pricing and cost-plus strategies help preserve margins.

Infrastructure and logistics funding
State and federal infrastructure funding directly affects Belk lead times: the 2021 Bipartisan Infrastructure Law allocated about 110 billion USD for roads and bridges and roughly 17 billion USD for ports and waterways, improving transit reliability. Southeast port upgrades at Savannah and Charleston have raised inbound capacity, reducing variability in arrivals. Budget cuts or grant delays, however, raise freight congestion and costs, disrupting Belk store replenishment that depends on predictable transit.

Labor and workforce policies
Policy debates over minimum wage and scheduling rules shape Belk's labor costs; the federal minimum wage remains $7.25/hr (since 2009) while many states set higher rates. Expanded childcare supports, notably the 2021 temporary expansion of the Child and Dependent Care Tax Credit under ARPA, have increased labor supply in past years. WIOA funding was about $3.3 billion in FY2024, supporting recruitment and requiring agile staffing models for compliance.
- Minimum wage: $7.25 federal (since 2009)
- Childcare policy: ARPA 2021 CDC Tax Credit expanded support
- Workforce training: WIOA ≈ $3.3B FY2024
- Operational need: agile staffing for compliance
Disaster preparedness governance
Regional emergency management policies shape Belk's storm response; evacuation and curfew orders have forced temporary closures across Belk's roughly 300-store footprint, disrupting sales and supply chains. Access to federal and state resilience grants reduces capital needed for mitigation projects. Proactive coordination with local authorities shortens downtime and aids inventory protection.
- Regional policy impact: enforced closures
- Financial relief: resilience grants offset mitigation costs
- Operational benefit: coordination reduces downtime
Tariffs up to 25% raise COGS; tax-free weekends spike apparel sales
State sales-tax holidays and exemptions shift Belk pricing and foot traffic; temporary tax-free weekends can spike apparel sales. Tariffs, including Section 301 duties up to 25%, raise landed costs and compress margins. Infrastructure funding (BIL: ~110B roads/bridges, ~17B ports) and SE port upgrades reduce transit variability. Labor rules (federal min wage $7.25; WIOA ≈ $3.3B FY2024) alter staffing costs.
| Factor | Metric | Impact |
|---|---|---|
| Tariffs | Up to 25% Section 301 | Higher COGS |
| Infrastructure | BIL ≈ $127B total (roads+ports) | Lower lead-time risk |
| Labor | Fed $7.25; WIOA $3.3B | Wage & staffing pressure |
What is included in the product
 Detailed Word Document
Explores how macro-environmental factors uniquely affect Belk across six dimensions—Political, Economic, Social, Technological, Environmental, and Legal—each backed by relevant data and current trends to identify threats and opportunities. Designed for executives, consultants, and investors, the analysis offers forward-looking insights and clean formatting ready for inclusion in business plans, decks, or reports.

 Customizable Excel Spreadsheet
A concise, visually segmented Belk PESTLE Analysis that can be dropped into presentations, shared across teams, and annotated with region- or business-line specific notes to streamline external risk discussions and strategic planning.
Economic factors

Consumer spending cyclicality
Apparel and home are highly discretionary categories, so swings in spending hit Belk quickly; with headline US inflation moderating to about 3.4% in 2024 consumer basket size and mix shifted toward value and essentials, driving higher promotional intensity when wallets tighten. Belk needs dynamic pricing and inventory agility to protect margins and turnover amid volatile demand.
Inflation and input costs
Rising freight, cotton (≈$1.00/lb in 2024) and energy costs swing Belk’s merchandise margins as U.S. CPI eased to about 3% in 2024 but input volatility persists; container freight rates remain ~60% below 2021 peaks yet still add variability. Sticky wage inflation (avg hourly earnings up ~4% in 2024) pressures store P&Ls. Price elasticity differs by brand and category, so data-led, targeted markdowns have preserved 50–150 bps of gross margin in retail pilots.

Regional growth differentials
Belk's Southern focus benefits from a South population of roughly 126 million (about 38% of the U.S.) per Census 2023, supporting store traffic and selective expansion. Wide income dispersion—U.S. median household income ~$74,580 in 2023—drives simultaneous demand for value and premium assortments. Tourism-driven seasonal peaks in Gulf and Carolinas uplift quarter revenues, while localized assortments capture micro-market trends.

E-commerce channel economics
Last-mile delivery can account for as much as 28–53% of fulfillment costs, eroding online profitability for retailers like Belk; apparel e-commerce return rates near 30% further inflate reverse-logistics expense. Omnichannel services such as BOPIS typically lift conversion and average order value by ~20%, while shop‑and-ship strategies cut shipping distances and costs. The shift to digital raises working-capital needs as inventory mix and quicker replenishment cycles demand tighter cash management.
- last-mile: 28–53% of fulfillment cost
- apparel returns: ~30% rate
- BOPIS: ~20% higher AOV
- reverse logistics & packaging require tight control
Credit availability and rates
Higher benchmark borrowing costs (Fed funds ~5.25–5.50% in 2024) reduce big-ticket home purchases and damp discretionary apparel spend, pressuring Belk’s AOV; private-label credit—industry penetration around 20%—shapes loyalty and repeat spend while exposing receivables to macro stress. Financing costs (10-year Treasury ~4% in 2024) raise inventory carry and capex expenses; monitoring rising card delinquency trends guides tighter risk policies.
- Fed funds 5.25–5.50% (2024)
- 10y Treasury ~4% (2024)
- Private-label penetration ~20%
- Watch rising card delinquencies for policy
Tariffs up to 25% raise COGS; tax-free weekends spike apparel sales
Discretionary apparel/home spending remains sensitive as US headline inflation eased to ~3.4% in 2024, forcing higher promotions and inventory agility. Input cost swings (cotton ≈ $1.00/lb, freight variability) and Fed funds at 5.25–5.50% squeeze margins and AOV. E‑commerce returns (~30%) and last‑mile costs lift fulfillment spend, while Southern footprint (≈126M) supports selective expansion.
| Metric | 2024/2025 |
|---|---|
| Headline inflation | ~3.4% (2024) |
| Fed funds | 5.25–5.50% (2024) |
| 10y Treasury | ~4% (2024) |
| Cotton | ≈ $1.00/lb (2024) |
| Apparel returns | ~30% |
| BOPIS AOV lift | ~+20% |
| South population | ~126M (2023) |
Preview Before You Purchase
Belk PESTLE Analysis
The preview shown here is the exact Belk PESTLE Analysis you’ll receive after purchase—fully formatted and ready to use. This is the final version with complete content and professional structure, no placeholders or teasers. After checkout you’ll instantly download the same file displayed here, ensuring no surprises and immediate usability.

Product Information
Product Information
Shipping & Returns
Shipping & Returns
Description
Your Competitive Advantage Starts with This Report
Discover how political shifts, consumer trends, and technological disruption are shaping Belk’s outlook in our concise PESTLE snapshot—ideal for investors and strategists. Purchase the full, editable PESTLE analysis to access deep-dive insights, risk forecasts, and practical recommendations ready for immediate use.
Political factors
State tax policy shifts
State shifts in Southern sales-tax holidays and exemptions directly affect Belk’s pricing strategy and foot traffic, as temporary tax-free weekends can spike apparel sales and cannibalize regular-season demand. Incentive packages from states such as North Carolina and South Carolina influence store expansion timing and capex allocation. Fiscal pressures raising consumption or business taxes compress margins and force tighter promotions. Belk, based in Charlotte, must rapidly align promotions and inventory to these changing regimes.
Trade and tariff exposure
Tariffs on apparel, footwear and home goods from Asia — including additional Section 301 duties of up to 25% since 2018 — raise landed costs for Belk and squeeze gross margins. Frequent policy shifts complicate multi-year sourcing and pricing decisions, increasing working capital and lead-time risk. Diversifying countries of origin reduces exposure to country-specific tariffs. Clear pass-through pricing and cost-plus strategies help preserve margins.
Infrastructure and logistics funding
State and federal infrastructure funding directly affects Belk lead times: the 2021 Bipartisan Infrastructure Law allocated about 110 billion USD for roads and bridges and roughly 17 billion USD for ports and waterways, improving transit reliability. Southeast port upgrades at Savannah and Charleston have raised inbound capacity, reducing variability in arrivals. Budget cuts or grant delays, however, raise freight congestion and costs, disrupting Belk store replenishment that depends on predictable transit.
Labor and workforce policies
Policy debates over minimum wage and scheduling rules shape Belk's labor costs; the federal minimum wage remains $7.25/hr (since 2009) while many states set higher rates. Expanded childcare supports, notably the 2021 temporary expansion of the Child and Dependent Care Tax Credit under ARPA, have increased labor supply in past years. WIOA funding was about $3.3 billion in FY2024, supporting recruitment and requiring agile staffing models for compliance.
- Minimum wage: $7.25 federal (since 2009)
- Childcare policy: ARPA 2021 CDC Tax Credit expanded support
- Workforce training: WIOA ≈ $3.3B FY2024
- Operational need: agile staffing for compliance
Disaster preparedness governance
Regional emergency management policies shape Belk's storm response; evacuation and curfew orders have forced temporary closures across Belk's roughly 300-store footprint, disrupting sales and supply chains. Access to federal and state resilience grants reduces capital needed for mitigation projects. Proactive coordination with local authorities shortens downtime and aids inventory protection.
- Regional policy impact: enforced closures
- Financial relief: resilience grants offset mitigation costs
- Operational benefit: coordination reduces downtime
Tariffs up to 25% raise COGS; tax-free weekends spike apparel sales
State sales-tax holidays and exemptions shift Belk pricing and foot traffic; temporary tax-free weekends can spike apparel sales. Tariffs, including Section 301 duties up to 25%, raise landed costs and compress margins. Infrastructure funding (BIL: ~110B roads/bridges, ~17B ports) and SE port upgrades reduce transit variability. Labor rules (federal min wage $7.25; WIOA ≈ $3.3B FY2024) alter staffing costs.
| Factor | Metric | Impact |
|---|---|---|
| Tariffs | Up to 25% Section 301 | Higher COGS |
| Infrastructure | BIL ≈ $127B total (roads+ports) | Lower lead-time risk |
| Labor | Fed $7.25; WIOA $3.3B | Wage & staffing pressure |
What is included in the product
Detailed Word Document
Explores how macro-environmental factors uniquely affect Belk across six dimensions—Political, Economic, Social, Technological, Environmental, and Legal—each backed by relevant data and current trends to identify threats and opportunities. Designed for executives, consultants, and investors, the analysis offers forward-looking insights and clean formatting ready for inclusion in business plans, decks, or reports.
Customizable Excel Spreadsheet
A concise, visually segmented Belk PESTLE Analysis that can be dropped into presentations, shared across teams, and annotated with region- or business-line specific notes to streamline external risk discussions and strategic planning.
Economic factors
Consumer spending cyclicality
Apparel and home are highly discretionary categories, so swings in spending hit Belk quickly; with headline US inflation moderating to about 3.4% in 2024 consumer basket size and mix shifted toward value and essentials, driving higher promotional intensity when wallets tighten. Belk needs dynamic pricing and inventory agility to protect margins and turnover amid volatile demand.
Inflation and input costs
Rising freight, cotton (≈$1.00/lb in 2024) and energy costs swing Belk’s merchandise margins as U.S. CPI eased to about 3% in 2024 but input volatility persists; container freight rates remain ~60% below 2021 peaks yet still add variability. Sticky wage inflation (avg hourly earnings up ~4% in 2024) pressures store P&Ls. Price elasticity differs by brand and category, so data-led, targeted markdowns have preserved 50–150 bps of gross margin in retail pilots.
Regional growth differentials
Belk's Southern focus benefits from a South population of roughly 126 million (about 38% of the U.S.) per Census 2023, supporting store traffic and selective expansion. Wide income dispersion—U.S. median household income ~$74,580 in 2023—drives simultaneous demand for value and premium assortments. Tourism-driven seasonal peaks in Gulf and Carolinas uplift quarter revenues, while localized assortments capture micro-market trends.
E-commerce channel economics
Last-mile delivery can account for as much as 28–53% of fulfillment costs, eroding online profitability for retailers like Belk; apparel e-commerce return rates near 30% further inflate reverse-logistics expense. Omnichannel services such as BOPIS typically lift conversion and average order value by ~20%, while shop‑and-ship strategies cut shipping distances and costs. The shift to digital raises working-capital needs as inventory mix and quicker replenishment cycles demand tighter cash management.
- last-mile: 28–53% of fulfillment cost
- apparel returns: ~30% rate
- BOPIS: ~20% higher AOV
- reverse logistics & packaging require tight control
Credit availability and rates
Higher benchmark borrowing costs (Fed funds ~5.25–5.50% in 2024) reduce big-ticket home purchases and damp discretionary apparel spend, pressuring Belk’s AOV; private-label credit—industry penetration around 20%—shapes loyalty and repeat spend while exposing receivables to macro stress. Financing costs (10-year Treasury ~4% in 2024) raise inventory carry and capex expenses; monitoring rising card delinquency trends guides tighter risk policies.
- Fed funds 5.25–5.50% (2024)
- 10y Treasury ~4% (2024)
- Private-label penetration ~20%
- Watch rising card delinquencies for policy
Tariffs up to 25% raise COGS; tax-free weekends spike apparel sales
Discretionary apparel/home spending remains sensitive as US headline inflation eased to ~3.4% in 2024, forcing higher promotions and inventory agility. Input cost swings (cotton ≈ $1.00/lb, freight variability) and Fed funds at 5.25–5.50% squeeze margins and AOV. E‑commerce returns (~30%) and last‑mile costs lift fulfillment spend, while Southern footprint (≈126M) supports selective expansion.
| Metric | 2024/2025 |
|---|---|
| Headline inflation | ~3.4% (2024) |
| Fed funds | 5.25–5.50% (2024) |
| 10y Treasury | ~4% (2024) |
| Cotton | ≈ $1.00/lb (2024) |
| Apparel returns | ~30% |
| BOPIS AOV lift | ~+20% |
| South population | ~126M (2023) |
Preview Before You Purchase
Belk PESTLE Analysis
The preview shown here is the exact Belk PESTLE Analysis you’ll receive after purchase—fully formatted and ready to use. This is the final version with complete content and professional structure, no placeholders or teasers. After checkout you’ll instantly download the same file displayed here, ensuring no surprises and immediate usability.











