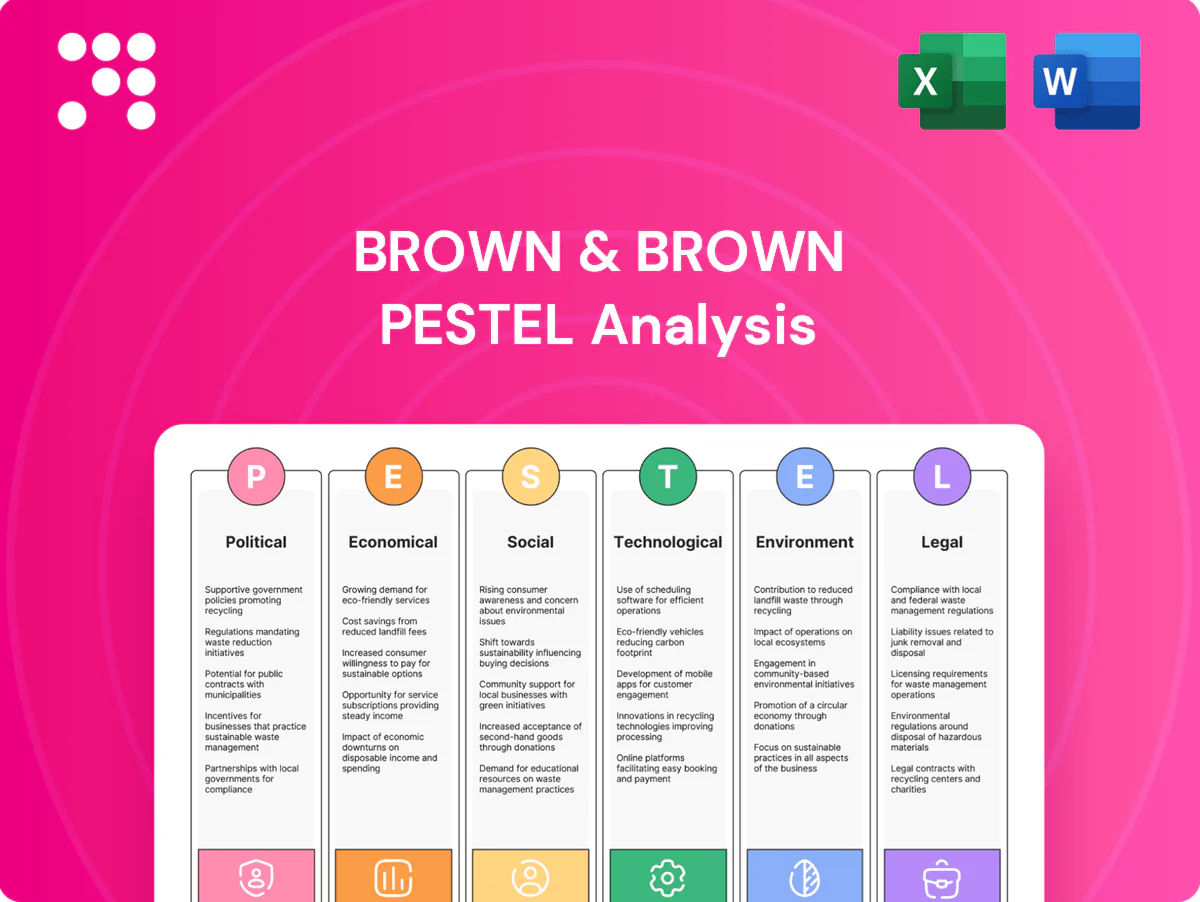
Brown & Brown PESTLE Analysis

Your Competitive Advantage Starts with This Report
Unlock strategic clarity with our PESTLE Analysis of Brown & Brown—three to five carefully mapped external forces showing how regulation, market cycles, and tech shifts will shape outcomes. Ideal for investors and strategists, this concise briefing highlights risks and opportunities. Purchase the full report to access detailed, actionable intelligence and ready-to-use charts.
Political factors

State-based insurance regulation
US insurance is regulated primarily at the state level across 50 states plus D.C., imposing divergent licensing, filing and market-conduct rules that Brown & Brown must manage in each jurisdiction. Operating nationwide compels Brown & Brown to maintain robust regulatory affairs and compliance teams, raising operating costs and creating barriers to entry. Harmonization efforts via the NAIC (56 members) ease some divergence but remain partial.
Healthcare and employee-benefit policy shifts
Federal and state shifts in healthcare, pharmacy benefits, and managed-care rules are reshaping the economics of benefits brokerage and TPAs, with employer-sponsored insurance covering roughly 150 million Americans and shifting premium and drug-cost dynamics. Policy changes alter plan design, reimbursement and reporting, pressuring Brown & Brown’s National Programs and Services to adapt rapidly; Brown & Brown reported about $4.1B revenue in FY2024. Political cycles amplify demand and pricing volatility.

Catastrophe backstops and public programs
Reforms to the National Flood Insurance Program, which still covers roughly 5 million policies, plus the Terrorism Risk Insurance Act reauthorized through 2027, and large state catastrophe pools (collectively providing tens of billions in contingent capacity) shape market capacity and pricing for Brown & Brown. Availability of public reinsurance support widens placement options and can lower client premiums. Policy uncertainty around program reforms can widen coverage gaps Brown & Brown must navigate, so active engagement with federal and state stakeholders reduces market disruption.

Government procurement and municipal demand
Public sector budgets and infrastructure initiatives—with US state and local capital outlays rising to about $450 billion in 2024—drive municipal demand for brokerage across schools, authorities and cities, shifting appropriations that change coverage scope, retentions and risk services; procurement rules can lengthen sales cycles but stabilize multi-year revenue, and Brown & Brown’s Retail and Programs segments leverage disciplined bid compliance to win contracts.
- 2024 municipal capex ~450B
- Longer procurement = stable renewals
- Retail/Programs benefit from bid compliance
Geopolitical risk and sanctions regimes
Evolving sanctions, export controls and geopolitical tensions are reshaping exposure in specialty lines, marine and credit risks, forcing brokers to screen clients and placements to avoid prohibited transactions; Brown & Brown reported approximately $4.7 billion revenue in FY2024, amplifying the impact on its wholesale and international placements which require heightened diligence.
State insurance rules and federal benefits reforms raise compliance costs, reshape market capacity
State-driven insurance regulation (NAIC 56 members) forces Brown & Brown to sustain costly compliance across 50 states + DC, raising operating complexity. Federal healthcare, PBM and TPAs reforms shift benefits economics; Brown & Brown FY2024 revenue ~4.1B and wholesale/international FY2024 ~4.7B. Public programs (NFIP ~5M policies, TRIA to 2027) and municipal capex ~$450B alter capacity, pricing and procurement timelines.
| Metric | Value |
|---|---|
| NAIC members | 56 |
| FY2024 Retail/Benefits rev | $4.1B |
| FY2024 Wholesale/Intl rev | $4.7B |
| Municipal capex 2024 | $450B |
| NFIP policies | ~5M |
What is included in the product
 Detailed Word Document
Explores how external macro-environmental factors uniquely affect Brown & Brown across Political, Economic, Social, Technological, Environmental and Legal dimensions, with each section backed by current data and trend analysis; designed for executives, consultants and investors to identify threats, opportunities and support scenario planning with ready-to-use, investor-grade formatting.

 Customizable Excel Spreadsheet
A concise, visually segmented Brown & Brown PESTLE summary that streamlines external risk assessment for meetings, is easily editable with context-specific notes, and can be dropped into presentations or shared across teams to speed alignment and strategic planning.
Economic factors

Insurance pricing cycle (hard/soft)
Brokerage revenue at Brown & Brown is highly leveraged to premium-rate movements and exposure growth; hard markets historically lift commissions and fees (premium rate jumps often range 10–20%) but can strain client budgets and buying capacity.
When pricing softens, top-line growth pressures follow as rate mixes compress, though softer markets typically improve retention and cross-sell opportunities.
Brown & Brown’s national scale, diversified product mix and broad carrier access help balance cycle volatility by offsetting rate-driven revenue swings with volume and fee income sources.
Interest rates and capital availability
Higher policy yields from elevated rates (US fed funds ~5.25–5.50% and 10-year Treasury ~4.0–4.5% in 2024–25) boost insurer investment income and underwriting capacity but increase clients’ financing costs. Reinsurance capital has shifted to higher-yield alternatives, driving property-cat pricing volatility and rate spikes seen in 2023–24. Brown & Brown’s placement strategy must flex with capital cycles; higher cash yields can lift corporate returns while pushing up discount rates used in valuations.

Inflation and exposure growth
Claims-severity inflation, wage growth and higher asset-replacement costs are driving premium increases—US CPI was 3.4% in 2024 and average hourly earnings rose about 4.1% (BLS 2024), feeding higher loss costs. Exposure metrics such as payrolls, sales and property values directly scale brokerage revenue and client premiums. Persistent inflation strains insureds’ budgets and limits, so indexing and analytics are used to right-size coverage and index limits.

SMB formation and employment trends
Rising SMB formation—US business applications jumped to a pandemic-era peak (~5.4M in 2021) and stayed elevated through 2023—plus small firms supplying roughly 47% of private-sector employment bolster commercial-lines demand for Brown & Brown; recessions or layoffs compress payroll exposures and benefits enrollment, while Brown & Brown’s diversified client mix cushions sector-specific shocks and cross-sell across Retail, Programs, and Services stabilizes revenue.
- SMB formation spike ~5M+ apps/year (2021–23)
- Small firms ≈47% private employment
- Diversified book reduces sector volatility
- Cross-sell across Retail/Programs/Services stabilizes revenue
Catastrophe losses and reinsurance pricing
Frequent catastrophe events have driven higher reinsurance costs, larger deductibles, and tighter exclusions in property lines, pressuring insured limits and shifting more risk to policyholders.
Affordability pressures raise demand for advisory services—improving Brown & Brown’s fee opportunities—while its broad market access helps secure capacity amid constraints.
Fee-based risk engineering and loss-control services provide a hedge against premium inflation by reducing client loss exposure and supporting placement flexibility.
- Reinsurance cost pressure
- Higher deductibles/exclusions
- Advisory fee upside
- Capacity advantage for Brown & Brown
- Risk engineering offsets
State insurance rules and federal benefits reforms raise compliance costs, reshape market capacity
Brokerage revenue at Brown & Brown is highly levered to premium-rate moves; hard markets can lift commissions ~10–20% but strain client budgets. Elevated rates (fed funds 5.25–5.50%, 10y 4.0–4.5% in 2024–25) boost insurer yields yet raise financing costs; CPI 3.4% and AHE +4.1% (2024) drive loss inflation. SMB formation (~5M apps/yr 2021–23) and small firms (~47% private employment) sustain demand; reinsurance cost pressure and cat volatility raise deductibles while advisory and risk-engineering offset.
| Metric | Value |
|---|---|
| Fed funds (2024–25) | 5.25–5.50% |
| 10y Treasury | 4.0–4.5% |
| CPI (2024) | 3.4% |
| AHE (2024) | +4.1% |
| SMB apps (2021–23) | ~5M/yr |
| Small firms share | ~47% private employment |
Preview the Actual Deliverable
Brown & Brown PESTLE Analysis
The Brown & Brown PESTLE Analysis preview shown here is the exact document you’ll receive after purchase—fully formatted and ready to use. It contains the complete political, economic, social, technological, legal, and environmental assessment tailored to Brown & Brown. No placeholders or teasers—this is the final, downloadable file.

Original: $10.00
-65%$10.00
$3.50Product Information
Product Information
Shipping & Returns
Shipping & Returns
Description
Your Competitive Advantage Starts with This Report
Unlock strategic clarity with our PESTLE Analysis of Brown & Brown—three to five carefully mapped external forces showing how regulation, market cycles, and tech shifts will shape outcomes. Ideal for investors and strategists, this concise briefing highlights risks and opportunities. Purchase the full report to access detailed, actionable intelligence and ready-to-use charts.
Political factors
State-based insurance regulation
US insurance is regulated primarily at the state level across 50 states plus D.C., imposing divergent licensing, filing and market-conduct rules that Brown & Brown must manage in each jurisdiction. Operating nationwide compels Brown & Brown to maintain robust regulatory affairs and compliance teams, raising operating costs and creating barriers to entry. Harmonization efforts via the NAIC (56 members) ease some divergence but remain partial.
Healthcare and employee-benefit policy shifts
Federal and state shifts in healthcare, pharmacy benefits, and managed-care rules are reshaping the economics of benefits brokerage and TPAs, with employer-sponsored insurance covering roughly 150 million Americans and shifting premium and drug-cost dynamics. Policy changes alter plan design, reimbursement and reporting, pressuring Brown & Brown’s National Programs and Services to adapt rapidly; Brown & Brown reported about $4.1B revenue in FY2024. Political cycles amplify demand and pricing volatility.
Catastrophe backstops and public programs
Reforms to the National Flood Insurance Program, which still covers roughly 5 million policies, plus the Terrorism Risk Insurance Act reauthorized through 2027, and large state catastrophe pools (collectively providing tens of billions in contingent capacity) shape market capacity and pricing for Brown & Brown. Availability of public reinsurance support widens placement options and can lower client premiums. Policy uncertainty around program reforms can widen coverage gaps Brown & Brown must navigate, so active engagement with federal and state stakeholders reduces market disruption.
Government procurement and municipal demand
Public sector budgets and infrastructure initiatives—with US state and local capital outlays rising to about $450 billion in 2024—drive municipal demand for brokerage across schools, authorities and cities, shifting appropriations that change coverage scope, retentions and risk services; procurement rules can lengthen sales cycles but stabilize multi-year revenue, and Brown & Brown’s Retail and Programs segments leverage disciplined bid compliance to win contracts.
- 2024 municipal capex ~450B
- Longer procurement = stable renewals
- Retail/Programs benefit from bid compliance
Geopolitical risk and sanctions regimes
Evolving sanctions, export controls and geopolitical tensions are reshaping exposure in specialty lines, marine and credit risks, forcing brokers to screen clients and placements to avoid prohibited transactions; Brown & Brown reported approximately $4.7 billion revenue in FY2024, amplifying the impact on its wholesale and international placements which require heightened diligence.
State insurance rules and federal benefits reforms raise compliance costs, reshape market capacity
State-driven insurance regulation (NAIC 56 members) forces Brown & Brown to sustain costly compliance across 50 states + DC, raising operating complexity. Federal healthcare, PBM and TPAs reforms shift benefits economics; Brown & Brown FY2024 revenue ~4.1B and wholesale/international FY2024 ~4.7B. Public programs (NFIP ~5M policies, TRIA to 2027) and municipal capex ~$450B alter capacity, pricing and procurement timelines.
| Metric | Value |
|---|---|
| NAIC members | 56 |
| FY2024 Retail/Benefits rev | $4.1B |
| FY2024 Wholesale/Intl rev | $4.7B |
| Municipal capex 2024 | $450B |
| NFIP policies | ~5M |
What is included in the product
Detailed Word Document
Explores how external macro-environmental factors uniquely affect Brown & Brown across Political, Economic, Social, Technological, Environmental and Legal dimensions, with each section backed by current data and trend analysis; designed for executives, consultants and investors to identify threats, opportunities and support scenario planning with ready-to-use, investor-grade formatting.
Customizable Excel Spreadsheet
A concise, visually segmented Brown & Brown PESTLE summary that streamlines external risk assessment for meetings, is easily editable with context-specific notes, and can be dropped into presentations or shared across teams to speed alignment and strategic planning.
Economic factors
Insurance pricing cycle (hard/soft)
Brokerage revenue at Brown & Brown is highly leveraged to premium-rate movements and exposure growth; hard markets historically lift commissions and fees (premium rate jumps often range 10–20%) but can strain client budgets and buying capacity.
When pricing softens, top-line growth pressures follow as rate mixes compress, though softer markets typically improve retention and cross-sell opportunities.
Brown & Brown’s national scale, diversified product mix and broad carrier access help balance cycle volatility by offsetting rate-driven revenue swings with volume and fee income sources.
Interest rates and capital availability
Higher policy yields from elevated rates (US fed funds ~5.25–5.50% and 10-year Treasury ~4.0–4.5% in 2024–25) boost insurer investment income and underwriting capacity but increase clients’ financing costs. Reinsurance capital has shifted to higher-yield alternatives, driving property-cat pricing volatility and rate spikes seen in 2023–24. Brown & Brown’s placement strategy must flex with capital cycles; higher cash yields can lift corporate returns while pushing up discount rates used in valuations.
Inflation and exposure growth
Claims-severity inflation, wage growth and higher asset-replacement costs are driving premium increases—US CPI was 3.4% in 2024 and average hourly earnings rose about 4.1% (BLS 2024), feeding higher loss costs. Exposure metrics such as payrolls, sales and property values directly scale brokerage revenue and client premiums. Persistent inflation strains insureds’ budgets and limits, so indexing and analytics are used to right-size coverage and index limits.
SMB formation and employment trends
Rising SMB formation—US business applications jumped to a pandemic-era peak (~5.4M in 2021) and stayed elevated through 2023—plus small firms supplying roughly 47% of private-sector employment bolster commercial-lines demand for Brown & Brown; recessions or layoffs compress payroll exposures and benefits enrollment, while Brown & Brown’s diversified client mix cushions sector-specific shocks and cross-sell across Retail, Programs, and Services stabilizes revenue.
- SMB formation spike ~5M+ apps/year (2021–23)
- Small firms ≈47% private employment
- Diversified book reduces sector volatility
- Cross-sell across Retail/Programs/Services stabilizes revenue
Catastrophe losses and reinsurance pricing
Frequent catastrophe events have driven higher reinsurance costs, larger deductibles, and tighter exclusions in property lines, pressuring insured limits and shifting more risk to policyholders.
Affordability pressures raise demand for advisory services—improving Brown & Brown’s fee opportunities—while its broad market access helps secure capacity amid constraints.
Fee-based risk engineering and loss-control services provide a hedge against premium inflation by reducing client loss exposure and supporting placement flexibility.
- Reinsurance cost pressure
- Higher deductibles/exclusions
- Advisory fee upside
- Capacity advantage for Brown & Brown
- Risk engineering offsets
State insurance rules and federal benefits reforms raise compliance costs, reshape market capacity
Brokerage revenue at Brown & Brown is highly levered to premium-rate moves; hard markets can lift commissions ~10–20% but strain client budgets. Elevated rates (fed funds 5.25–5.50%, 10y 4.0–4.5% in 2024–25) boost insurer yields yet raise financing costs; CPI 3.4% and AHE +4.1% (2024) drive loss inflation. SMB formation (~5M apps/yr 2021–23) and small firms (~47% private employment) sustain demand; reinsurance cost pressure and cat volatility raise deductibles while advisory and risk-engineering offset.
| Metric | Value |
|---|---|
| Fed funds (2024–25) | 5.25–5.50% |
| 10y Treasury | 4.0–4.5% |
| CPI (2024) | 3.4% |
| AHE (2024) | +4.1% |
| SMB apps (2021–23) | ~5M/yr |
| Small firms share | ~47% private employment |
Preview the Actual Deliverable
Brown & Brown PESTLE Analysis
The Brown & Brown PESTLE Analysis preview shown here is the exact document you’ll receive after purchase—fully formatted and ready to use. It contains the complete political, economic, social, technological, legal, and environmental assessment tailored to Brown & Brown. No placeholders or teasers—this is the final, downloadable file.











