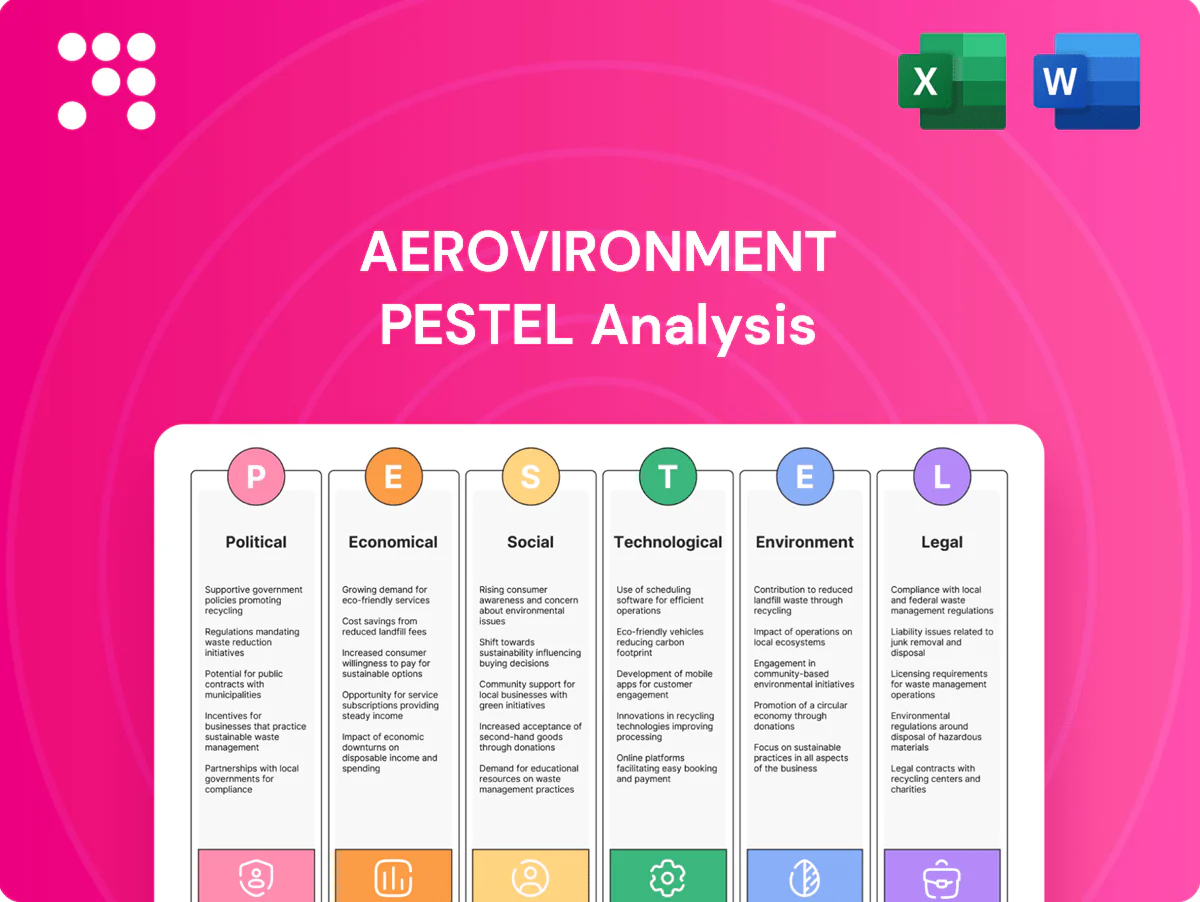
AeroVironment PESTLE Analysis

Make Smarter Strategic Decisions with a Complete PESTEL View
Discover how political, economic, social, technological, legal, and environmental forces are reshaping AeroVironment’s growth prospects and risk profile in our concise PESTLE summary. Use these insights to spot opportunities and anticipate threats for investment or strategy. Purchase the full, fully editable analysis to access the complete deep-dive and actionable recommendations.
Political factors

Defense budget priorities
AeroVironment’s revenues are tightly linked to U.S. DoD appropriations and allied defense budgets, with the U.S. defense topline at about $858 billion for FY2025, meaning funding shifts directly affect program awards. Continuing resolutions or re-prioritizations can delay contract awards and deliveries, compressing quarterly revenue recognition. Elevated geopolitical tensions, notably since 2022, have driven higher UAS and loitering munition procurements, while post-conflict drawdowns historically pressure volumes and pricing.
Geopolitical conflicts
Ongoing conflicts have raised demand for tactical UAS and loitering munitions, with U.S. security assistance to Ukraine topping roughly 75 billion USD by mid-2024 and the FY2024 U.S. defense budget near 858 billion USD, boosting Foreign Military Sales and commercial orders; rapid fielding programs prioritize proven, deployable systems, while escalation or policy shifts can abruptly pause or reallocate orders.

Allied procurement alignment
NATO defence spending hit about $1.29 trillion in 2023 and over 20 members now meet the 2% GDP guideline, while Indo-Pacific partners are raising budgets, driving standardized requirements; interoperability and coalition doctrines increasingly dictate product specs and roadmaps. Government-to-government channels can ease entry but typically lengthen procurement cycles by 6–24 months, and local offset/co-production demands (commonly 10–30%) can compress margins and shift control.

Industrial policy & subsidies
Federal innovation programs (SBIR/STTR combined federal awards approx 3.1 billion annually) and rapid prototyping funds de-risk R&D timelines and lower commercialization costs for novel UAS technologies.
Stricter Buy American provisions raise domestic-content bid advantages, while similar onshoring moves by allies can reduce export competitiveness and complicate pricing abroad.
- Defense budget: US FY2024 ~858B
- SBIR/STTR federal awards: ~3.1B/year
- Buy American: favors domestic content in bids
- Allied onshoring: potential export headwinds
Trade relations & sanctions
- Impact: export controls 2022–23
- Risk: longer lead times, higher input costs
- Shift: friend-shoring re-sources suppliers
- Compliance: stricter ITAR/EAR for dual-use items
US defense budgets, Ukraine aid, and export rules reshape defense supply chains
AeroVironment depends on U.S. defense appropriations (~$858B FY2025) and allied spending (NATO ~$1.29T 2023); funding shifts and CRs can delay awards. Elevated conflicts drove U.S. security assistance to Ukraine ~75B by mid‑2024, boosting demand; export controls (2022–23) and Buy American increase compliance and sourcing costs.
| Metric | Value |
|---|---|
| US defense topline | $858B |
| NATO spend 2023 | $1.29T |
| US aid to Ukraine (mid‑2024) | $75B |
What is included in the product
 Detailed Word Document
Explores how external macro-environmental factors uniquely affect AeroVironment across Political, Economic, Social, Technological, Environmental and Legal dimensions, with data-backed, forward-looking insights tailored for executives, investors and strategists to identify opportunities, risks and actionable responses.

 Customizable Excel Spreadsheet
A concise, visually segmented PESTLE summary for AeroVironment that removes briefing friction—easy to drop into presentations or share across teams for rapid alignment on regulatory, technological and market risks.
Economic factors

Defense cycle resilience
Defense demand is less correlated with consumer cycles, supporting revenue stability as U.S. defense spending topped 800 billion USD in 2024. Topline growth for AeroVironment hinges on multi-year program funding, which typically spans 3–5 years. Backlog visibility often provides 12–24 months of revenue cover, reducing volatility. The cost-plus versus fixed-price contract mix materially affects margin sensitivity, with cost-plus offering greater margin protection.
Inflation & input costs
Inflation pressures (U.S. CPI 2024 3.4%) and volatile input costs for electronic components, composites and lithium-based batteries (battery pack avg $132/kWh in 2023 per BNEF) compress margins for AeroVironment unless offset by pricing power or contract escalators. Supplier concentration in key semiconductors and composites can amplify cost swings observed during 2021–22 component lead time spikes. Longer lead times raise working capital and inventory financing needs.

FX and international sales
Growing allied sales expose AeroVironment to FX and payment risk as exports rose with international backlog; the US dollar index (DXY) hovered around 105–106 in 2024–mid‑2025, pressuring price competitiveness abroad. Hedging policies and USD‑denominated contracts have mitigated some volatility for defense sales. Expanding local service and sustainment footprints shifts costs from FX‑sensitive imports to domestic labor and parts.

Supply chain reliability
Semiconductors, RF modules and specialty materials remain persistent bottlenecks for AeroVironment’s drone and missile‑system supply chain, constraining production ramp rates. Pursuing second‑source qualification and selective vertical integration reduces single‑supplier exposure and shortens lead times. Proactive inventory builds to guarantee deliveries will strain working capital and cash flow. Supplier cyber resilience and financial health now require formal due diligence.
- Supply pinch: semiconductors, RF modules, specialty materials
- Mitigation: second‑source qualification, vertical integration
- Trade‑off: inventory builds vs working capital pressure
- New diligence: supplier cyber and financial risk
Scale & operating leverage
Rising production on common UAV and launcher platforms boosts gross margin via learning curves and higher utilization, while services, spares and training shift revenue toward higher‑margin recurring streams. Program delays can leave capacity idle and compress margins. M&A can realize synergies but increases integration and execution risk.
- Scale: learning curves, higher utilization
- Recurring: services, spares, training
- Risk: program delays → underutilization
- M&A: synergies vs execution risk
US defense budgets, Ukraine aid, and export rules reshape defense supply chains
Defense demand remains stable with U.S. defense spending >800 billion USD in 2024 and AeroVironment backed by 12–24 months of backlog; program funding typically spans 3–5 years. Inflation (U.S. CPI 2024 3.4%) and component/battery costs (battery pack $132/kWh in 2023) squeeze margins unless contracts include escalators. FX (DXY ~105–106 in 2024–mid‑2025) and semiconductor bottlenecks force hedging, second sourcing and inventory builds.
| Metric | Value | Impact |
|---|---|---|
| US defense spend 2024 | >800B USD | Revenue stability |
| Backlog | 12–24 months | Revenue visibility |
| CPI 2024 | 3.4% | Cost pressure |
| DXY 2024–mid‑25 | 105–106 | Export competitiveness |
What You See Is What You Get
AeroVironment PESTLE Analysis
The preview of the AeroVironment PESTLE Analysis is the exact document you’ll receive after purchase—fully formatted, professionally structured, and ready to use. This file contains the complete political, economic, social, technological, legal, and environmental assessment shown here. No placeholders or surprises; you’ll download the same finalized report immediately after checkout.

Original: $10.00
-65%$10.00
$3.50Product Information
Product Information
Shipping & Returns
Shipping & Returns
Description
Make Smarter Strategic Decisions with a Complete PESTEL View
Discover how political, economic, social, technological, legal, and environmental forces are reshaping AeroVironment’s growth prospects and risk profile in our concise PESTLE summary. Use these insights to spot opportunities and anticipate threats for investment or strategy. Purchase the full, fully editable analysis to access the complete deep-dive and actionable recommendations.
Political factors
Defense budget priorities
AeroVironment’s revenues are tightly linked to U.S. DoD appropriations and allied defense budgets, with the U.S. defense topline at about $858 billion for FY2025, meaning funding shifts directly affect program awards. Continuing resolutions or re-prioritizations can delay contract awards and deliveries, compressing quarterly revenue recognition. Elevated geopolitical tensions, notably since 2022, have driven higher UAS and loitering munition procurements, while post-conflict drawdowns historically pressure volumes and pricing.
Geopolitical conflicts
Ongoing conflicts have raised demand for tactical UAS and loitering munitions, with U.S. security assistance to Ukraine topping roughly 75 billion USD by mid-2024 and the FY2024 U.S. defense budget near 858 billion USD, boosting Foreign Military Sales and commercial orders; rapid fielding programs prioritize proven, deployable systems, while escalation or policy shifts can abruptly pause or reallocate orders.
Allied procurement alignment
NATO defence spending hit about $1.29 trillion in 2023 and over 20 members now meet the 2% GDP guideline, while Indo-Pacific partners are raising budgets, driving standardized requirements; interoperability and coalition doctrines increasingly dictate product specs and roadmaps. Government-to-government channels can ease entry but typically lengthen procurement cycles by 6–24 months, and local offset/co-production demands (commonly 10–30%) can compress margins and shift control.
Industrial policy & subsidies
Federal innovation programs (SBIR/STTR combined federal awards approx 3.1 billion annually) and rapid prototyping funds de-risk R&D timelines and lower commercialization costs for novel UAS technologies.
Stricter Buy American provisions raise domestic-content bid advantages, while similar onshoring moves by allies can reduce export competitiveness and complicate pricing abroad.
- Defense budget: US FY2024 ~858B
- SBIR/STTR federal awards: ~3.1B/year
- Buy American: favors domestic content in bids
- Allied onshoring: potential export headwinds
Trade relations & sanctions
- Impact: export controls 2022–23
- Risk: longer lead times, higher input costs
- Shift: friend-shoring re-sources suppliers
- Compliance: stricter ITAR/EAR for dual-use items
US defense budgets, Ukraine aid, and export rules reshape defense supply chains
AeroVironment depends on U.S. defense appropriations (~$858B FY2025) and allied spending (NATO ~$1.29T 2023); funding shifts and CRs can delay awards. Elevated conflicts drove U.S. security assistance to Ukraine ~75B by mid‑2024, boosting demand; export controls (2022–23) and Buy American increase compliance and sourcing costs.
| Metric | Value |
|---|---|
| US defense topline | $858B |
| NATO spend 2023 | $1.29T |
| US aid to Ukraine (mid‑2024) | $75B |
What is included in the product
Detailed Word Document
Explores how external macro-environmental factors uniquely affect AeroVironment across Political, Economic, Social, Technological, Environmental and Legal dimensions, with data-backed, forward-looking insights tailored for executives, investors and strategists to identify opportunities, risks and actionable responses.
Customizable Excel Spreadsheet
A concise, visually segmented PESTLE summary for AeroVironment that removes briefing friction—easy to drop into presentations or share across teams for rapid alignment on regulatory, technological and market risks.
Economic factors
Defense cycle resilience
Defense demand is less correlated with consumer cycles, supporting revenue stability as U.S. defense spending topped 800 billion USD in 2024. Topline growth for AeroVironment hinges on multi-year program funding, which typically spans 3–5 years. Backlog visibility often provides 12–24 months of revenue cover, reducing volatility. The cost-plus versus fixed-price contract mix materially affects margin sensitivity, with cost-plus offering greater margin protection.
Inflation & input costs
Inflation pressures (U.S. CPI 2024 3.4%) and volatile input costs for electronic components, composites and lithium-based batteries (battery pack avg $132/kWh in 2023 per BNEF) compress margins for AeroVironment unless offset by pricing power or contract escalators. Supplier concentration in key semiconductors and composites can amplify cost swings observed during 2021–22 component lead time spikes. Longer lead times raise working capital and inventory financing needs.
FX and international sales
Growing allied sales expose AeroVironment to FX and payment risk as exports rose with international backlog; the US dollar index (DXY) hovered around 105–106 in 2024–mid‑2025, pressuring price competitiveness abroad. Hedging policies and USD‑denominated contracts have mitigated some volatility for defense sales. Expanding local service and sustainment footprints shifts costs from FX‑sensitive imports to domestic labor and parts.
Supply chain reliability
Semiconductors, RF modules and specialty materials remain persistent bottlenecks for AeroVironment’s drone and missile‑system supply chain, constraining production ramp rates. Pursuing second‑source qualification and selective vertical integration reduces single‑supplier exposure and shortens lead times. Proactive inventory builds to guarantee deliveries will strain working capital and cash flow. Supplier cyber resilience and financial health now require formal due diligence.
- Supply pinch: semiconductors, RF modules, specialty materials
- Mitigation: second‑source qualification, vertical integration
- Trade‑off: inventory builds vs working capital pressure
- New diligence: supplier cyber and financial risk
Scale & operating leverage
Rising production on common UAV and launcher platforms boosts gross margin via learning curves and higher utilization, while services, spares and training shift revenue toward higher‑margin recurring streams. Program delays can leave capacity idle and compress margins. M&A can realize synergies but increases integration and execution risk.
- Scale: learning curves, higher utilization
- Recurring: services, spares, training
- Risk: program delays → underutilization
- M&A: synergies vs execution risk
US defense budgets, Ukraine aid, and export rules reshape defense supply chains
Defense demand remains stable with U.S. defense spending >800 billion USD in 2024 and AeroVironment backed by 12–24 months of backlog; program funding typically spans 3–5 years. Inflation (U.S. CPI 2024 3.4%) and component/battery costs (battery pack $132/kWh in 2023) squeeze margins unless contracts include escalators. FX (DXY ~105–106 in 2024–mid‑2025) and semiconductor bottlenecks force hedging, second sourcing and inventory builds.
| Metric | Value | Impact |
|---|---|---|
| US defense spend 2024 | >800B USD | Revenue stability |
| Backlog | 12–24 months | Revenue visibility |
| CPI 2024 | 3.4% | Cost pressure |
| DXY 2024–mid‑25 | 105–106 | Export competitiveness |
What You See Is What You Get
AeroVironment PESTLE Analysis
The preview of the AeroVironment PESTLE Analysis is the exact document you’ll receive after purchase—fully formatted, professionally structured, and ready to use. This file contains the complete political, economic, social, technological, legal, and environmental assessment shown here. No placeholders or surprises; you’ll download the same finalized report immediately after checkout.











