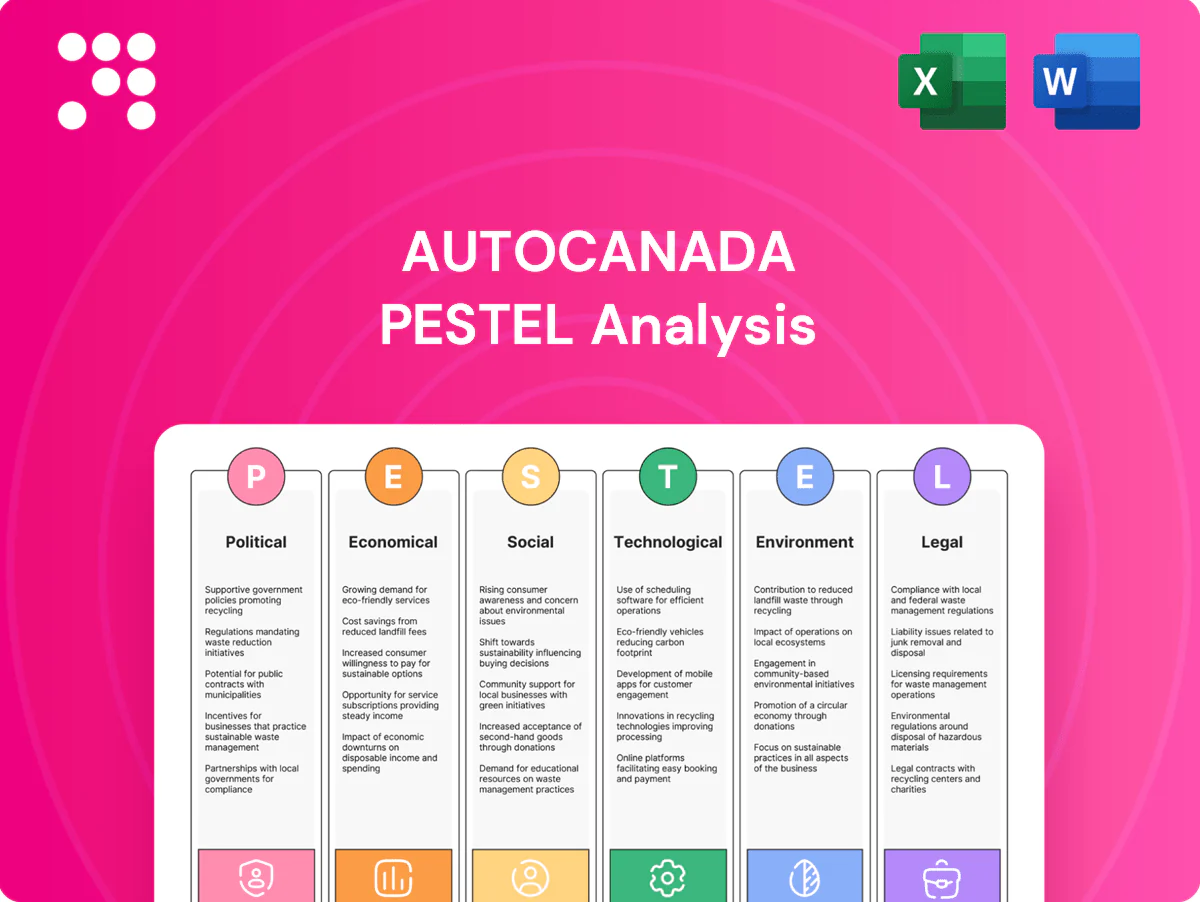
AutoCanada PESTLE Analysis

Your Competitive Advantage Starts with This Report
Unlock how political, economic, social, technological, legal and environmental forces are shaping AutoCanada’s strategic path and risk exposure. This concise PESTLE snapshot highlights key trends and decision points for investors and managers. Buy the full analysis to get detailed, actionable intelligence ready for immediate use.
Political factors

Federal EV incentives
Canada’s iZEV rebate of up to $5,000 and the US federal EV tax credit up to $7,500 materially influence model mix, pricing and showroom traffic across AutoCanada’s 70+ dealerships. Changes to eligibility, price caps or funding can rapidly shift demand between ICE, hybrid and EV inventory, affecting turnover and margins. AutoCanada must align vehicle allocations and targeted marketing to capture incentives-driven buyers. Policy reversals could create significant residual-value risk on EV trade-ins.
Provincial/state policies
Provincial/state rebates, sales taxes and registration fees vary widely across AutoCanada markets—PST/HST ranges from 0% in Alberta to 13% in Ontario and 9.975% in Quebec—directly affecting regional retail pricing and margins. Provincial EV rebates (e.g., BC up to CAD 3,000) and federal 100% ZEV new‑vehicle target by 2035 shift OEM allocations and dealership training needs. Regional insurer rules change collision and repair reimbursement rates and parts approval processes. Network planning must monitor sub‑national policy divergence continuously.

Trade and tariffs
Tariffs and trade rules under CUSMA/USMCA (75% regional content for autos) mean vehicles meeting rules avoid general duties, but targeted measures—eg Section 232 steel tariffs (up to 25%) and 10% aluminum—raise parts landed costs and compress gross margins. Geopolitical tensions and supply-chain shocks since 2022 have disrupted cross-border flows and parts availability, while currency-linked pass-through complicates retail pricing and long-term OEM contracts limit AutoCanada’s ability to quickly offset tariff shocks.

Infrastructure and public transit
Government investment in roads and EV charging shapes car ownership and dealership footfall; Canada committed CAD 1.7 billion to the Zero-Emission Vehicle Infrastructure Program and public chargers exceeded ~12,000 by 2024, supporting EV retail activity. Expanded urban transit can dampen replacement cycles, while suburban infrastructure spending sustains truck/SUV demand—SUVs/trucks were ~77% of Canadian new vehicle sales in 2024. AutoCanada can tailor store formats to local mobility policy trajectories.
- EV infrastructure: CAD 1.7B ZEVIP, ~12,000 public chargers (2024)
- Transit impact: urban transit expansion reduces replacement frequency
- Suburban demand: trucks/SUVs ~77% of new sales (2024)
- Strategic response: adapt store formats by local policy
Procurement and fleet policies
Public-sector fleet electrification (Canada target: 100% ZEV new sales by 2035) and stricter procurement standards create B2B sales and aftersales service pipelines as fleets replace vehicles; the US Inflation Reduction Act domestic-content rules (up to US$7,500 EV tax credit) are already redirecting OEM production and allocations.
Policy-driven fleet turnover raises parts and collision work and forces sales teams to master tender processes, compliance checks and lifecycle cost bids to win contracts.
Incentives and ~12,000 chargers reshape 70+ dealers
Political factors—federal/provincial EV incentives (Canada iZEV up to CAD 5,000; US tax credit up to US$7,500), CAD 1.7B ZEVIP and ~12,000 public chargers (2024), CUSMA content rules and tariff risks, and public-fleet ZEV targets to 2035—shape AutoCanada’s model mix, margins and B2B pipeline across 70+ dealerships; regional tax/fee variance alters retail pricing and inventory turnover.
| Metric | Value |
|---|---|
| Dealerships | 70+ |
| ZEVIP funding | CAD 1.7B |
| Public chargers (2024) | ~12,000 |
| Truck/SUV share (2024) | ~77% |
What is included in the product
 Detailed Word Document
Explores how external macro-environmental factors uniquely affect AutoCanada across Political, Economic, Social, Technological, Environmental and Legal dimensions. Each section is data-backed and forward-looking, designed for executives and investors to identify threats, opportunities and inform strategy and financing decisions.

 Customizable Excel Spreadsheet
Visually segmented by PESTLE categories, the AutoCanada analysis offers a clean, shareable summary that speeds stakeholder alignment and decision-making. It’s editable for regional or business-line notes, making it ideal for presentations, strategy sessions, and consultant reports.
Economic factors

Interest rates and credit
Auto sales are highly sensitive to financing costs and lender appetite; with the Bank of Canada policy rate peaking at 5.00% in 2023, Canadian light‑vehicle sales fell to roughly 1.64 million in 2023, showing affordability effects. Rate cuts revive affordability and can boost new and used volumes, while hikes suppress demand. Subprime tightening shifted mix toward higher‑quality credit and longer terms, making F&I product penetration a key profit stabilizer for AutoCanada.
Consumer confidence
Consumer confidence shifts directly affect showroom traffic, conversion and deferred service; with the Bank of Canada policy rate at about 5% in 2024–25 and unemployment near 5% consumer sentiment tightened, reducing new-vehicle consideration. Wage growth (~4% YoY in 2024) and employment levels shape upgrade timing and accessory spend. In downturns used-vehicle transactions and service bays consistently outperform new sales. Marketing should pivot between value messaging and premium upsell as confidence swings.

Supply chain normalization
Post-pandemic inventory recovery—days’ supply normalizing to roughly 60 days in 2024—has moderated price inflation and reduced gross-per-unit for AutoCanada. Dealers now carry higher floorplan exposure with rates near 7%, driving up holding costs while competitive retail pricing compresses margins. Parts availability stabilized service throughput but tightened service margins. Allocation management and dynamic pricing are critical to defend PVR.

Used vehicle price cycles
Volatile wholesale auction prices—Manheim index down roughly 18% from the Nov 2021 peak—have compressed trade-in valuations and lowered reconditioning ROI, raising aging risk as normalization from prior peaks pressures used margins. AutoCanada's data-driven acquisition and stocking strategies reduce write-downs, while CPO programs, delivering roughly 8–12% premium, help sustain spreads when wholesale softens.
- Wholesale decline ~18% vs peak
- CPO premium 8–12%
- Higher days-to-turn increases aging risk
- Data-driven stocking limits write-downs
FX exposure CAD/USD
CAD/USD swings (USD/CAD ~1.36 in July 2025) lift imported vehicle and parts costs, squeezing margins; U.S. dealership earnings can offset Canadian softness but create translation risk on consolidated results. Pricing must balance competitiveness with FX pass-through; active hedging and inventory timing (forward contracts, FX collars) limit volatility.
- Impact: higher COGS
- Hedge: forwards/collars
- Mitigate: pricing & timing
Incentives and ~12,000 chargers reshape 70+ dealers
Higher borrowing costs (BoC peak 5.00% in 2023) and slower consumer confidence cut Canadian light‑vehicle sales to ~1.64M in 2023; rate cuts lift volumes while hikes suppress them. Inventory normalization (~60 days supply in 2024) reduced price inflation but raised floorplan costs (~7% lending). FX (USD/CAD ~1.36 Jul 2025) increases COGS and pressures margins; hedging and dynamic pricing mitigate risk.
| Metric | Value |
|---|---|
| BoC policy rate (peak) | 5.00% (2023) |
| Canada L‑vehicle sales | ~1.64M (2023) |
| Days' supply | ~60 (2024) |
| USD/CAD | ~1.36 (Jul 2025) |
Same Document Delivered
AutoCanada PESTLE Analysis
The preview shown here is the exact AutoCanada PESTLE Analysis you’ll receive after purchase—fully formatted and ready to use. The content, layout, and structure are identical to the downloadable file with no placeholders. After payment you’ll instantly get this same, professionally finished document.

Original: $10.00
-65%$10.00
$3.50Product Information
Product Information
Shipping & Returns
Shipping & Returns
Description
Your Competitive Advantage Starts with This Report
Unlock how political, economic, social, technological, legal and environmental forces are shaping AutoCanada’s strategic path and risk exposure. This concise PESTLE snapshot highlights key trends and decision points for investors and managers. Buy the full analysis to get detailed, actionable intelligence ready for immediate use.
Political factors
Federal EV incentives
Canada’s iZEV rebate of up to $5,000 and the US federal EV tax credit up to $7,500 materially influence model mix, pricing and showroom traffic across AutoCanada’s 70+ dealerships. Changes to eligibility, price caps or funding can rapidly shift demand between ICE, hybrid and EV inventory, affecting turnover and margins. AutoCanada must align vehicle allocations and targeted marketing to capture incentives-driven buyers. Policy reversals could create significant residual-value risk on EV trade-ins.
Provincial/state policies
Provincial/state rebates, sales taxes and registration fees vary widely across AutoCanada markets—PST/HST ranges from 0% in Alberta to 13% in Ontario and 9.975% in Quebec—directly affecting regional retail pricing and margins. Provincial EV rebates (e.g., BC up to CAD 3,000) and federal 100% ZEV new‑vehicle target by 2035 shift OEM allocations and dealership training needs. Regional insurer rules change collision and repair reimbursement rates and parts approval processes. Network planning must monitor sub‑national policy divergence continuously.
Trade and tariffs
Tariffs and trade rules under CUSMA/USMCA (75% regional content for autos) mean vehicles meeting rules avoid general duties, but targeted measures—eg Section 232 steel tariffs (up to 25%) and 10% aluminum—raise parts landed costs and compress gross margins. Geopolitical tensions and supply-chain shocks since 2022 have disrupted cross-border flows and parts availability, while currency-linked pass-through complicates retail pricing and long-term OEM contracts limit AutoCanada’s ability to quickly offset tariff shocks.
Infrastructure and public transit
Government investment in roads and EV charging shapes car ownership and dealership footfall; Canada committed CAD 1.7 billion to the Zero-Emission Vehicle Infrastructure Program and public chargers exceeded ~12,000 by 2024, supporting EV retail activity. Expanded urban transit can dampen replacement cycles, while suburban infrastructure spending sustains truck/SUV demand—SUVs/trucks were ~77% of Canadian new vehicle sales in 2024. AutoCanada can tailor store formats to local mobility policy trajectories.
- EV infrastructure: CAD 1.7B ZEVIP, ~12,000 public chargers (2024)
- Transit impact: urban transit expansion reduces replacement frequency
- Suburban demand: trucks/SUVs ~77% of new sales (2024)
- Strategic response: adapt store formats by local policy
Procurement and fleet policies
Public-sector fleet electrification (Canada target: 100% ZEV new sales by 2035) and stricter procurement standards create B2B sales and aftersales service pipelines as fleets replace vehicles; the US Inflation Reduction Act domestic-content rules (up to US$7,500 EV tax credit) are already redirecting OEM production and allocations.
Policy-driven fleet turnover raises parts and collision work and forces sales teams to master tender processes, compliance checks and lifecycle cost bids to win contracts.
Incentives and ~12,000 chargers reshape 70+ dealers
Political factors—federal/provincial EV incentives (Canada iZEV up to CAD 5,000; US tax credit up to US$7,500), CAD 1.7B ZEVIP and ~12,000 public chargers (2024), CUSMA content rules and tariff risks, and public-fleet ZEV targets to 2035—shape AutoCanada’s model mix, margins and B2B pipeline across 70+ dealerships; regional tax/fee variance alters retail pricing and inventory turnover.
| Metric | Value |
|---|---|
| Dealerships | 70+ |
| ZEVIP funding | CAD 1.7B |
| Public chargers (2024) | ~12,000 |
| Truck/SUV share (2024) | ~77% |
What is included in the product
Detailed Word Document
Explores how external macro-environmental factors uniquely affect AutoCanada across Political, Economic, Social, Technological, Environmental and Legal dimensions. Each section is data-backed and forward-looking, designed for executives and investors to identify threats, opportunities and inform strategy and financing decisions.
Customizable Excel Spreadsheet
Visually segmented by PESTLE categories, the AutoCanada analysis offers a clean, shareable summary that speeds stakeholder alignment and decision-making. It’s editable for regional or business-line notes, making it ideal for presentations, strategy sessions, and consultant reports.
Economic factors
Interest rates and credit
Auto sales are highly sensitive to financing costs and lender appetite; with the Bank of Canada policy rate peaking at 5.00% in 2023, Canadian light‑vehicle sales fell to roughly 1.64 million in 2023, showing affordability effects. Rate cuts revive affordability and can boost new and used volumes, while hikes suppress demand. Subprime tightening shifted mix toward higher‑quality credit and longer terms, making F&I product penetration a key profit stabilizer for AutoCanada.
Consumer confidence
Consumer confidence shifts directly affect showroom traffic, conversion and deferred service; with the Bank of Canada policy rate at about 5% in 2024–25 and unemployment near 5% consumer sentiment tightened, reducing new-vehicle consideration. Wage growth (~4% YoY in 2024) and employment levels shape upgrade timing and accessory spend. In downturns used-vehicle transactions and service bays consistently outperform new sales. Marketing should pivot between value messaging and premium upsell as confidence swings.
Supply chain normalization
Post-pandemic inventory recovery—days’ supply normalizing to roughly 60 days in 2024—has moderated price inflation and reduced gross-per-unit for AutoCanada. Dealers now carry higher floorplan exposure with rates near 7%, driving up holding costs while competitive retail pricing compresses margins. Parts availability stabilized service throughput but tightened service margins. Allocation management and dynamic pricing are critical to defend PVR.
Used vehicle price cycles
Volatile wholesale auction prices—Manheim index down roughly 18% from the Nov 2021 peak—have compressed trade-in valuations and lowered reconditioning ROI, raising aging risk as normalization from prior peaks pressures used margins. AutoCanada's data-driven acquisition and stocking strategies reduce write-downs, while CPO programs, delivering roughly 8–12% premium, help sustain spreads when wholesale softens.
- Wholesale decline ~18% vs peak
- CPO premium 8–12%
- Higher days-to-turn increases aging risk
- Data-driven stocking limits write-downs
FX exposure CAD/USD
CAD/USD swings (USD/CAD ~1.36 in July 2025) lift imported vehicle and parts costs, squeezing margins; U.S. dealership earnings can offset Canadian softness but create translation risk on consolidated results. Pricing must balance competitiveness with FX pass-through; active hedging and inventory timing (forward contracts, FX collars) limit volatility.
- Impact: higher COGS
- Hedge: forwards/collars
- Mitigate: pricing & timing
Incentives and ~12,000 chargers reshape 70+ dealers
Higher borrowing costs (BoC peak 5.00% in 2023) and slower consumer confidence cut Canadian light‑vehicle sales to ~1.64M in 2023; rate cuts lift volumes while hikes suppress them. Inventory normalization (~60 days supply in 2024) reduced price inflation but raised floorplan costs (~7% lending). FX (USD/CAD ~1.36 Jul 2025) increases COGS and pressures margins; hedging and dynamic pricing mitigate risk.
| Metric | Value |
|---|---|
| BoC policy rate (peak) | 5.00% (2023) |
| Canada L‑vehicle sales | ~1.64M (2023) |
| Days' supply | ~60 (2024) |
| USD/CAD | ~1.36 (Jul 2025) |
Same Document Delivered
AutoCanada PESTLE Analysis
The preview shown here is the exact AutoCanada PESTLE Analysis you’ll receive after purchase—fully formatted and ready to use. The content, layout, and structure are identical to the downloadable file with no placeholders. After payment you’ll instantly get this same, professionally finished document.











