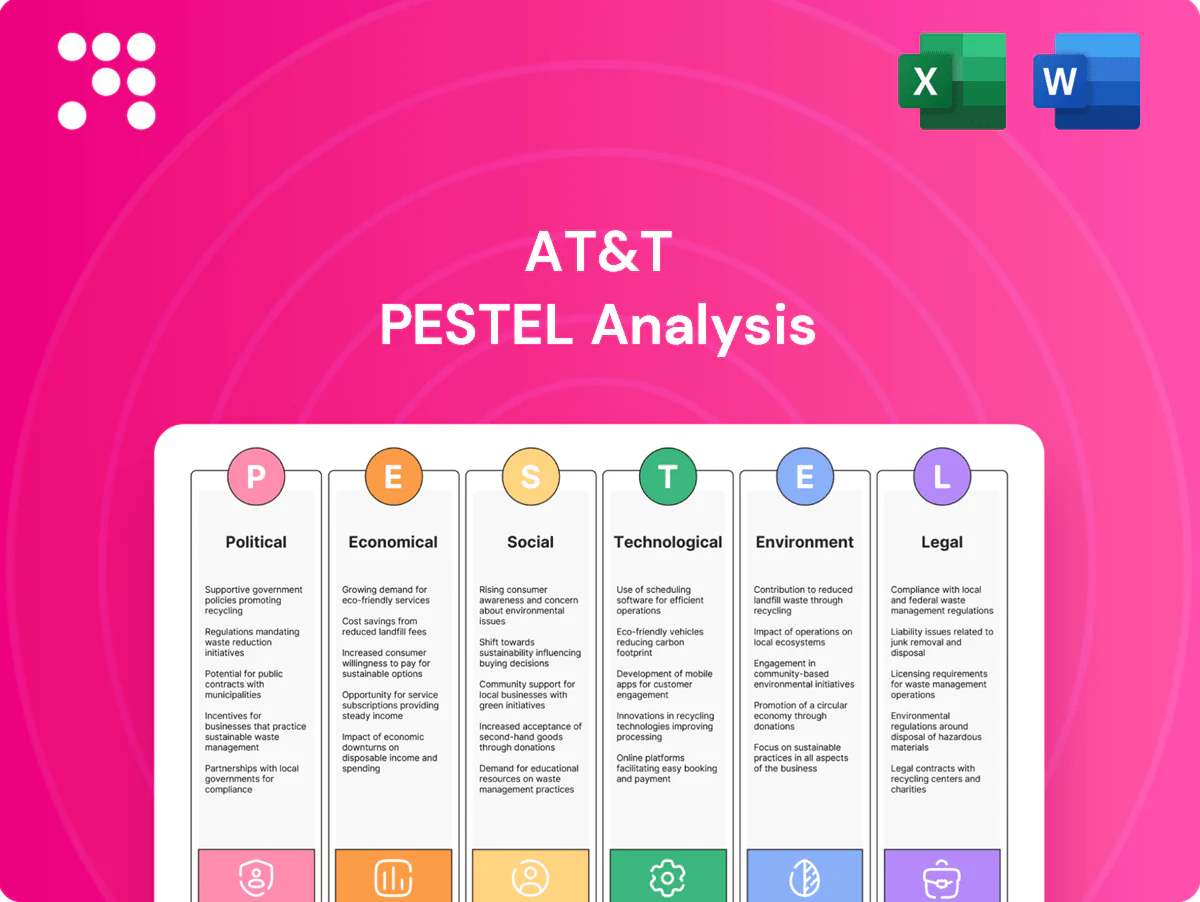
AT&T PESTLE Analysis

Skip the Research. Get the Strategy.
Explore how political regulation, economic cycles, shifting consumer behavior, technological disruption, legal challenges, and sustainability pressures shape AT&T’s strategy in our concise PESTLE overview. Gain actionable insights to anticipate risks and spot growth opportunities. Purchase the full PESTLE analysis to access detailed findings, data, and ready-to-use recommendations.
Political factors

FCC policy, net neutrality, and spectrum allocation
Shifts in FCC leadership and rules directly affect AT&T pricing, network management, and open‑internet obligations; the 2021 C‑band auction (≈$81B) and subsequent mid‑band allocations shape 5G capacity and timing. Reinstated net neutrality tightens traffic‑management and forces stricter compliance in service design. Spectrum auction timing and license conditions drive capital planning—AT&T’s annual network capex (~$15–20B) must align to meet 5G/6G coverage mandates.
Federal and state broadband subsidies
BEAD’s $42.45 billion federal program and companion state grants incentivize rural fiber buildouts but impose strict milestone, reporting and performance requirements on recipients.
Winning BEAD/state funds can accelerate passings and lower unit costs—industry estimates place rural FTTP cost per passing roughly between $3,000 and $8,000.
Political priorities shape eligibility, match funding and rollout timelines, so execution speed is a key competitive differentiator.

Geopolitics and telecom supply chain security
Restrictions on Chinese vendors narrow equipment choices and can raise procurement costs for carriers like AT&T. Trade tensions and US export controls introduced in 2022-23 have constrained access to advanced semiconductors and optical components. Government security standards now influence core and RAN architecture while policy support and programs such as the CHIPS Act (52.7 billion USD) favor diversification and domestic sourcing.

Public safety and national security mandates
Public safety and national security mandates force AT&T to meet E911 dispatchable-location and vertical accuracy rules, sustain FirstNet obligations from the original $6.5 billion award and serve over 3 million FirstNet connections (2024), and hit resiliency benchmarks (near 99.999% uptime) that drive hardening, backup investments and elevated capital spending (network capex >$18B annually in 2023–24).
- FirstNet: $6.5B contract, >3M connections (2024)
- E911: dispatchable location & z-axis accuracy mandates
- Resiliency: 99.999% targets → increased hardening/backup capex
- Performance in crises affects political goodwill and contracts
Local permitting and franchise dynamics
City and county rules control rights-of-way, pole access and small-cell siting; FCC shot clocks (typically 60–90 days) facilitate 5G densification while longer delays increase project timelines. Franchise fees commonly run 3–5% and dig/permit rules materially affect build economics. Strong community relations can accelerate approvals.
- Rights-of-way, pole access
- Shot clocks 60–90 days
- Franchise fees 3–5%
- Permitting impacts costs
Federal funding, spectrum rules and FirstNet push carriers to higher capex and tougher security
Federal rules (net neutrality reinstatement, FCC spectrum/licensing) and programs (BEAD $42.45B, CHIPS $52.7B) directly shape AT&T’s pricing, 5G/fiber timing and sourcing; spectrum/auction terms force alignment with ~ $15–20B annual network capex. Security/vendor restrictions and export controls raise procurement costs while FirstNet ($6.5B) and E911/resiliency mandates (>3M FirstNet connections, 99.999% targets) increase hardening spend.
| Item | 2024–25 figure |
|---|---|
| BEAD | $42.45B |
| CHIPS | $52.7B |
| FirstNet | $6.5B; >3M conn. |
| AT&T network capex | $15–20B/yr |
What is included in the product
 Detailed Word Document
Explores how external macro-environmental factors uniquely affect the AT&T across six dimensions—Political, Economic, Social, Technological, Environmental, and Legal—backed by data and trends to help executives, consultants, and investors identify risks, opportunities, and forward-looking strategic options.

 Customizable Excel Spreadsheet
A concise, visually segmented PESTLE summary of AT&T that’s easy to drop into slides, share across teams, and annotate for regional or business-line specifics—ideal for planning sessions, presentations, and consultant reports.
Economic factors

Interest rates and heavy leverage
AT&T's heavy leverage, with total debt above $100 billion, makes earnings and EPS sensitive to shifts in interest rates and refinancing windows. A lower 10-year Treasury (around 4.2% mid-2025) and narrower corporate spreads improve free cash flow and speed deleveraging. Conversely, higher rates compress dividend capacity and capex flexibility as credit spreads and Treasury yields set the refinancing backdrop.
Competitive pricing and ARPU pressure
Promotional intensity from peers and cable MVNOs like Xfinity and Spectrum compresses margins as AT&T competes for price-sensitive customers; AT&T wireless ARPU was about $54 in 2024. Device subsidies and retention credits lower customer lifetime value by increasing upfront costs and boosting equipment-related spend. A mix shift to value plans can dilute ARPU without usage growth. Disciplined pricing must balance margin protection against churn rising toward 0.8–1.0%.

Capex cycles for 5G and fiber
Peak 5G and fiber capex depress AT&Ts near-term free cash flow but create durable capacity as networks scale; federal BEAD funding totals $42.45 billion aimed at ~20 million unserved locations, which alters subsidy-driven economics. Unit costs fall with density and operational learnings, shortening payback as sites and fiber splits increase. Vendor terms and AT&T capital prioritization determine speed of market-share gains.

Macroeconomic demand and enterprise spending
Macroeconomic slowdowns curb consumer upgrades as device cycles extended, while AT&T sees enterprise and SMB connectivity, IoT and security budgets closely tracking US GDP — US real GDP grew about 2.5% in 2024, supporting steady corporate IT spend. Remote and hybrid work continued to sustain broadband demand, with fixed broadband subscriptions rising modestly in 2024. Elasticity differs: wireless remains less price-sensitive than fiber business services.
- Consumer upgrade elasticity: high in downturns
- SMB/enterprise spend ~tied to GDP ~2.5% (2024)
- Remote work → sustained broadband growth (2024)
- Wireless less elastic than fiber/enterprise services
Spectrum and auction costs
License payments and clearing costs materially affect AT&T’s balance sheet and deployment timing: AT&T spent about 23.4 billion dollars in the FCC C-band (Auction 107) while the auction raised roughly 81.2 billion dollars overall, and FAA-led restrictions in 2022 created policy-driven deferrals that delayed some rollouts. Contiguous mid-band holdings raise spectral efficiency, lowering cost per bit, and secondary-market trades (spectrum swaps/sales) are used to optimize portfolios and timing.
- License/cost impact: AT&T $23.4B (Auction 107)
- Policy risk: FAA 2022 deployment delays
- Operational benefit: contiguous mid-band → lower $/bit
- Optimization: secondary-market trades refine holdings
Federal funding, spectrum rules and FirstNet push carriers to higher capex and tougher security
High leverage (total debt >$100B) and 10yr Treasury ~4.2% (mid-2025) raise refinancing and dividend risk; wireless ARPU ~$54 (2024) and promo pressure compress margins; peak 5G/fiber capex limits near-term FCF despite BEAD $42.45B subsidy tailwinds; C-band spend $23.4B (Auction 107) affects deployment timing.
| Metric | Value |
|---|---|
| Total debt | >$100B |
| 10yr Treasury | ~4.2% (mid-2025) |
| Wireless ARPU | $54 (2024) |
| BEAD | $42.45B |
| C-band spend | $23.4B |
Preview the Actual Deliverable
AT&T PESTLE Analysis
This AT&T PESTLE Analysis provides concise political, economic, social, technological, legal, and environmental insights to inform strategic decisions; the content and structure shown in the preview is the same document you’ll download after payment.

Original: $10.00
-65%$10.00
$3.50Product Information
Product Information
Shipping & Returns
Shipping & Returns
Description
Skip the Research. Get the Strategy.
Explore how political regulation, economic cycles, shifting consumer behavior, technological disruption, legal challenges, and sustainability pressures shape AT&T’s strategy in our concise PESTLE overview. Gain actionable insights to anticipate risks and spot growth opportunities. Purchase the full PESTLE analysis to access detailed findings, data, and ready-to-use recommendations.
Political factors
FCC policy, net neutrality, and spectrum allocation
Shifts in FCC leadership and rules directly affect AT&T pricing, network management, and open‑internet obligations; the 2021 C‑band auction (≈$81B) and subsequent mid‑band allocations shape 5G capacity and timing. Reinstated net neutrality tightens traffic‑management and forces stricter compliance in service design. Spectrum auction timing and license conditions drive capital planning—AT&T’s annual network capex (~$15–20B) must align to meet 5G/6G coverage mandates.
Federal and state broadband subsidies
BEAD’s $42.45 billion federal program and companion state grants incentivize rural fiber buildouts but impose strict milestone, reporting and performance requirements on recipients.
Winning BEAD/state funds can accelerate passings and lower unit costs—industry estimates place rural FTTP cost per passing roughly between $3,000 and $8,000.
Political priorities shape eligibility, match funding and rollout timelines, so execution speed is a key competitive differentiator.
Geopolitics and telecom supply chain security
Restrictions on Chinese vendors narrow equipment choices and can raise procurement costs for carriers like AT&T. Trade tensions and US export controls introduced in 2022-23 have constrained access to advanced semiconductors and optical components. Government security standards now influence core and RAN architecture while policy support and programs such as the CHIPS Act (52.7 billion USD) favor diversification and domestic sourcing.
Public safety and national security mandates
Public safety and national security mandates force AT&T to meet E911 dispatchable-location and vertical accuracy rules, sustain FirstNet obligations from the original $6.5 billion award and serve over 3 million FirstNet connections (2024), and hit resiliency benchmarks (near 99.999% uptime) that drive hardening, backup investments and elevated capital spending (network capex >$18B annually in 2023–24).
- FirstNet: $6.5B contract, >3M connections (2024)
- E911: dispatchable location & z-axis accuracy mandates
- Resiliency: 99.999% targets → increased hardening/backup capex
- Performance in crises affects political goodwill and contracts
Local permitting and franchise dynamics
City and county rules control rights-of-way, pole access and small-cell siting; FCC shot clocks (typically 60–90 days) facilitate 5G densification while longer delays increase project timelines. Franchise fees commonly run 3–5% and dig/permit rules materially affect build economics. Strong community relations can accelerate approvals.
- Rights-of-way, pole access
- Shot clocks 60–90 days
- Franchise fees 3–5%
- Permitting impacts costs
Federal funding, spectrum rules and FirstNet push carriers to higher capex and tougher security
Federal rules (net neutrality reinstatement, FCC spectrum/licensing) and programs (BEAD $42.45B, CHIPS $52.7B) directly shape AT&T’s pricing, 5G/fiber timing and sourcing; spectrum/auction terms force alignment with ~ $15–20B annual network capex. Security/vendor restrictions and export controls raise procurement costs while FirstNet ($6.5B) and E911/resiliency mandates (>3M FirstNet connections, 99.999% targets) increase hardening spend.
| Item | 2024–25 figure |
|---|---|
| BEAD | $42.45B |
| CHIPS | $52.7B |
| FirstNet | $6.5B; >3M conn. |
| AT&T network capex | $15–20B/yr |
What is included in the product
Detailed Word Document
Explores how external macro-environmental factors uniquely affect the AT&T across six dimensions—Political, Economic, Social, Technological, Environmental, and Legal—backed by data and trends to help executives, consultants, and investors identify risks, opportunities, and forward-looking strategic options.
Customizable Excel Spreadsheet
A concise, visually segmented PESTLE summary of AT&T that’s easy to drop into slides, share across teams, and annotate for regional or business-line specifics—ideal for planning sessions, presentations, and consultant reports.
Economic factors
Interest rates and heavy leverage
AT&T's heavy leverage, with total debt above $100 billion, makes earnings and EPS sensitive to shifts in interest rates and refinancing windows. A lower 10-year Treasury (around 4.2% mid-2025) and narrower corporate spreads improve free cash flow and speed deleveraging. Conversely, higher rates compress dividend capacity and capex flexibility as credit spreads and Treasury yields set the refinancing backdrop.
Competitive pricing and ARPU pressure
Promotional intensity from peers and cable MVNOs like Xfinity and Spectrum compresses margins as AT&T competes for price-sensitive customers; AT&T wireless ARPU was about $54 in 2024. Device subsidies and retention credits lower customer lifetime value by increasing upfront costs and boosting equipment-related spend. A mix shift to value plans can dilute ARPU without usage growth. Disciplined pricing must balance margin protection against churn rising toward 0.8–1.0%.
Capex cycles for 5G and fiber
Peak 5G and fiber capex depress AT&Ts near-term free cash flow but create durable capacity as networks scale; federal BEAD funding totals $42.45 billion aimed at ~20 million unserved locations, which alters subsidy-driven economics. Unit costs fall with density and operational learnings, shortening payback as sites and fiber splits increase. Vendor terms and AT&T capital prioritization determine speed of market-share gains.
Macroeconomic demand and enterprise spending
Macroeconomic slowdowns curb consumer upgrades as device cycles extended, while AT&T sees enterprise and SMB connectivity, IoT and security budgets closely tracking US GDP — US real GDP grew about 2.5% in 2024, supporting steady corporate IT spend. Remote and hybrid work continued to sustain broadband demand, with fixed broadband subscriptions rising modestly in 2024. Elasticity differs: wireless remains less price-sensitive than fiber business services.
- Consumer upgrade elasticity: high in downturns
- SMB/enterprise spend ~tied to GDP ~2.5% (2024)
- Remote work → sustained broadband growth (2024)
- Wireless less elastic than fiber/enterprise services
Spectrum and auction costs
License payments and clearing costs materially affect AT&T’s balance sheet and deployment timing: AT&T spent about 23.4 billion dollars in the FCC C-band (Auction 107) while the auction raised roughly 81.2 billion dollars overall, and FAA-led restrictions in 2022 created policy-driven deferrals that delayed some rollouts. Contiguous mid-band holdings raise spectral efficiency, lowering cost per bit, and secondary-market trades (spectrum swaps/sales) are used to optimize portfolios and timing.
- License/cost impact: AT&T $23.4B (Auction 107)
- Policy risk: FAA 2022 deployment delays
- Operational benefit: contiguous mid-band → lower $/bit
- Optimization: secondary-market trades refine holdings
Federal funding, spectrum rules and FirstNet push carriers to higher capex and tougher security
High leverage (total debt >$100B) and 10yr Treasury ~4.2% (mid-2025) raise refinancing and dividend risk; wireless ARPU ~$54 (2024) and promo pressure compress margins; peak 5G/fiber capex limits near-term FCF despite BEAD $42.45B subsidy tailwinds; C-band spend $23.4B (Auction 107) affects deployment timing.
| Metric | Value |
|---|---|
| Total debt | >$100B |
| 10yr Treasury | ~4.2% (mid-2025) |
| Wireless ARPU | $54 (2024) |
| BEAD | $42.45B |
| C-band spend | $23.4B |
Preview the Actual Deliverable
AT&T PESTLE Analysis
This AT&T PESTLE Analysis provides concise political, economic, social, technological, legal, and environmental insights to inform strategic decisions; the content and structure shown in the preview is the same document you’ll download after payment.











