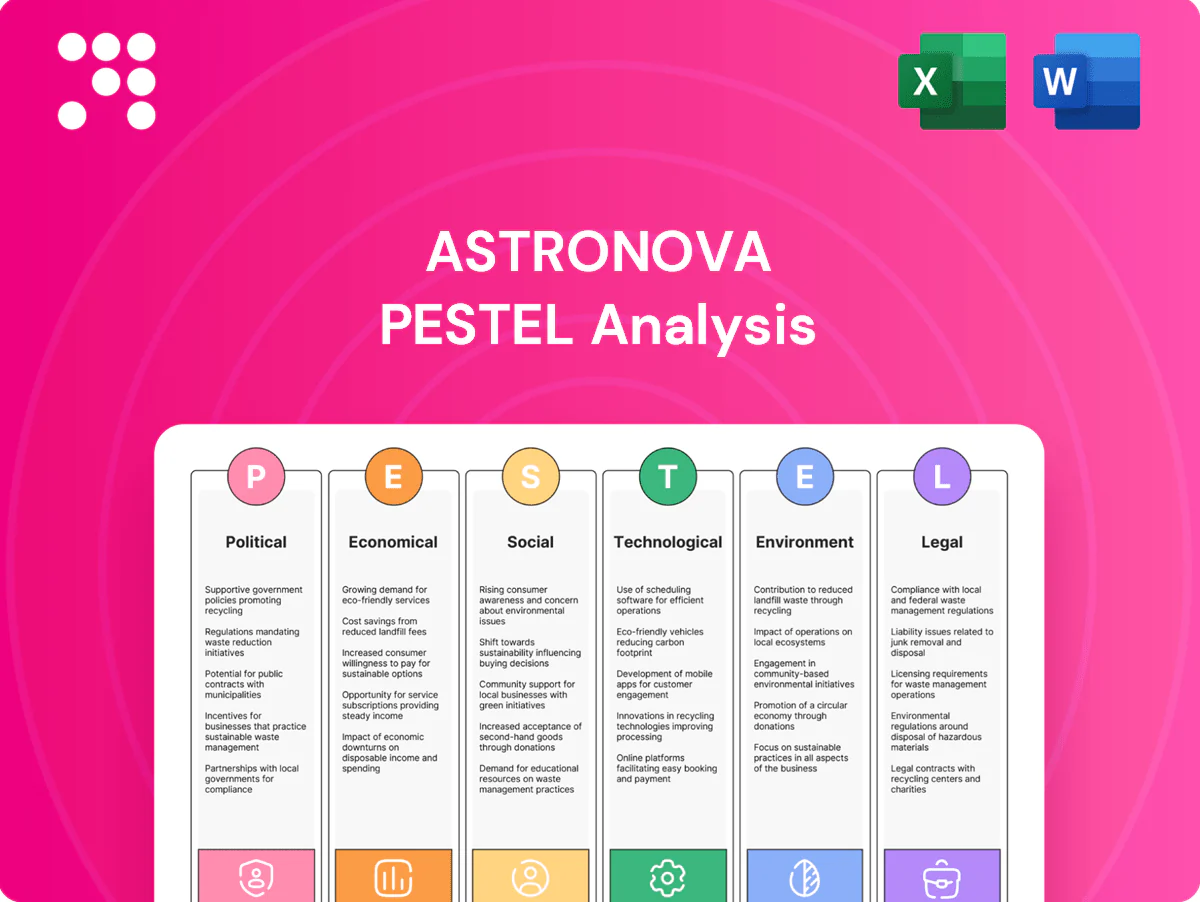
AstroNova PESTLE Analysis

Skip the Research. Get the Strategy.
Unlock strategic clarity with our PESTLE Analysis of AstroNova—concise, evidence-based insights into political, economic, social, technological, legal and environmental forces shaping its future. Ideal for investors and strategists, it highlights risks and growth opportunities you can act on. Purchase the full report for the complete, editable breakdown and immediate download.
Political factors

Trade policies and tariffs on electronics
AstroNova’s printers and data acquisition systems depend on global component supply chains vulnerable to tariffs on semiconductors, printheads and electronics assemblies; the global semiconductor market was about $573bn in 2023, making tariff exposure economically significant. Section 301 tariffs of up to 25% on roughly $250bn of Chinese goods since 2018 and lower EU tariff rates (generally 0–4% on electronics) can alter landed costs and lead times. The company may need to adjust sourcing, pricing or inventory buffers to mitigate volatility, while preferential trade agreements can either open or restrict market access.
Government procurement and defense spending
AstroNovas Test & Measurement business relies on high-speed data recording for aerospace, defense and industrial programs that track public budgets; global military spending reached about 2.24 trillion USD in 2023 and the US alone spent 877 billion USD (SIPRI 2023). Changes in defense appropriations and infrastructure initiatives directly shift project pipelines, while multi-year procurement cycles give visibility yet expose revenue to budget revisions. Stringent vendor qualification and documented past performance create a competitive barrier and durable moat for qualified suppliers.

Industrial policy and onshoring incentives
Policies promoting domestic manufacturing and supply‑chain resilience can support local production of printers and electronics for AstroNova; US CHIPS Act funding of roughly $52.7 billion and the Inflation Reduction Act’s ~$369 billion in energy/climate incentives increase grant and tax‑credit availability for automation and R&D. Compliance, origin rules and reporting add operational complexity, prompting location shifts to capture incentives while balancing labor and overhead costs.

Regulatory harmonization and standards setting
Labeling standards, barcode formats and sector rules (e.g., pharma, food) are set by political bodies and standards groups; GS1 reports over 2.5 million member companies worldwide (GS1, 2024), underscoring global alignment. Harmonization cuts customization costs and time-to-market, while fragmentation increases engineering and support burdens. Active participation in standards working groups helps anticipate changes and early compliance can serve as a sales differentiator in regulated markets.
- Labeling standards drive market access and liability management
- Barcode formats (GS1) enable interoperability across 150+ countries
- Sector rules (MDR, FSMA) increase certification needs and support costs
- Standards participation reduces regulatory lag and boosts sales credibility
Geopolitical risk and export controls
Restrictions on advanced electronics and data systems exports (US controls expanded in 2022–23) can shut out markets and hit addressable demand in the $555B global semiconductor/advanced electronics market (WSTS 2023). Licensing adds weeks to months of lead time and administrative cost; sanctions or regional conflicts disrupt logistics and service networks. Diversifying end markets and designing for compliance reduce exposure.
- Export controls: limit market access
- Licensing: weeks–months delay
- Sanctions: logistics/service risk
- Mitigation: market diversification, compliance-by-design
Tariffs, export controls and onshoring reshape semiconductor test demand
AstroNova faces tariff and export-control risks: global semiconductor market ~$573bn (2023), US tariffs/controls can add up to 25% cost or months-long delays. Defense spending (~$2.24trn global; US $877bn in 2023) drives Test & Measurement demand but ties revenue to budget cycles. US CHIPS $52.7bn and IRA ~$369bn shift incentives toward domestic sourcing and R&D.
| Political Factor | 2023/24 Data | Impact |
|---|---|---|
| Tariffs/Export controls | Semis $573bn; 25% tariffs | Cost, delays |
| Defense budgets | $2.24trn global; $877bn US | Demand volatility |
| Incentives | CHIPS $52.7bn; IRA $369bn | Onshoring, subsidies |
What is included in the product
 Detailed Word Document
Explores how external macro-environmental factors uniquely affect the AstroNova across six dimensions—Political, Economic, Social, Technological, Environmental, and Legal—each backed by current data and trends to reflect real market and regulatory dynamics. Designed for executives, consultants, and entrepreneurs, it offers forward‑looking insights, scenario support, and ready‑to‑insert findings for plans, decks, or reports.

 Customizable Excel Spreadsheet
A concise, visually segmented PESTLE summary of AstroNova for quick reference in meetings, easily shareable and editable for regional or business-line notes, ideal for slide decks and rapid team alignment.
Economic factors

Cyclical capital spending and industrial demand
Printer fleets and data-acquisition systems at AstroNova are discretionary capex tied to manufacturing, logistics and aerospace cycles, so downturns delay upgrades while expansions favor digital short-run printing investments. Aftermarket supplies and consumables, which represented a meaningful portion of revenue in FY2024 (company reported $112.6 million total revenue), provide recurring cash flow that partially offsets cyclicality. Backlog and subscription-like service contracts have increased resilience by smoothing revenue during order slowdowns.
Inflation and component cost volatility
Input-cost volatility for printheads, substrates, electronics and freight directly pressures AstroNova margins; ocean freight rates plunged from 2022 peaks near US$20,000 per FEU to roughly US$1,500–2,000 in 2024, but semiconductor and substrate price swings kept COGS unstable.
Broad inflation remained elevated (around 3–4% in 2024), so list-price and value-based pricing often lag cost spikes, compressing gross margin temporarily.
Strategic inventory buffers and fixed supplier agreements have proven to stabilize availability and cap short-term price exposure.
Design-to-cost and BOM simplification initiatives reduce sensitivity to component inflation, lowering unit-cost volatility and protecting margin recovery.

Foreign exchange and international sales mix
Revenue from EMEA and APAC exposes AstroNova to FX translation and transaction risk as the U.S. dollar strengthened; the Bloomberg Dollar Spot Index averaged about 104.2 in 2024, pressuring price competitiveness and reported results when translated to USD. Natural hedging from local sourcing and regional expenses can offset a portion of that exposure. Active hedging programs can smooth earnings but typically add complexity and incremental costs often in the low single-digit percentage range of exposed flows.

Labor market conditions and productivity
Tight engineering and technician markets push wage inflation—U.S. engineering unemployment near 2% and median engineering wages rose about 5% YoY in 2024, squeezing margins for AstroNova. Targeted automation in assembly, calibration and testing (robot installations up ~6% in 2024) can offset labor cost pressure. Investment in training and retention (cutting turnover costs by ~20–30%) preserves knowledge capital.
- Wage pressure: engineering wages +5% (2024)
- Automation: robot installs +6% (2024)
- Retention: turnover cost reduction ~20–30%
- Hubs: Boston, Austin, Shenzhen influence R&D/service siting
E-commerce and logistics sector growth
Rising parcel volumes—global e-commerce sales reached about 5.9 trillion USD in 2023 and continue growing—plus SKU proliferation drive demand for on‑demand labels and tags, pushing warehouses to replace analog printers with digital solutions to improve throughput and reduce errors. The digital label market shows ~8% CAGR (2024–30), enabling subscription supplies and service contracts to scale with throughput and opening verticalized offerings for warehouses and 3PLs to expand wallet share.
- Global e‑commerce ~5.9T USD (2023)
- Digital label market ~8% CAGR (2024–30)
- Subscription/service revenue scales with parcel throughput
- Vertical warehouse/3PL solutions increase share of wallet
Tariffs, export controls and onshoring reshape semiconductor test demand
AstroNova revenue mix (FY2024 $112.6M) and consumables recur protect cash flow against capex cycles; backlog and service contracts smooth demand shocks. Input-cost and wage inflation (engineering +5% in 2024) compress margins while automation (robot installs +6%) offsets labor pressure. FX (Bloomberg Dollar Spot 104.2 in 2024) and digital-label demand (8% CAGR) drive pricing and growth dynamics.
| Metric | Value |
|---|---|
| FY2024 Revenue | 112.6M USD |
| Engineer's wage change (2024) | +5% |
| Robot installs (2024) | +6% |
| Bloomberg Dollar Spot (2024) | 104.2 |
| Digital label CAGR (2024–30) | ~8% |
What You See Is What You Get
AstroNova PESTLE Analysis
The preview shown here is the exact AstroNova PESTLE Analysis you’ll receive after purchase—fully formatted and ready to use. The content, layout, and structure in this screenshot match the final downloadable file. No placeholders or teasers—this is the real, finished document delivered instantly upon checkout.

Product Information
Product Information
Shipping & Returns
Shipping & Returns
Description
Skip the Research. Get the Strategy.
Unlock strategic clarity with our PESTLE Analysis of AstroNova—concise, evidence-based insights into political, economic, social, technological, legal and environmental forces shaping its future. Ideal for investors and strategists, it highlights risks and growth opportunities you can act on. Purchase the full report for the complete, editable breakdown and immediate download.
Political factors
Trade policies and tariffs on electronics
AstroNova’s printers and data acquisition systems depend on global component supply chains vulnerable to tariffs on semiconductors, printheads and electronics assemblies; the global semiconductor market was about $573bn in 2023, making tariff exposure economically significant. Section 301 tariffs of up to 25% on roughly $250bn of Chinese goods since 2018 and lower EU tariff rates (generally 0–4% on electronics) can alter landed costs and lead times. The company may need to adjust sourcing, pricing or inventory buffers to mitigate volatility, while preferential trade agreements can either open or restrict market access.
Government procurement and defense spending
AstroNovas Test & Measurement business relies on high-speed data recording for aerospace, defense and industrial programs that track public budgets; global military spending reached about 2.24 trillion USD in 2023 and the US alone spent 877 billion USD (SIPRI 2023). Changes in defense appropriations and infrastructure initiatives directly shift project pipelines, while multi-year procurement cycles give visibility yet expose revenue to budget revisions. Stringent vendor qualification and documented past performance create a competitive barrier and durable moat for qualified suppliers.
Industrial policy and onshoring incentives
Policies promoting domestic manufacturing and supply‑chain resilience can support local production of printers and electronics for AstroNova; US CHIPS Act funding of roughly $52.7 billion and the Inflation Reduction Act’s ~$369 billion in energy/climate incentives increase grant and tax‑credit availability for automation and R&D. Compliance, origin rules and reporting add operational complexity, prompting location shifts to capture incentives while balancing labor and overhead costs.
Regulatory harmonization and standards setting
Labeling standards, barcode formats and sector rules (e.g., pharma, food) are set by political bodies and standards groups; GS1 reports over 2.5 million member companies worldwide (GS1, 2024), underscoring global alignment. Harmonization cuts customization costs and time-to-market, while fragmentation increases engineering and support burdens. Active participation in standards working groups helps anticipate changes and early compliance can serve as a sales differentiator in regulated markets.
- Labeling standards drive market access and liability management
- Barcode formats (GS1) enable interoperability across 150+ countries
- Sector rules (MDR, FSMA) increase certification needs and support costs
- Standards participation reduces regulatory lag and boosts sales credibility
Geopolitical risk and export controls
Restrictions on advanced electronics and data systems exports (US controls expanded in 2022–23) can shut out markets and hit addressable demand in the $555B global semiconductor/advanced electronics market (WSTS 2023). Licensing adds weeks to months of lead time and administrative cost; sanctions or regional conflicts disrupt logistics and service networks. Diversifying end markets and designing for compliance reduce exposure.
- Export controls: limit market access
- Licensing: weeks–months delay
- Sanctions: logistics/service risk
- Mitigation: market diversification, compliance-by-design
Tariffs, export controls and onshoring reshape semiconductor test demand
AstroNova faces tariff and export-control risks: global semiconductor market ~$573bn (2023), US tariffs/controls can add up to 25% cost or months-long delays. Defense spending (~$2.24trn global; US $877bn in 2023) drives Test & Measurement demand but ties revenue to budget cycles. US CHIPS $52.7bn and IRA ~$369bn shift incentives toward domestic sourcing and R&D.
| Political Factor | 2023/24 Data | Impact |
|---|---|---|
| Tariffs/Export controls | Semis $573bn; 25% tariffs | Cost, delays |
| Defense budgets | $2.24trn global; $877bn US | Demand volatility |
| Incentives | CHIPS $52.7bn; IRA $369bn | Onshoring, subsidies |
What is included in the product
Detailed Word Document
Explores how external macro-environmental factors uniquely affect the AstroNova across six dimensions—Political, Economic, Social, Technological, Environmental, and Legal—each backed by current data and trends to reflect real market and regulatory dynamics. Designed for executives, consultants, and entrepreneurs, it offers forward‑looking insights, scenario support, and ready‑to‑insert findings for plans, decks, or reports.
Customizable Excel Spreadsheet
A concise, visually segmented PESTLE summary of AstroNova for quick reference in meetings, easily shareable and editable for regional or business-line notes, ideal for slide decks and rapid team alignment.
Economic factors
Cyclical capital spending and industrial demand
Printer fleets and data-acquisition systems at AstroNova are discretionary capex tied to manufacturing, logistics and aerospace cycles, so downturns delay upgrades while expansions favor digital short-run printing investments. Aftermarket supplies and consumables, which represented a meaningful portion of revenue in FY2024 (company reported $112.6 million total revenue), provide recurring cash flow that partially offsets cyclicality. Backlog and subscription-like service contracts have increased resilience by smoothing revenue during order slowdowns.
Inflation and component cost volatility
Input-cost volatility for printheads, substrates, electronics and freight directly pressures AstroNova margins; ocean freight rates plunged from 2022 peaks near US$20,000 per FEU to roughly US$1,500–2,000 in 2024, but semiconductor and substrate price swings kept COGS unstable.
Broad inflation remained elevated (around 3–4% in 2024), so list-price and value-based pricing often lag cost spikes, compressing gross margin temporarily.
Strategic inventory buffers and fixed supplier agreements have proven to stabilize availability and cap short-term price exposure.
Design-to-cost and BOM simplification initiatives reduce sensitivity to component inflation, lowering unit-cost volatility and protecting margin recovery.
Foreign exchange and international sales mix
Revenue from EMEA and APAC exposes AstroNova to FX translation and transaction risk as the U.S. dollar strengthened; the Bloomberg Dollar Spot Index averaged about 104.2 in 2024, pressuring price competitiveness and reported results when translated to USD. Natural hedging from local sourcing and regional expenses can offset a portion of that exposure. Active hedging programs can smooth earnings but typically add complexity and incremental costs often in the low single-digit percentage range of exposed flows.
Labor market conditions and productivity
Tight engineering and technician markets push wage inflation—U.S. engineering unemployment near 2% and median engineering wages rose about 5% YoY in 2024, squeezing margins for AstroNova. Targeted automation in assembly, calibration and testing (robot installations up ~6% in 2024) can offset labor cost pressure. Investment in training and retention (cutting turnover costs by ~20–30%) preserves knowledge capital.
- Wage pressure: engineering wages +5% (2024)
- Automation: robot installs +6% (2024)
- Retention: turnover cost reduction ~20–30%
- Hubs: Boston, Austin, Shenzhen influence R&D/service siting
E-commerce and logistics sector growth
Rising parcel volumes—global e-commerce sales reached about 5.9 trillion USD in 2023 and continue growing—plus SKU proliferation drive demand for on‑demand labels and tags, pushing warehouses to replace analog printers with digital solutions to improve throughput and reduce errors. The digital label market shows ~8% CAGR (2024–30), enabling subscription supplies and service contracts to scale with throughput and opening verticalized offerings for warehouses and 3PLs to expand wallet share.
- Global e‑commerce ~5.9T USD (2023)
- Digital label market ~8% CAGR (2024–30)
- Subscription/service revenue scales with parcel throughput
- Vertical warehouse/3PL solutions increase share of wallet
Tariffs, export controls and onshoring reshape semiconductor test demand
AstroNova revenue mix (FY2024 $112.6M) and consumables recur protect cash flow against capex cycles; backlog and service contracts smooth demand shocks. Input-cost and wage inflation (engineering +5% in 2024) compress margins while automation (robot installs +6%) offsets labor pressure. FX (Bloomberg Dollar Spot 104.2 in 2024) and digital-label demand (8% CAGR) drive pricing and growth dynamics.
| Metric | Value |
|---|---|
| FY2024 Revenue | 112.6M USD |
| Engineer's wage change (2024) | +5% |
| Robot installs (2024) | +6% |
| Bloomberg Dollar Spot (2024) | 104.2 |
| Digital label CAGR (2024–30) | ~8% |
What You See Is What You Get
AstroNova PESTLE Analysis
The preview shown here is the exact AstroNova PESTLE Analysis you’ll receive after purchase—fully formatted and ready to use. The content, layout, and structure in this screenshot match the final downloadable file. No placeholders or teasers—this is the real, finished document delivered instantly upon checkout.











