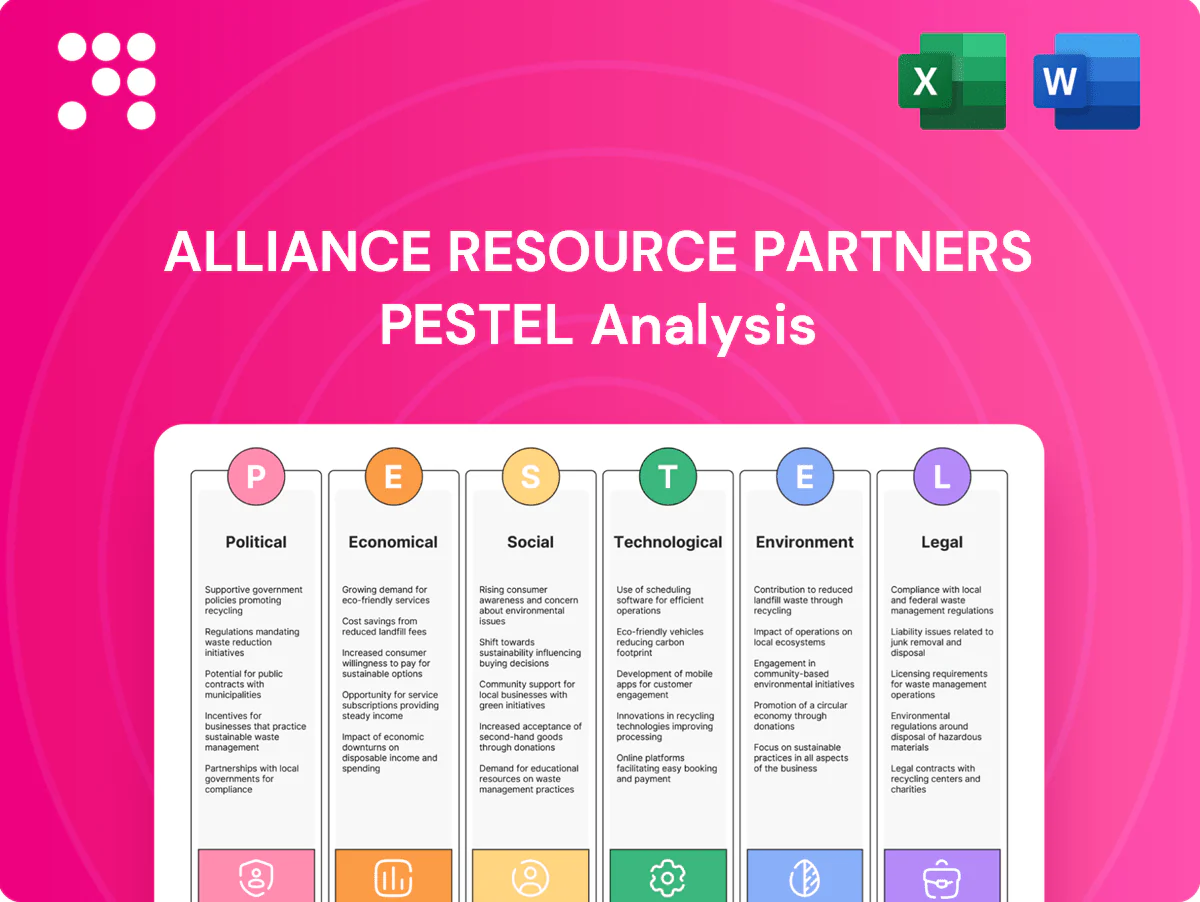
Alliance Resource Partners PESTLE Analysis

Make Smarter Strategic Decisions with a Complete PESTEL View
Unlock strategic clarity with our PESTLE Analysis of Alliance Resource Partners—three to five critical factors explained to reveal regulatory, economic, and environmental pressures shaping coal logistics and production. Turn these insights into competitive moves; purchase the full report for the complete, actionable breakdown.
Political factors

U.S. energy policy shifts
Federal and state priorities—driven by the Inflation Reduction Act's roughly $369 billion clean‑energy incentives and EIA data showing coal fell to about 19% of US generation in 2023—can accelerate retirements or prompt baseload support that affects Alliance Resource Partners’ volume risk. Tightening pro‑renewable mandates would reduce coal demand, while NERC/DOE reliability warnings in 2024 could delay closures. Monitoring policy cycles is critical for ARLP’s contracting strategy.
Permitting and approvals
State and federal permits govern mines, expansions and infrastructure for Alliance Resource Partners (NYSE: ARLP), with federal NEPA environmental reviews commonly taking 3–5 years for complex projects.
Longer timelines raise project risk and capital costs, often delaying cash flows and adding financing expense to multi-year mine development schedules.
Streamlined approvals can unlock reserves and boost productivity, while local political sentiment and permitting opposition have materially influenced permit outcomes in Appalachian and Illinois Basin projects.

Power market design
RTO/ISO capacity rules materially shift coal plant economics and dispatch, directly impacting ARLP coal offtake as coal supplied ~19% of U.S. generation in 2023 (EIA). Policy moves toward resilience credits and state capacity adders have sustained some coal burn in markets (select state programs), while emissions penalties — e.g., RGGI ≈$13/ton and California ≈$35/ton in 2024 — reduce run-time. ARLP’s contract tenors (typical 5–15 years) must be structured to reflect evolving market rules and price risks.

Infrastructure and transport policy
Rail regulation and investment shape ARLP coal logistics: rail moves roughly 70% of U.S. coal ton‑miles, so congestion or underinvestment raises delivered costs and threatens reliability; bottlenecks have pushed spot rail rates and demurrage charges higher in recent years. Political support for eastern freight corridors and BIL-era rail grants improves ARLP access to power markets, while any rail labor disputes materially risk shipments.
- Rail share ~70% of coal ton‑miles
- Bottlenecks → higher delivered costs
- Freight corridor funding aids eastern reach
- Labor disputes = shipment risk
Geopolitics and fuel substitution
- Geopolitics: LNG shocks swing fuel mix
- Sanctions: widen commodity spreads
- Price impact: coal generation +17% (2022)
- Exports: ~13 Bcf/d U.S. LNG (2024) affect domestic prices
IRA ~$369B, carbon $13-$35/t, rail risk, LNG switching
Federal IRA incentives (~$369B) and state carbon prices (RGGI ≈$13/t, CA ≈$35/t in 2024) reduce coal demand and raise ARLP retirement risk; NERC/DOE reliability guidance can defer closures. Rail carries ~70% of coal ton‑miles—BIL grants improve access but labor disputes and congestion raise costs. LNG exports (~13 Bcf/d in 2024) and Henry Hub 2023 ≈3.08 USD/MMBtu drive fuel switching.
| Metric | Value |
|---|---|
| IRA incentives | ~369B USD |
| Carbon price (2024) | RGGI ~$13/t, CA ~$35/t |
| Rail share | ~70% coal ton‑miles |
| US LNG (2024) | ~13 Bcf/d |
What is included in the product
 Detailed Word Document
Explores how macro-environmental factors across Political, Economic, Social, Technological, Environmental and Legal dimensions uniquely affect Alliance Resource Partners, with data-backed trends and region-specific regulatory context. Designed for executives and investors, it delivers forward-looking insights, scenario implications and clean, report-ready findings to identify risks, opportunities and funding-ready narratives.

 Customizable Excel Spreadsheet
A concise, visually segmented PESTLE summary for Alliance Resource Partners that simplifies external risk assessment and market positioning, ideal for quick drops into presentations or strategy sessions. Easily editable and shareable so teams can add region- or business-specific notes and align rapidly during planning.
Economic factors

Coal price and demand cycles
Utility stockpiles, weather and generation mix drive coal pricing; coal supplied about 19% of US electricity in 2023 and US coal production was ~494 million short tons in 2023 (EIA). ARLP’s revenues hinge on multi-year contracts plus spot exposure, so spikes in spot prices can boost realizations but tend to be transient. Hedging, fixed-price sales and contract optionality are used to manage volatility and protect cash flow.
Natural gas competition
Gas-to-coal switching is highly price sensitive: Henry Hub traded mostly below 3.00/MMBtu in 2024–H1 2025, suppressing coal burn and curtailing ARLP orders. When gas rallies above roughly 4.00/MMBtu, coal dispatch economically recovers and supports higher coal volumes. ARLP’s basin mix must align with regional spark and dark spreads to capture value across PJM, MISO and ERCOT markets.

Royalty income diversification
Royalty income diversification from oil & gas and coal provides Alliance Resource Partners commodity-levered cash flow that can buffer mining cyclicality while introducing its own price and activity volatility.
Basin productivity and regional drilling activity directly drive royalty receipts, making geographic and commodity mix critical to near-term cash swings.
A balanced royalty portfolio improves free-cash coverage and capex flexibility by smoothing coal revenue troughs, but exposure to hydrocarbon cycles increases forecasting uncertainty.

Inflation and cost structure
Diesel, explosives, labor and parts pushed ARLP unit costs higher, with U.S. diesel averaging about 3.90 USD/gal in 2024 (EIA) and labor costs rising roughly 4% year-over-year (BLS), while productivity gains and contract escalators helped offset margin pressure; supply-chain tightness can lengthen downtime and elevate repair costs, but disciplined cost control preserved cash margins through 2024–25.
- Diesel ~3.90 USD/gal (2024, EIA)
- Labor ~4% wage growth (2024, BLS)
- Contract escalators & productivity partly offset
- Supply-chain delays increase downtime risk
Interest rates and capital access
Higher policy rates (Fed funds 5.25–5.50% in mid‑2025; 10‑yr Treasury ~4.1%) raise ARLP’s borrowing costs and push up corporate hurdle rates, making new coal/mining investments tougher while boosting the appeal of cash-generative assets. Midstream and mining investors increasingly favor strong free cash flow; ARLP’s distributions must compete with higher bond and dividend yields elsewhere. ARLP’s stronger balance sheet supports buybacks and optionality for growth even as capital costs rise.
IRA ~$369B, carbon $13-$35/t, rail risk, LNG switching
Coal supplied ~19% of US power in 2023 with US production ~494M st; ARLP revenue mixes multi‑year contracts and spot exposure, so spot spikes help but are fleeting. Henry Hub mostly <3.00/MMBtu in 2024–H1 2025 reduced coal burn; diesel ~3.90/gal (2024) and labor +4% raised unit costs. Higher rates (Fed 5.25–5.50%, 10yr ~4.1%) lift capital costs and favor cash-generative assets.
| Metric | Value |
|---|---|
| Coal share (2023) | 19% |
| US production (2023) | ~494M st |
| Henry Hub (2024–H1 2025) | <3.00/MMBtu |
| Diesel (2024) | $3.90/gal |
| Fed funds (mid‑2025) | 5.25–5.50% |
What You See Is What You Get
Alliance Resource Partners PESTLE Analysis
The Alliance Resource Partners PESTLE Analysis preview shown here is the exact document you’ll receive after purchase—fully formatted and ready to use. It contains the full political, economic, social, technological, legal, and environmental assessment as displayed. No placeholders or teasers; this is the final, downloadable file.

Original: $10.00
-65%$10.00
$3.50Product Information
Product Information
Shipping & Returns
Shipping & Returns
Description
Make Smarter Strategic Decisions with a Complete PESTEL View
Unlock strategic clarity with our PESTLE Analysis of Alliance Resource Partners—three to five critical factors explained to reveal regulatory, economic, and environmental pressures shaping coal logistics and production. Turn these insights into competitive moves; purchase the full report for the complete, actionable breakdown.
Political factors
U.S. energy policy shifts
Federal and state priorities—driven by the Inflation Reduction Act's roughly $369 billion clean‑energy incentives and EIA data showing coal fell to about 19% of US generation in 2023—can accelerate retirements or prompt baseload support that affects Alliance Resource Partners’ volume risk. Tightening pro‑renewable mandates would reduce coal demand, while NERC/DOE reliability warnings in 2024 could delay closures. Monitoring policy cycles is critical for ARLP’s contracting strategy.
Permitting and approvals
State and federal permits govern mines, expansions and infrastructure for Alliance Resource Partners (NYSE: ARLP), with federal NEPA environmental reviews commonly taking 3–5 years for complex projects.
Longer timelines raise project risk and capital costs, often delaying cash flows and adding financing expense to multi-year mine development schedules.
Streamlined approvals can unlock reserves and boost productivity, while local political sentiment and permitting opposition have materially influenced permit outcomes in Appalachian and Illinois Basin projects.
Power market design
RTO/ISO capacity rules materially shift coal plant economics and dispatch, directly impacting ARLP coal offtake as coal supplied ~19% of U.S. generation in 2023 (EIA). Policy moves toward resilience credits and state capacity adders have sustained some coal burn in markets (select state programs), while emissions penalties — e.g., RGGI ≈$13/ton and California ≈$35/ton in 2024 — reduce run-time. ARLP’s contract tenors (typical 5–15 years) must be structured to reflect evolving market rules and price risks.
Infrastructure and transport policy
Rail regulation and investment shape ARLP coal logistics: rail moves roughly 70% of U.S. coal ton‑miles, so congestion or underinvestment raises delivered costs and threatens reliability; bottlenecks have pushed spot rail rates and demurrage charges higher in recent years. Political support for eastern freight corridors and BIL-era rail grants improves ARLP access to power markets, while any rail labor disputes materially risk shipments.
- Rail share ~70% of coal ton‑miles
- Bottlenecks → higher delivered costs
- Freight corridor funding aids eastern reach
- Labor disputes = shipment risk
Geopolitics and fuel substitution
- Geopolitics: LNG shocks swing fuel mix
- Sanctions: widen commodity spreads
- Price impact: coal generation +17% (2022)
- Exports: ~13 Bcf/d U.S. LNG (2024) affect domestic prices
IRA ~$369B, carbon $13-$35/t, rail risk, LNG switching
Federal IRA incentives (~$369B) and state carbon prices (RGGI ≈$13/t, CA ≈$35/t in 2024) reduce coal demand and raise ARLP retirement risk; NERC/DOE reliability guidance can defer closures. Rail carries ~70% of coal ton‑miles—BIL grants improve access but labor disputes and congestion raise costs. LNG exports (~13 Bcf/d in 2024) and Henry Hub 2023 ≈3.08 USD/MMBtu drive fuel switching.
| Metric | Value |
|---|---|
| IRA incentives | ~369B USD |
| Carbon price (2024) | RGGI ~$13/t, CA ~$35/t |
| Rail share | ~70% coal ton‑miles |
| US LNG (2024) | ~13 Bcf/d |
What is included in the product
Detailed Word Document
Explores how macro-environmental factors across Political, Economic, Social, Technological, Environmental and Legal dimensions uniquely affect Alliance Resource Partners, with data-backed trends and region-specific regulatory context. Designed for executives and investors, it delivers forward-looking insights, scenario implications and clean, report-ready findings to identify risks, opportunities and funding-ready narratives.
Customizable Excel Spreadsheet
A concise, visually segmented PESTLE summary for Alliance Resource Partners that simplifies external risk assessment and market positioning, ideal for quick drops into presentations or strategy sessions. Easily editable and shareable so teams can add region- or business-specific notes and align rapidly during planning.
Economic factors
Coal price and demand cycles
Utility stockpiles, weather and generation mix drive coal pricing; coal supplied about 19% of US electricity in 2023 and US coal production was ~494 million short tons in 2023 (EIA). ARLP’s revenues hinge on multi-year contracts plus spot exposure, so spikes in spot prices can boost realizations but tend to be transient. Hedging, fixed-price sales and contract optionality are used to manage volatility and protect cash flow.
Natural gas competition
Gas-to-coal switching is highly price sensitive: Henry Hub traded mostly below 3.00/MMBtu in 2024–H1 2025, suppressing coal burn and curtailing ARLP orders. When gas rallies above roughly 4.00/MMBtu, coal dispatch economically recovers and supports higher coal volumes. ARLP’s basin mix must align with regional spark and dark spreads to capture value across PJM, MISO and ERCOT markets.
Royalty income diversification
Royalty income diversification from oil & gas and coal provides Alliance Resource Partners commodity-levered cash flow that can buffer mining cyclicality while introducing its own price and activity volatility.
Basin productivity and regional drilling activity directly drive royalty receipts, making geographic and commodity mix critical to near-term cash swings.
A balanced royalty portfolio improves free-cash coverage and capex flexibility by smoothing coal revenue troughs, but exposure to hydrocarbon cycles increases forecasting uncertainty.
Inflation and cost structure
Diesel, explosives, labor and parts pushed ARLP unit costs higher, with U.S. diesel averaging about 3.90 USD/gal in 2024 (EIA) and labor costs rising roughly 4% year-over-year (BLS), while productivity gains and contract escalators helped offset margin pressure; supply-chain tightness can lengthen downtime and elevate repair costs, but disciplined cost control preserved cash margins through 2024–25.
- Diesel ~3.90 USD/gal (2024, EIA)
- Labor ~4% wage growth (2024, BLS)
- Contract escalators & productivity partly offset
- Supply-chain delays increase downtime risk
Interest rates and capital access
Higher policy rates (Fed funds 5.25–5.50% in mid‑2025; 10‑yr Treasury ~4.1%) raise ARLP’s borrowing costs and push up corporate hurdle rates, making new coal/mining investments tougher while boosting the appeal of cash-generative assets. Midstream and mining investors increasingly favor strong free cash flow; ARLP’s distributions must compete with higher bond and dividend yields elsewhere. ARLP’s stronger balance sheet supports buybacks and optionality for growth even as capital costs rise.
IRA ~$369B, carbon $13-$35/t, rail risk, LNG switching
Coal supplied ~19% of US power in 2023 with US production ~494M st; ARLP revenue mixes multi‑year contracts and spot exposure, so spot spikes help but are fleeting. Henry Hub mostly <3.00/MMBtu in 2024–H1 2025 reduced coal burn; diesel ~3.90/gal (2024) and labor +4% raised unit costs. Higher rates (Fed 5.25–5.50%, 10yr ~4.1%) lift capital costs and favor cash-generative assets.
| Metric | Value |
|---|---|
| Coal share (2023) | 19% |
| US production (2023) | ~494M st |
| Henry Hub (2024–H1 2025) | <3.00/MMBtu |
| Diesel (2024) | $3.90/gal |
| Fed funds (mid‑2025) | 5.25–5.50% |
What You See Is What You Get
Alliance Resource Partners PESTLE Analysis
The Alliance Resource Partners PESTLE Analysis preview shown here is the exact document you’ll receive after purchase—fully formatted and ready to use. It contains the full political, economic, social, technological, legal, and environmental assessment as displayed. No placeholders or teasers; this is the final, downloadable file.











