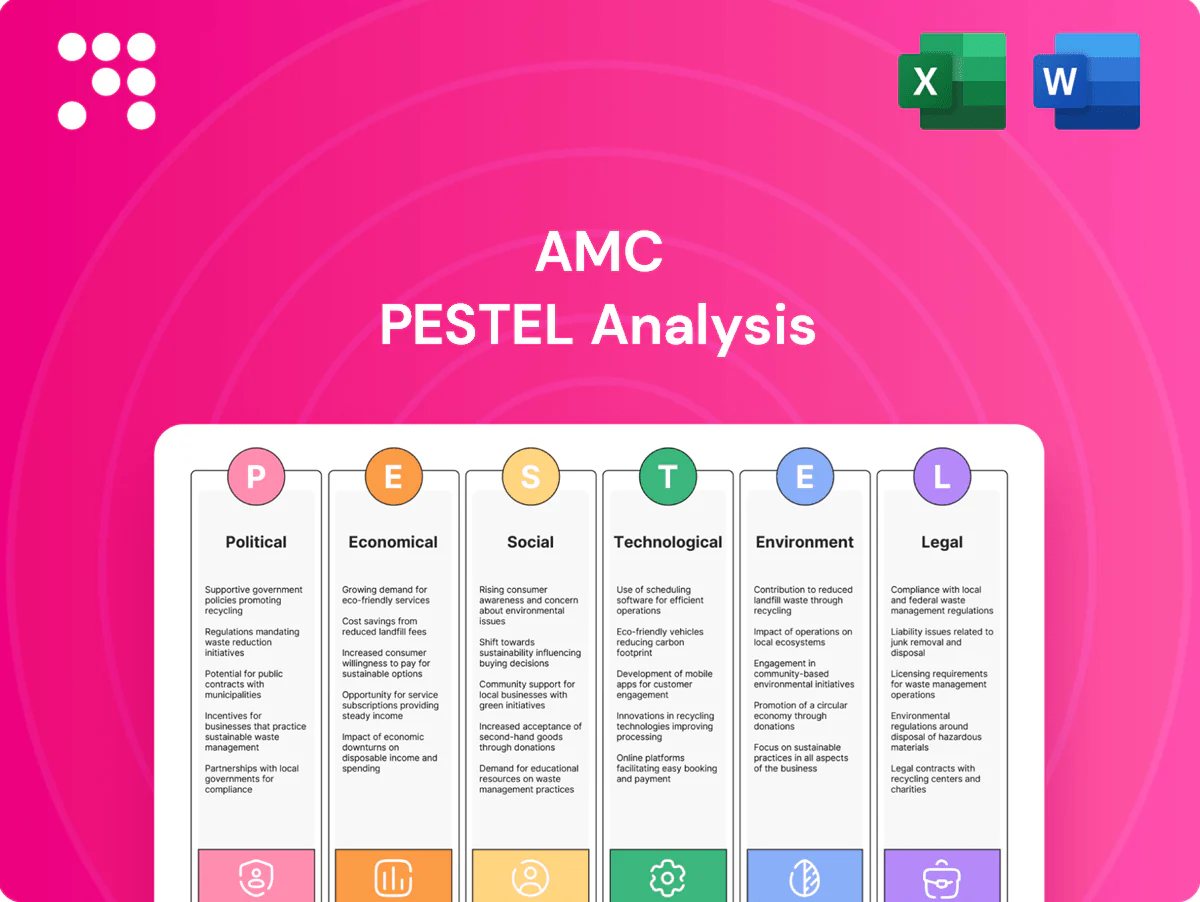
AMC PESTLE Analysis

Make Smarter Strategic Decisions with a Complete PESTEL View
Unlock strategic insight with our AMC PESTLE Analysis—three-pronged view of political, economic, and technological forces shaping the chain. You'll get concise, actionable findings to inform investment and competitive strategy. Buy the full report for the complete, downloadable breakdown and ready-to-use charts.
Political factors

Film content regulation
Government censorship boards and rating systems shape what AMC can exhibit and market internationally; the global box office was about $26.9 billion in 2023, with China contributing roughly 30% of ticket sales, amplifying the impact of Beijing’s content rules. Shifts in cultural policy can restrict showtimes or marketing windows, reducing revenue cadence. Political pressure on violent or sensitive content has led to edits or delayed international releases, altering timing and mix at the box office.
Public health mandates
Policy responses to pandemics drove capacity limits, mask rules and temporary closures, causing US box office to fall about 80% in 2020 versus 2019 and forcing theater chains to cut schedules. Compliance costs and demand volatility spiked with new mandates, raising operational expenses and unpredictable revenue swings. Vaccine or health-pass requirements altered attendance patterns; recovery trajectories vary by jurisdiction, complicating scheduling and staffing.

Labor and wage policy
Minimum wage hikes and scheduling laws raise AMC's operating costs as many US states and cities now set minimums well above the $7.25 federal floor, with the average state minimum near $11 in 2024 and several localities at or above $15–16, increasing hourly payroll and labor scheduling constraints. Unionization momentum and 2024–25 organizing pushes in hospitality and retail threaten labor flexibility and could drive standardized staffing models. Overtime and benefits rules differ across US states and EU markets, where statutory minimums range widely (roughly €3–€12+ per hour), complicating cross‑border staffing costs. Political pressure for living wages is pushing concession and usher roles toward higher base pay and predictable schedules, increasing per‑patron labor cost assumptions for forecasting.

Trade and tariffs
US tariffs from Section 301, which have reached up to 25% on many Chinese imports, elevate capex for projection gear, screens and concessions equipment; past container spikes (Shanghai–LA ~17,000 USD/FEU in 2021) show how cross-border frictions delay tech upgrades. Dollar strength (DXY peak ~114 in 2022, ~104 in 2024) raises costs for overseas sourcing, while USMCA and other agreements can cut tariffs on replacement parts and seats.
- Tariffs: up to 25% (Section 301)
- Freight peak: ~$17,000/FEU (2021)
- DXY: ~114 (2022 peak), ~104 (2024)
- Trade deals: USMCA reduces regional parts tariffs
Urban and safety policy
China censorship, pandemic shocks and rising wages/tariffs squeeze global box office
Government content rules (China ~30% of 2023 global box office) and censorship affect release timing and revenue mix. Pandemic-era mandates cut US box office ~80% in 2020 and continue to add operational volatility. Rising minimum wages (~$11 state avg 2024; many locales $15–16) and tariffs (Section 301 up to 25%) raise running and capex costs.
| Factor | Impact | Key data |
|---|---|---|
| Content regulation | Release edits/delays | China ~30% box office (2023) |
| Health policy | Demand volatility | US box office -80% (2020) |
| Labor & tariffs | Higher Opex/Capex | State min wage ~$11 (2024); tariffs up to 25% |
What is included in the product
 Detailed Word Document
Explores how external macro-environmental factors uniquely affect AMC across six dimensions—Political, Economic, Social, Technological, Environmental, and Legal—with data-backed, region- and industry-specific analysis that includes forward-looking insights and actionable sub-points to help executives, investors, and entrepreneurs identify threats, opportunities, and strategic responses.

 Customizable Excel Spreadsheet
A concise, visually segmented PESTLE summary for AMC that can be dropped into presentations, edited with region- or business-specific notes, and easily shared across teams to streamline external-risk discussions and strategic planning.
Economic factors

Consumer spending cycle
Discretionary income swings directly drive ticket and concessions demand; US box office historically fell about 20% in the 2008–09 recession, illustrating sensitivity of visits. Recessions cut visit frequency and premium format uptake, with PLF/recliner upgrades depending on consumer confidence. BLS data showed average hourly earnings rising roughly 4% YoY in 2024, supporting pricing power for recliner/PLF offerings. Elasticities differ by income: suburban markets show higher car-driven frequency than dense urban cores.
Inflation and costs
Rising input costs for labor, utilities and food are squeezing AMC margins amid US inflation of 3.4% in 2024, forcing fare and concession price actions that risk box-office traffic. HVAC-heavy theaters are vulnerable to energy volatility after recent electricity and natural gas price swings, driving outsized operating expense growth. Supplier renegotiations and SKU optimization have become critical levers to preserve per-screen profitability.

Interest rates and debt
With the federal funds rate near 5.25–5.50% in mid-2025, higher rates elevate AMC’s refinancing and lease-financing costs and pressure its multi-billion-dollar debt burden. Balance-sheet flexibility drives remodel cadence and new-format rollouts, while restrictive debt covenants can limit capex during weak box-office quarters. Conversely, lower rates would enable opportunistic upgrades and footprint optimization.

Film slate volatility
The 2023 WGA (May–Sept 2023) and SAG‑AFTRA (July–Nov 2023) strikes shifted major release calendars into 2024–25, altering seasonality and concentrating revenue into fewer windows; blockbuster scarcity has depressed attendance while tentpole clusters strain screens and showtimes. Alternative content (live events, limited-run exclusives) has partially smoothed gaps, while AMC outcomes remain tightly linked to studio marketing spend, which for major tentpoles often exceeds 100 million dollars.
- Release shifts: strikes moved slate into 2024–25
- Attendance: fewer blockbusters = lower footfall
- Capacity: tentpole clustering increases screen competition
- Alternatives: live/special events reduce volatility
- Marketing reliance: studios often spend >100m on tentpoles
FX and international mix
Euro and sterling moves (EUR/USD ~1.09, GBP/USD ~1.27 in mid‑2025) materially translate into reported USD results, compressing or inflating margins as local pricing power varies by market; stronger local currency markets sustain margin, weaker ones force price rises or margin erosion. Hedging programs (typical corporate cover 60–80%) and transfer pricing policies materially shape reported performance, while regional economic divergence complicates scheduling and staffing across operations.
- FX rates: EUR/USD 1.09, GBP/USD 1.27 (mid‑2025)
- Hedging coverage ~60–80% impacts USD translation
- Local pricing power drives margin variance by market
- Regional economic divergence raises staffing/scheduling costs
China censorship, pandemic shocks and rising wages/tariffs squeeze global box office
Discretionary income vs demand: 4% avg hourly wage growth (2024) supports pricing but historical box‑office fell ~20% in 2008–09, showing elasticity. Cost pressure: 2024 inflation 3.4% plus energy/labor/food squeeze margins. Capital/FX: fed funds ~5.25–5.50% (mid‑2025) raises refinancing costs; EUR/USD 1.09, GBP/USD 1.27 affect reported results.
| Metric | Value |
|---|---|
| Wage YoY (2024) | ~4% |
| Inflation (2024) | 3.4% |
| Fed funds (mid‑2025) | 5.25–5.50% |
| EUR/USD (mid‑2025) | 1.09 |
| GBP/USD (mid‑2025) | 1.27 |
| Historic box‑office shock | -20% (2008–09) |
Preview Before You Purchase
AMC PESTLE Analysis
This preview of the AMC PESTLE Analysis is the exact, fully formatted document you’ll receive after purchase—professionally structured and ready to use. The layout, content, and insights shown here match the downloadable file you’ll get at checkout. No placeholders or teasers—this is the final product.

Original: $10.00
-65%$10.00
$3.50Product Information
Product Information
Shipping & Returns
Shipping & Returns
Description
Make Smarter Strategic Decisions with a Complete PESTEL View
Unlock strategic insight with our AMC PESTLE Analysis—three-pronged view of political, economic, and technological forces shaping the chain. You'll get concise, actionable findings to inform investment and competitive strategy. Buy the full report for the complete, downloadable breakdown and ready-to-use charts.
Political factors
Film content regulation
Government censorship boards and rating systems shape what AMC can exhibit and market internationally; the global box office was about $26.9 billion in 2023, with China contributing roughly 30% of ticket sales, amplifying the impact of Beijing’s content rules. Shifts in cultural policy can restrict showtimes or marketing windows, reducing revenue cadence. Political pressure on violent or sensitive content has led to edits or delayed international releases, altering timing and mix at the box office.
Public health mandates
Policy responses to pandemics drove capacity limits, mask rules and temporary closures, causing US box office to fall about 80% in 2020 versus 2019 and forcing theater chains to cut schedules. Compliance costs and demand volatility spiked with new mandates, raising operational expenses and unpredictable revenue swings. Vaccine or health-pass requirements altered attendance patterns; recovery trajectories vary by jurisdiction, complicating scheduling and staffing.
Labor and wage policy
Minimum wage hikes and scheduling laws raise AMC's operating costs as many US states and cities now set minimums well above the $7.25 federal floor, with the average state minimum near $11 in 2024 and several localities at or above $15–16, increasing hourly payroll and labor scheduling constraints. Unionization momentum and 2024–25 organizing pushes in hospitality and retail threaten labor flexibility and could drive standardized staffing models. Overtime and benefits rules differ across US states and EU markets, where statutory minimums range widely (roughly €3–€12+ per hour), complicating cross‑border staffing costs. Political pressure for living wages is pushing concession and usher roles toward higher base pay and predictable schedules, increasing per‑patron labor cost assumptions for forecasting.
Trade and tariffs
US tariffs from Section 301, which have reached up to 25% on many Chinese imports, elevate capex for projection gear, screens and concessions equipment; past container spikes (Shanghai–LA ~17,000 USD/FEU in 2021) show how cross-border frictions delay tech upgrades. Dollar strength (DXY peak ~114 in 2022, ~104 in 2024) raises costs for overseas sourcing, while USMCA and other agreements can cut tariffs on replacement parts and seats.
- Tariffs: up to 25% (Section 301)
- Freight peak: ~$17,000/FEU (2021)
- DXY: ~114 (2022 peak), ~104 (2024)
- Trade deals: USMCA reduces regional parts tariffs
Urban and safety policy
China censorship, pandemic shocks and rising wages/tariffs squeeze global box office
Government content rules (China ~30% of 2023 global box office) and censorship affect release timing and revenue mix. Pandemic-era mandates cut US box office ~80% in 2020 and continue to add operational volatility. Rising minimum wages (~$11 state avg 2024; many locales $15–16) and tariffs (Section 301 up to 25%) raise running and capex costs.
| Factor | Impact | Key data |
|---|---|---|
| Content regulation | Release edits/delays | China ~30% box office (2023) |
| Health policy | Demand volatility | US box office -80% (2020) |
| Labor & tariffs | Higher Opex/Capex | State min wage ~$11 (2024); tariffs up to 25% |
What is included in the product
Detailed Word Document
Explores how external macro-environmental factors uniquely affect AMC across six dimensions—Political, Economic, Social, Technological, Environmental, and Legal—with data-backed, region- and industry-specific analysis that includes forward-looking insights and actionable sub-points to help executives, investors, and entrepreneurs identify threats, opportunities, and strategic responses.
Customizable Excel Spreadsheet
A concise, visually segmented PESTLE summary for AMC that can be dropped into presentations, edited with region- or business-specific notes, and easily shared across teams to streamline external-risk discussions and strategic planning.
Economic factors
Consumer spending cycle
Discretionary income swings directly drive ticket and concessions demand; US box office historically fell about 20% in the 2008–09 recession, illustrating sensitivity of visits. Recessions cut visit frequency and premium format uptake, with PLF/recliner upgrades depending on consumer confidence. BLS data showed average hourly earnings rising roughly 4% YoY in 2024, supporting pricing power for recliner/PLF offerings. Elasticities differ by income: suburban markets show higher car-driven frequency than dense urban cores.
Inflation and costs
Rising input costs for labor, utilities and food are squeezing AMC margins amid US inflation of 3.4% in 2024, forcing fare and concession price actions that risk box-office traffic. HVAC-heavy theaters are vulnerable to energy volatility after recent electricity and natural gas price swings, driving outsized operating expense growth. Supplier renegotiations and SKU optimization have become critical levers to preserve per-screen profitability.
Interest rates and debt
With the federal funds rate near 5.25–5.50% in mid-2025, higher rates elevate AMC’s refinancing and lease-financing costs and pressure its multi-billion-dollar debt burden. Balance-sheet flexibility drives remodel cadence and new-format rollouts, while restrictive debt covenants can limit capex during weak box-office quarters. Conversely, lower rates would enable opportunistic upgrades and footprint optimization.
Film slate volatility
The 2023 WGA (May–Sept 2023) and SAG‑AFTRA (July–Nov 2023) strikes shifted major release calendars into 2024–25, altering seasonality and concentrating revenue into fewer windows; blockbuster scarcity has depressed attendance while tentpole clusters strain screens and showtimes. Alternative content (live events, limited-run exclusives) has partially smoothed gaps, while AMC outcomes remain tightly linked to studio marketing spend, which for major tentpoles often exceeds 100 million dollars.
- Release shifts: strikes moved slate into 2024–25
- Attendance: fewer blockbusters = lower footfall
- Capacity: tentpole clustering increases screen competition
- Alternatives: live/special events reduce volatility
- Marketing reliance: studios often spend >100m on tentpoles
FX and international mix
Euro and sterling moves (EUR/USD ~1.09, GBP/USD ~1.27 in mid‑2025) materially translate into reported USD results, compressing or inflating margins as local pricing power varies by market; stronger local currency markets sustain margin, weaker ones force price rises or margin erosion. Hedging programs (typical corporate cover 60–80%) and transfer pricing policies materially shape reported performance, while regional economic divergence complicates scheduling and staffing across operations.
- FX rates: EUR/USD 1.09, GBP/USD 1.27 (mid‑2025)
- Hedging coverage ~60–80% impacts USD translation
- Local pricing power drives margin variance by market
- Regional economic divergence raises staffing/scheduling costs
China censorship, pandemic shocks and rising wages/tariffs squeeze global box office
Discretionary income vs demand: 4% avg hourly wage growth (2024) supports pricing but historical box‑office fell ~20% in 2008–09, showing elasticity. Cost pressure: 2024 inflation 3.4% plus energy/labor/food squeeze margins. Capital/FX: fed funds ~5.25–5.50% (mid‑2025) raises refinancing costs; EUR/USD 1.09, GBP/USD 1.27 affect reported results.
| Metric | Value |
|---|---|
| Wage YoY (2024) | ~4% |
| Inflation (2024) | 3.4% |
| Fed funds (mid‑2025) | 5.25–5.50% |
| EUR/USD (mid‑2025) | 1.09 |
| GBP/USD (mid‑2025) | 1.27 |
| Historic box‑office shock | -20% (2008–09) |
Preview Before You Purchase
AMC PESTLE Analysis
This preview of the AMC PESTLE Analysis is the exact, fully formatted document you’ll receive after purchase—professionally structured and ready to use. The layout, content, and insights shown here match the downloadable file you’ll get at checkout. No placeholders or teasers—this is the final product.











