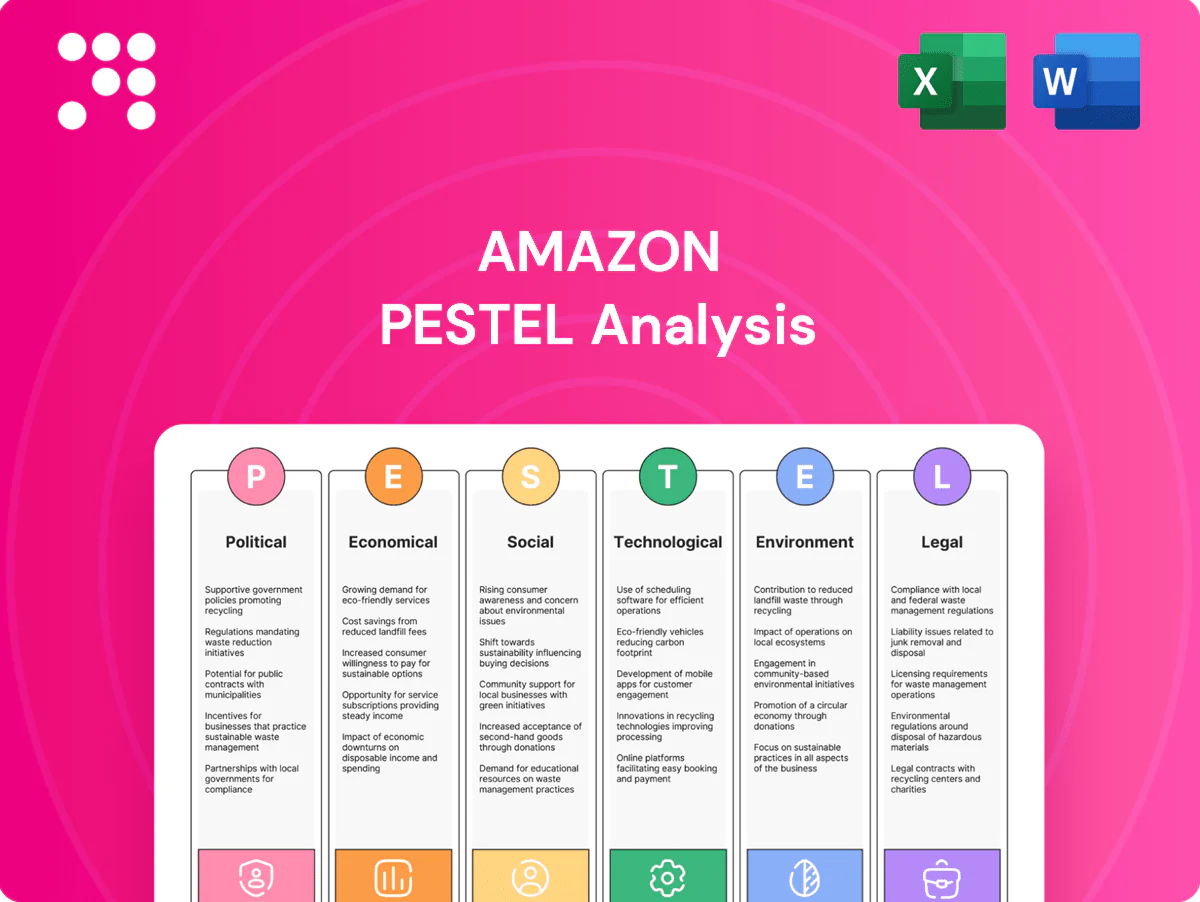
Amazon PESTLE Analysis

Your Competitive Advantage Starts with This Report
Discover how regulatory shifts, market dynamics, and tech innovation are reshaping Amazon’s strategic path in our concise PESTLE snapshot—ideal for investors and strategists seeking quick, actionable context. Dive deeper with the full PESTLE to uncover risks, opportunities, and data-driven recommendations tailored to Amazon’s future. Purchase now to get the complete, editable analysis instantly.
Political factors

Geopolitics & trade policy
Trade tensions, persistent US Section 301 tariffs and expanded US export controls on advanced semiconductors (2022–2024) can choke cross-border e-commerce, device component flows and AWS hardware procurement. Market access in China, the EU and India hinges on diplomatic ties and local industrial policy that shape tariffs, data localization and procurement rules. Sudden sanctions or licensing changes disrupt seller ecosystems and logistics lanes, forcing Amazon to diversify suppliers and keep trade-compliance agility.
Data sovereignty & localization
Governments increasingly require local data storage and processing, forcing AWS to expand region footprint—AWS operated 31 geographic regions and 99 availability zones—raising capital and operational costs. Compliance shapes latency and security architecture, affecting customer adoption in finance, health and government sectors where local rules drive procurement. Divergent national laws complicate global standardization, making jurisdiction-specific offerings a competitive necessity.

Public sector cloud demand
Government digitalization drives sizable cloud procurement as the public cloud market exceeded $600 billion in 2023, opening large opportunities and certification demand for providers like AWS. Political preferences and security clearances (FedRAMP, EU equivalents) heavily sway vendor choice. Budget cycles and procurement rules often lengthen sales timelines to 12–24 months but create resilient, multi-year contracts. Success depends on trust, compliance, and local partnerships.

Industrial policy & subsidies
Industrial policy and subsidies—notably the US Inflation Reduction Act offering up to 30% clean-energy tax credits—can cut Amazon’s data-center and manufacturing capex and speed renewable builds; shifts toward local-content rules or reallocated incentives can raise costs or change siting. Competing grants force community and jobs commitments, while policy stability is critical for multi-decade infrastructure planning under Amazon’s 100% renewable-by-2025 and net-zero-by-2040 targets.
- IRA: up to 30% clean-energy tax credits
- Amazon targets: 100% renewable by 2025; net-zero by 2040
- Grants: require local jobs/community impact
- Policy shifts/local content risk capex & siting
Political scrutiny of platform power
Regulatory pressure is reshaping Amazon's marketplace and ad practices as the EU Digital Markets Act (effective 7 March 2024) and ongoing US congressional inquiries push for fairer platform rules and algorithm transparency; Amazon's advertising business generated about 40.4 billion USD in 2023, raising stakes for policymakers. Committees demand clearer treatment of third-party sellers and algorithmic fairness, and political narratives affect consumer trust and regulator posture, so proactive engagement can reduce risks of restrictive remedies.
- DMA effective 07-03-2024
- Amazon ad revenue 2023: 40.4B USD
- Congressional/antitrust inquiries ongoing
- Proactive engagement mitigates regulatory risk
Trade tensions, data rules and ad scrutiny raise cloud capex, force supplier shifts
Trade tensions, US tariffs and export controls (2022–24) threaten cross-border e-commerce and supply chains, forcing supplier diversification. Data localization increases AWS capex—31 regions, 99 AZs—raising costs and slowing deployment. Regulation (DMA 07-03-2024), antitrust probes and ad scrutiny endanger Amazon Ads (40.4B USD 2023) and marketplace rules.
| Metric | Value |
|---|---|
| AWS footprint | 31 regions / 99 AZs |
| Ad revenue 2023 | 40.4B USD |
| Public cloud 2023 | >600B USD |
| DMA effective | 07-03-2024 |
| IRA credit | up to 30% |
| Targets | 100% renewable by 2025; net-zero by 2040 |
What is included in the product
 Detailed Word Document
Explores how macro-environmental factors uniquely affect Amazon across Political, Economic, Social, Technological, Environmental and Legal dimensions, with data-driven trends and region-specific regulatory context. Designed for executives and investors, it delivers clean, forward-looking insights and detailed sub-points to inform strategy, scenario planning and funding decisions.

 Customizable Excel Spreadsheet
Visually segmented by PESTLE categories, this Amazon analysis condenses regulatory, economic, technological and environmental risks into a one-page reference, enabling rapid interpretation and faster decision-making during meetings or strategy sessions.
Economic factors

Consumer spending cycles
Consumer spending cycles shape Amazon GMV and Prime retention: with over 200 million Prime members and 2023 net sales of about $562 billion, disposable income and confidence directly affect purchase frequency. Inflation around 3.4% in 2024 and recession risks shift baskets toward value and private labels. Seasonal peaks like Prime Day (Adobe estimated $12.7B in 2023) force flexible capacity and working capital, while elastic pricing and promotions smooth demand volatility.
Enterprise IT budgets
Macro conditions push customers into optimization or expansion cycles: cost-cutting in 2023–24 led many enterprises to delay cloud migrations or renegotiate contracts, while counter-cyclical demand for efficiency boosted AWS managed services and cost-optimization offerings. AWS generated roughly 13% of Amazon net sales but about 60% of operating income in 2023, and multi-year commitments continue to stabilize revenue visibility for the business.

Currency & interest rates
FX swings materially affect reported revenue and imported costs for Amazon, which posted $514 billion in net sales in 2023, shifting reported growth by percentage points across regions. Higher interest rates—policy rates near 5% in 2024—raise capital costs for data centers and logistics investments. Sellers’ financing and consumer credit availability influence marketplace activity. Hedging strategies and regional pricing help buffer currency and rate shocks.

Supply chain & freight costs
Global container spot rates plunged from peak >$10,000 per FEU in 2021 to roughly $2,000 per FEU by 2024, and Brent crude averaged about $85/bbl in 2024, both directly compressing fulfillment margins while port congestion (Los Angeles dwell times falling from double‑digit days in 2021 to ~3 days by 2024) alters throughput timing.
Nearshoring and multi‑node inventory reduce transpacific exposure but raise inventory carrying and systems complexity; Amazon’s increased automation (millions in warehouse robotics deployments) helps offset labor inflation and improves unit labor costs.
Real‑time logistics data and predictive allocation cut stockouts and expedite routing, improving fulfillment efficiency and margin capture across peak seasons.
- Global rates: ~2,000 per FEU (2024)
- Brent crude: ~85 per barrel (2024)
- LA dwell time: ~3 days (2024)
- Mitigants: nearshoring, multi‑node, automation, real‑time logistics
Advertising and media spend
Advertising budgets track business cycles, directly shaping Amazon Ads growth as clients expand spend in booms and cut back in downturns; performance channels such as Sponsored Products and DSP often gain share in recessions due to clear ROI. Streaming monetization for Prime Video depends on subscriber propensity to pay versus ad tolerance, which influences CPMs. Amazon's diversified ad formats—search, display, video, OTT—cushion category-specific weakness.
- Ad budgets follow macro cycles
- Performance channels gain share in downturns
- Streaming yield tied to subscriber pay propensity
- Diverse formats mitigate category risk
Trade tensions, data rules and ad scrutiny raise cloud capex, force supplier shifts
Economic factors reshape Amazon via consumer spending, inflation (≈3.4% in 2024) and ~200M Prime members driving GMV and promo elasticity; AWS (≈60% of operating income in 2023) buffers retail cyclicality as enterprises shift cloud spend. FX and ~5% policy rates raise capital costs; logistics costs eased with container rates ≈$2,000/FEU and Brent ≈$85/bbl (2024), while nearshoring and automation raise inventory carry but cut labor expenses.
| Metric | Value | Year |
|---|---|---|
| Prime members | ~200M | 2024 |
| Net sales | $562B | 2023 |
| AWS op. income share | ~60% | 2023 |
| Inflation | ~3.4% | 2024 |
| Policy rate | ~5% | 2024 |
| Container spot | ~$2,000/FEU | 2024 |
| Brent | ~$85/bbl | 2024 |
Preview the Actual Deliverable
Amazon PESTLE Analysis
The preview shown here is the exact Amazon PESTLE Analysis you’ll receive after purchase—fully formatted, professionally structured, and ready to use. It covers Political, Economic, Social, Technological, Legal and Environmental factors with actionable insights. No placeholders or surprises; download the same final file immediately after checkout.

Original: $10.00
-65%$10.00
$3.50Product Information
Product Information
Shipping & Returns
Shipping & Returns
Description
Your Competitive Advantage Starts with This Report
Discover how regulatory shifts, market dynamics, and tech innovation are reshaping Amazon’s strategic path in our concise PESTLE snapshot—ideal for investors and strategists seeking quick, actionable context. Dive deeper with the full PESTLE to uncover risks, opportunities, and data-driven recommendations tailored to Amazon’s future. Purchase now to get the complete, editable analysis instantly.
Political factors
Geopolitics & trade policy
Trade tensions, persistent US Section 301 tariffs and expanded US export controls on advanced semiconductors (2022–2024) can choke cross-border e-commerce, device component flows and AWS hardware procurement. Market access in China, the EU and India hinges on diplomatic ties and local industrial policy that shape tariffs, data localization and procurement rules. Sudden sanctions or licensing changes disrupt seller ecosystems and logistics lanes, forcing Amazon to diversify suppliers and keep trade-compliance agility.
Data sovereignty & localization
Governments increasingly require local data storage and processing, forcing AWS to expand region footprint—AWS operated 31 geographic regions and 99 availability zones—raising capital and operational costs. Compliance shapes latency and security architecture, affecting customer adoption in finance, health and government sectors where local rules drive procurement. Divergent national laws complicate global standardization, making jurisdiction-specific offerings a competitive necessity.
Public sector cloud demand
Government digitalization drives sizable cloud procurement as the public cloud market exceeded $600 billion in 2023, opening large opportunities and certification demand for providers like AWS. Political preferences and security clearances (FedRAMP, EU equivalents) heavily sway vendor choice. Budget cycles and procurement rules often lengthen sales timelines to 12–24 months but create resilient, multi-year contracts. Success depends on trust, compliance, and local partnerships.
Industrial policy & subsidies
Industrial policy and subsidies—notably the US Inflation Reduction Act offering up to 30% clean-energy tax credits—can cut Amazon’s data-center and manufacturing capex and speed renewable builds; shifts toward local-content rules or reallocated incentives can raise costs or change siting. Competing grants force community and jobs commitments, while policy stability is critical for multi-decade infrastructure planning under Amazon’s 100% renewable-by-2025 and net-zero-by-2040 targets.
- IRA: up to 30% clean-energy tax credits
- Amazon targets: 100% renewable by 2025; net-zero by 2040
- Grants: require local jobs/community impact
- Policy shifts/local content risk capex & siting
Political scrutiny of platform power
Regulatory pressure is reshaping Amazon's marketplace and ad practices as the EU Digital Markets Act (effective 7 March 2024) and ongoing US congressional inquiries push for fairer platform rules and algorithm transparency; Amazon's advertising business generated about 40.4 billion USD in 2023, raising stakes for policymakers. Committees demand clearer treatment of third-party sellers and algorithmic fairness, and political narratives affect consumer trust and regulator posture, so proactive engagement can reduce risks of restrictive remedies.
- DMA effective 07-03-2024
- Amazon ad revenue 2023: 40.4B USD
- Congressional/antitrust inquiries ongoing
- Proactive engagement mitigates regulatory risk
Trade tensions, data rules and ad scrutiny raise cloud capex, force supplier shifts
Trade tensions, US tariffs and export controls (2022–24) threaten cross-border e-commerce and supply chains, forcing supplier diversification. Data localization increases AWS capex—31 regions, 99 AZs—raising costs and slowing deployment. Regulation (DMA 07-03-2024), antitrust probes and ad scrutiny endanger Amazon Ads (40.4B USD 2023) and marketplace rules.
| Metric | Value |
|---|---|
| AWS footprint | 31 regions / 99 AZs |
| Ad revenue 2023 | 40.4B USD |
| Public cloud 2023 | >600B USD |
| DMA effective | 07-03-2024 |
| IRA credit | up to 30% |
| Targets | 100% renewable by 2025; net-zero by 2040 |
What is included in the product
Detailed Word Document
Explores how macro-environmental factors uniquely affect Amazon across Political, Economic, Social, Technological, Environmental and Legal dimensions, with data-driven trends and region-specific regulatory context. Designed for executives and investors, it delivers clean, forward-looking insights and detailed sub-points to inform strategy, scenario planning and funding decisions.
Customizable Excel Spreadsheet
Visually segmented by PESTLE categories, this Amazon analysis condenses regulatory, economic, technological and environmental risks into a one-page reference, enabling rapid interpretation and faster decision-making during meetings or strategy sessions.
Economic factors
Consumer spending cycles
Consumer spending cycles shape Amazon GMV and Prime retention: with over 200 million Prime members and 2023 net sales of about $562 billion, disposable income and confidence directly affect purchase frequency. Inflation around 3.4% in 2024 and recession risks shift baskets toward value and private labels. Seasonal peaks like Prime Day (Adobe estimated $12.7B in 2023) force flexible capacity and working capital, while elastic pricing and promotions smooth demand volatility.
Enterprise IT budgets
Macro conditions push customers into optimization or expansion cycles: cost-cutting in 2023–24 led many enterprises to delay cloud migrations or renegotiate contracts, while counter-cyclical demand for efficiency boosted AWS managed services and cost-optimization offerings. AWS generated roughly 13% of Amazon net sales but about 60% of operating income in 2023, and multi-year commitments continue to stabilize revenue visibility for the business.
Currency & interest rates
FX swings materially affect reported revenue and imported costs for Amazon, which posted $514 billion in net sales in 2023, shifting reported growth by percentage points across regions. Higher interest rates—policy rates near 5% in 2024—raise capital costs for data centers and logistics investments. Sellers’ financing and consumer credit availability influence marketplace activity. Hedging strategies and regional pricing help buffer currency and rate shocks.
Supply chain & freight costs
Global container spot rates plunged from peak >$10,000 per FEU in 2021 to roughly $2,000 per FEU by 2024, and Brent crude averaged about $85/bbl in 2024, both directly compressing fulfillment margins while port congestion (Los Angeles dwell times falling from double‑digit days in 2021 to ~3 days by 2024) alters throughput timing.
Nearshoring and multi‑node inventory reduce transpacific exposure but raise inventory carrying and systems complexity; Amazon’s increased automation (millions in warehouse robotics deployments) helps offset labor inflation and improves unit labor costs.
Real‑time logistics data and predictive allocation cut stockouts and expedite routing, improving fulfillment efficiency and margin capture across peak seasons.
- Global rates: ~2,000 per FEU (2024)
- Brent crude: ~85 per barrel (2024)
- LA dwell time: ~3 days (2024)
- Mitigants: nearshoring, multi‑node, automation, real‑time logistics
Advertising and media spend
Advertising budgets track business cycles, directly shaping Amazon Ads growth as clients expand spend in booms and cut back in downturns; performance channels such as Sponsored Products and DSP often gain share in recessions due to clear ROI. Streaming monetization for Prime Video depends on subscriber propensity to pay versus ad tolerance, which influences CPMs. Amazon's diversified ad formats—search, display, video, OTT—cushion category-specific weakness.
- Ad budgets follow macro cycles
- Performance channels gain share in downturns
- Streaming yield tied to subscriber pay propensity
- Diverse formats mitigate category risk
Trade tensions, data rules and ad scrutiny raise cloud capex, force supplier shifts
Economic factors reshape Amazon via consumer spending, inflation (≈3.4% in 2024) and ~200M Prime members driving GMV and promo elasticity; AWS (≈60% of operating income in 2023) buffers retail cyclicality as enterprises shift cloud spend. FX and ~5% policy rates raise capital costs; logistics costs eased with container rates ≈$2,000/FEU and Brent ≈$85/bbl (2024), while nearshoring and automation raise inventory carry but cut labor expenses.
| Metric | Value | Year |
|---|---|---|
| Prime members | ~200M | 2024 |
| Net sales | $562B | 2023 |
| AWS op. income share | ~60% | 2023 |
| Inflation | ~3.4% | 2024 |
| Policy rate | ~5% | 2024 |
| Container spot | ~$2,000/FEU | 2024 |
| Brent | ~$85/bbl | 2024 |
Preview the Actual Deliverable
Amazon PESTLE Analysis
The preview shown here is the exact Amazon PESTLE Analysis you’ll receive after purchase—fully formatted, professionally structured, and ready to use. It covers Political, Economic, Social, Technological, Legal and Environmental factors with actionable insights. No placeholders or surprises; download the same final file immediately after checkout.











