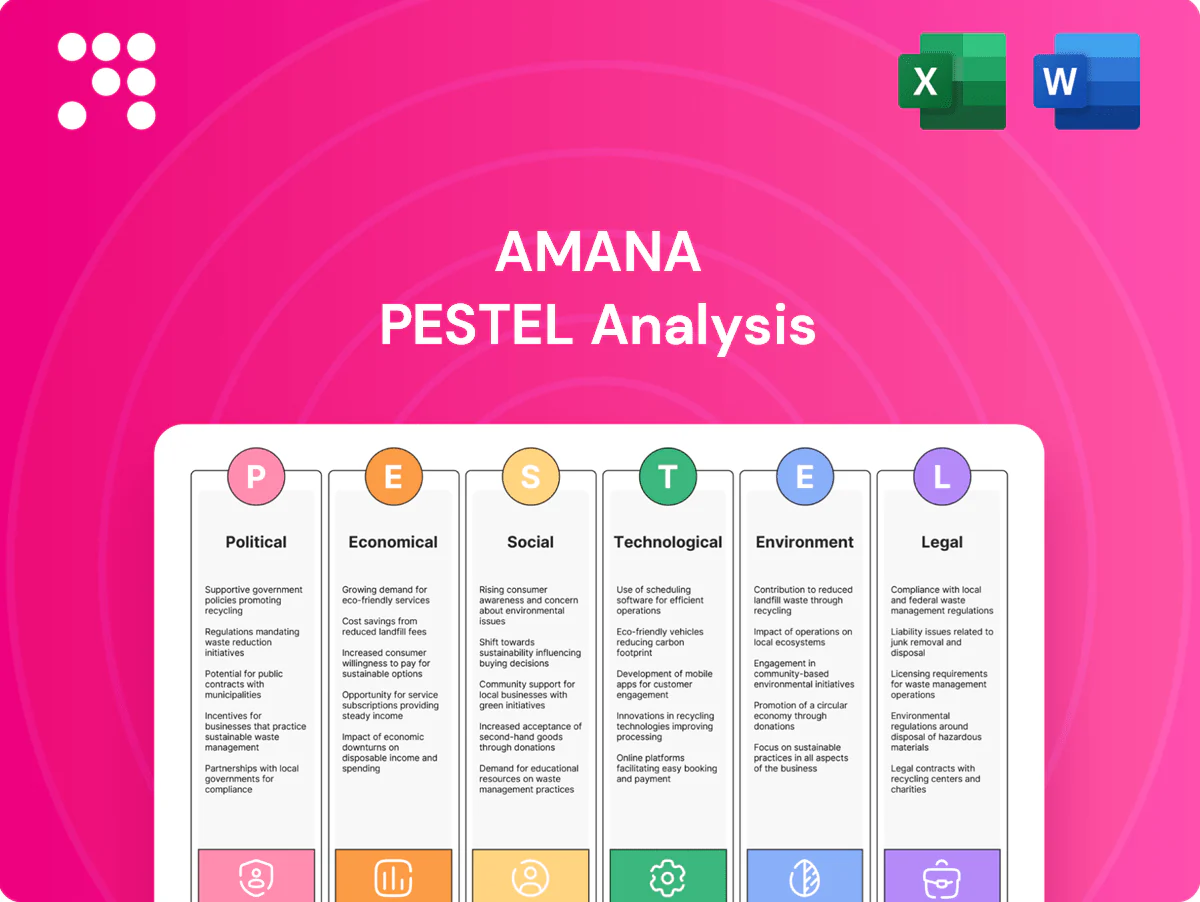
amana PESTLE Analysis

Plan Smarter. Present Sharper. Compete Stronger.
Gain a strategic advantage with our tailored PESTLE analysis of amana, revealing the political, economic, social, technological, legal, and environmental forces shaping its outlook. Ideal for investors and strategists, it distills complex trends into usable insights. Purchase the full report for the complete breakdown and actionable recommendations.
Political factors

Creative industry policies in Japan
Government support for creative industries in Japan reduces production costs via grants, tax incentives and public–private partnerships, notably through programs like the Cool Japan Fund (capital ~69 billion yen) and METI subsidies. Local content promotion often favors domestic providers in public procurement, boosting pipeline for local studios. Policy shifts can reallocate funding and affect visibility of projects. Monitoring METI and Agency for Cultural Affairs calls for proposals captures opportunities.
Trade relations and cross-border content licensing
Trade agreements dictate how easily visual assets are licensed across markets and how royalties flow, affecting cross-border IP contracts and enforcement. Tariffs are less material than IP and data-transfer provisions that define digital distribution and localization requirements. Geopolitical tensions can slow corporate marketing spend—global digital ad spend was about $600 billion in 2024—or complicate usage rights. Diversifying client geographies mitigates policy shocks.

Regulatory stance on media standards and censorship
Government norms on sensitive content, depictions and advertising—shaped by laws like GDPR with fines up to 4% of global turnover—directly constrain production and distribution. Stricter broadcast and platform codes reduce usable inventory and raise curation costs. Clear compliance workflows cut takedowns and reputational exposure. Local expertise tailors libraries to jurisdictional norms and mitigates enforcement risk.

Public sector procurement of visual services
- Market size tag: OECD ~12% of GDP
- Risk tag: long bid cycles → variable revenue
- Barrier tag: security, accessibility certifications required
- Opportunity tag: framework agreements = recurring revenue
Disaster preparedness and national resilience policies
Japan’s disaster risk — highlighted by the 2011 Tohoku quake and tsunami that caused about 210 billion USD in damage — drives strong policy emphasis on continuity planning, public information and the Basic Act on Disaster Management; vendors with resilient production, secure backups and rapid response meet government expectations and procurement preferences.
- National Resilience Program (launched 2013) compliance
- BCP certification as differentiator
- Emergency comms surge demand during disasters
Public funding 69bn yen & procurement ~12% GDP push resilient vendors; GDPR 4% alters revenue
Government support (Cool Japan Fund ~69bn yen; METI grants) and public procurement (OECD ~12% GDP) lower production costs and create pipelines, while trade and IP rules (GDPR fines up to 4% global turnover; 2024 global digital ad spend ≈ $600bn) shape licensing and revenue. Disaster policy after 2011 (~$210bn damage) boosts demand for resilient vendors; procurement cycles and certifications remain key barriers/opportunities.
| Tag | Stat | Impact |
|---|---|---|
| Support | 69bn yen | subsidies, lower costs |
| Procurement | OECD ~12% GDP | stable demand |
| Regulation | GDPR 4% fines | compliance cost |
What is included in the product
 Detailed Word Document
Explores how external macro-environmental factors uniquely affect amana across Political, Economic, Social, Technological, Environmental and Legal dimensions, with data‑backed trends and region‑specific regulatory context; designed to support executives, consultants and entrepreneurs with forward‑looking insights, scenario planning and deck‑ready findings to identify risks and opportunities.

 Customizable Excel Spreadsheet
Condensed PESTLE insights presented in clear categories for fast decision-making, easily dropped into presentations or shared across teams to align on external risks and strategic priorities.
Economic factors

Advertising and marketing spend cycles
Visual content demand tracks corporate ad budgets and global GDP, with IMF reporting ~3.0% real GDP growth in 2024; industry forecasts showed ad spend growing roughly 5–7% that year. Downturns push clients to lower‑cost stock/subscriptions, while expansions favor custom production. Sector mix (tech, retail, tourism) raises volatility. Flexible pricing and subscription tiers buffer cyclicality and preserve revenue during cuts.
Currency fluctuations (JPY vs. USD/EUR)
Yen depreciation (USD/JPY ~155 in mid-2025; EUR/JPY ~170) makes Japanese library assets cheaper for foreign buyers but raises costs for imported equipment and software, squeezing margins on capex. International revenues converted to JPY increase reported sales, improving top-line in 2024–25. Hedging programs and multi-currency pricing can reduce margin volatility. Indexing supplier contracts to FX stabilizes costs and cashflow.

Inflation and talent costs
Rising wages for creators, editors and technologists are squeezing project margins as wage growth outpaced inflation in recent years; US CPI peaked at 9.1% (June 2022) while the Employment Cost Index showed roughly 4.1% annual wage growth in 2023. Cost-plus or dynamic pricing can protect profitability by passing increased labor costs to clients. Automation and standardized workflows (RPA, templates) can cut delivery hours by 20–40% in pilots, offsetting labor inflation. Long-term vendor agreements lock in rates and reduce volatility, lowering procurement risk.

Subscription economy and pricing power
Clients increasingly prefer predictable subscription models for stock and DAM services; Statista forecasts subscription e-commerce to reach about 478 billion USD by 2025, reinforcing pricing power but raising expectations for predictable ARPU.
Competitive intensity compresses ARPU unless tiers, add-ons and usage-based features are differentiated; bundling production with asset management boosts LTV while churn management becomes a core KPI.
- ARPU pressure: differentiate via tiers/add‑ons
- Bundling: increases LTV
- Churn: primary KPI for retention
- Market size: ~478B USD by 2025 (Statista)
SME digitalization and enterprise transformation
Japan’s SMBs—which make up 99.7% of firms and employ roughly 70% of the workforce—are accelerating digitalization and enterprise content transformation, driving demand for scalable visuals and content ops as more businesses sell online. The need for localized, compliant, fast-turn assets rises with cross-border and platform sales; upselling workflow tools improves retention and agency partnerships expand distribution and services.
- SMB-share: 99.7% of firms
- Workforce: ~70% employed by SMEs
- Use-case: localized, compliant assets
- Strategy: workflow upsells + agency partnerships
Public funding 69bn yen & procurement ~12% GDP push resilient vendors; GDPR 4% alters revenue
Global demand tracks GDP (IMF ~3.0% real growth in 2024) and ad spend (+5–7% in 2024), creating cyclicality; flexible pricing, subscriptions and bundling protect revenue. USD/JPY ~155 (mid‑2025) makes exports attractive but raises imported capex costs; hedging and multi‑currency pricing reduce FX risk. Japan SMB digitalization (99.7% firms, ~70% workforce) drives scalable content demand.
| Metric | Value (2024/25) |
|---|---|
| Global GDP growth | ~3.0% (IMF 2024) |
| Ad spend growth | ~5–7% (2024) |
| USD/JPY | ~155 (mid‑2025) |
| Subscription market | ~$478B (2025, Statista) |
| Japan SMBs | 99.7% firms; ~70% workforce |
What You See Is What You Get
amana PESTLE Analysis
The preview shown is the exact amana PESTLE Analysis you’ll receive after purchase—fully formatted and ready to use. This screenshot reflects the real, final file with complete content and structure. No placeholders or teasers—download the same professional document immediately after checkout.

Original: $10.00
-65%$10.00
$3.50Product Information
Product Information
Shipping & Returns
Shipping & Returns
Description
Plan Smarter. Present Sharper. Compete Stronger.
Gain a strategic advantage with our tailored PESTLE analysis of amana, revealing the political, economic, social, technological, legal, and environmental forces shaping its outlook. Ideal for investors and strategists, it distills complex trends into usable insights. Purchase the full report for the complete breakdown and actionable recommendations.
Political factors
Creative industry policies in Japan
Government support for creative industries in Japan reduces production costs via grants, tax incentives and public–private partnerships, notably through programs like the Cool Japan Fund (capital ~69 billion yen) and METI subsidies. Local content promotion often favors domestic providers in public procurement, boosting pipeline for local studios. Policy shifts can reallocate funding and affect visibility of projects. Monitoring METI and Agency for Cultural Affairs calls for proposals captures opportunities.
Trade relations and cross-border content licensing
Trade agreements dictate how easily visual assets are licensed across markets and how royalties flow, affecting cross-border IP contracts and enforcement. Tariffs are less material than IP and data-transfer provisions that define digital distribution and localization requirements. Geopolitical tensions can slow corporate marketing spend—global digital ad spend was about $600 billion in 2024—or complicate usage rights. Diversifying client geographies mitigates policy shocks.
Regulatory stance on media standards and censorship
Government norms on sensitive content, depictions and advertising—shaped by laws like GDPR with fines up to 4% of global turnover—directly constrain production and distribution. Stricter broadcast and platform codes reduce usable inventory and raise curation costs. Clear compliance workflows cut takedowns and reputational exposure. Local expertise tailors libraries to jurisdictional norms and mitigates enforcement risk.
Public sector procurement of visual services
- Market size tag: OECD ~12% of GDP
- Risk tag: long bid cycles → variable revenue
- Barrier tag: security, accessibility certifications required
- Opportunity tag: framework agreements = recurring revenue
Disaster preparedness and national resilience policies
Japan’s disaster risk — highlighted by the 2011 Tohoku quake and tsunami that caused about 210 billion USD in damage — drives strong policy emphasis on continuity planning, public information and the Basic Act on Disaster Management; vendors with resilient production, secure backups and rapid response meet government expectations and procurement preferences.
- National Resilience Program (launched 2013) compliance
- BCP certification as differentiator
- Emergency comms surge demand during disasters
Public funding 69bn yen & procurement ~12% GDP push resilient vendors; GDPR 4% alters revenue
Government support (Cool Japan Fund ~69bn yen; METI grants) and public procurement (OECD ~12% GDP) lower production costs and create pipelines, while trade and IP rules (GDPR fines up to 4% global turnover; 2024 global digital ad spend ≈ $600bn) shape licensing and revenue. Disaster policy after 2011 (~$210bn damage) boosts demand for resilient vendors; procurement cycles and certifications remain key barriers/opportunities.
| Tag | Stat | Impact |
|---|---|---|
| Support | 69bn yen | subsidies, lower costs |
| Procurement | OECD ~12% GDP | stable demand |
| Regulation | GDPR 4% fines | compliance cost |
What is included in the product
Detailed Word Document
Explores how external macro-environmental factors uniquely affect amana across Political, Economic, Social, Technological, Environmental and Legal dimensions, with data‑backed trends and region‑specific regulatory context; designed to support executives, consultants and entrepreneurs with forward‑looking insights, scenario planning and deck‑ready findings to identify risks and opportunities.
Customizable Excel Spreadsheet
Condensed PESTLE insights presented in clear categories for fast decision-making, easily dropped into presentations or shared across teams to align on external risks and strategic priorities.
Economic factors
Advertising and marketing spend cycles
Visual content demand tracks corporate ad budgets and global GDP, with IMF reporting ~3.0% real GDP growth in 2024; industry forecasts showed ad spend growing roughly 5–7% that year. Downturns push clients to lower‑cost stock/subscriptions, while expansions favor custom production. Sector mix (tech, retail, tourism) raises volatility. Flexible pricing and subscription tiers buffer cyclicality and preserve revenue during cuts.
Currency fluctuations (JPY vs. USD/EUR)
Yen depreciation (USD/JPY ~155 in mid-2025; EUR/JPY ~170) makes Japanese library assets cheaper for foreign buyers but raises costs for imported equipment and software, squeezing margins on capex. International revenues converted to JPY increase reported sales, improving top-line in 2024–25. Hedging programs and multi-currency pricing can reduce margin volatility. Indexing supplier contracts to FX stabilizes costs and cashflow.
Inflation and talent costs
Rising wages for creators, editors and technologists are squeezing project margins as wage growth outpaced inflation in recent years; US CPI peaked at 9.1% (June 2022) while the Employment Cost Index showed roughly 4.1% annual wage growth in 2023. Cost-plus or dynamic pricing can protect profitability by passing increased labor costs to clients. Automation and standardized workflows (RPA, templates) can cut delivery hours by 20–40% in pilots, offsetting labor inflation. Long-term vendor agreements lock in rates and reduce volatility, lowering procurement risk.
Subscription economy and pricing power
Clients increasingly prefer predictable subscription models for stock and DAM services; Statista forecasts subscription e-commerce to reach about 478 billion USD by 2025, reinforcing pricing power but raising expectations for predictable ARPU.
Competitive intensity compresses ARPU unless tiers, add-ons and usage-based features are differentiated; bundling production with asset management boosts LTV while churn management becomes a core KPI.
- ARPU pressure: differentiate via tiers/add‑ons
- Bundling: increases LTV
- Churn: primary KPI for retention
- Market size: ~478B USD by 2025 (Statista)
SME digitalization and enterprise transformation
Japan’s SMBs—which make up 99.7% of firms and employ roughly 70% of the workforce—are accelerating digitalization and enterprise content transformation, driving demand for scalable visuals and content ops as more businesses sell online. The need for localized, compliant, fast-turn assets rises with cross-border and platform sales; upselling workflow tools improves retention and agency partnerships expand distribution and services.
- SMB-share: 99.7% of firms
- Workforce: ~70% employed by SMEs
- Use-case: localized, compliant assets
- Strategy: workflow upsells + agency partnerships
Public funding 69bn yen & procurement ~12% GDP push resilient vendors; GDPR 4% alters revenue
Global demand tracks GDP (IMF ~3.0% real growth in 2024) and ad spend (+5–7% in 2024), creating cyclicality; flexible pricing, subscriptions and bundling protect revenue. USD/JPY ~155 (mid‑2025) makes exports attractive but raises imported capex costs; hedging and multi‑currency pricing reduce FX risk. Japan SMB digitalization (99.7% firms, ~70% workforce) drives scalable content demand.
| Metric | Value (2024/25) |
|---|---|
| Global GDP growth | ~3.0% (IMF 2024) |
| Ad spend growth | ~5–7% (2024) |
| USD/JPY | ~155 (mid‑2025) |
| Subscription market | ~$478B (2025, Statista) |
| Japan SMBs | 99.7% firms; ~70% workforce |
What You See Is What You Get
amana PESTLE Analysis
The preview shown is the exact amana PESTLE Analysis you’ll receive after purchase—fully formatted and ready to use. This screenshot reflects the real, final file with complete content and structure. No placeholders or teasers—download the same professional document immediately after checkout.











