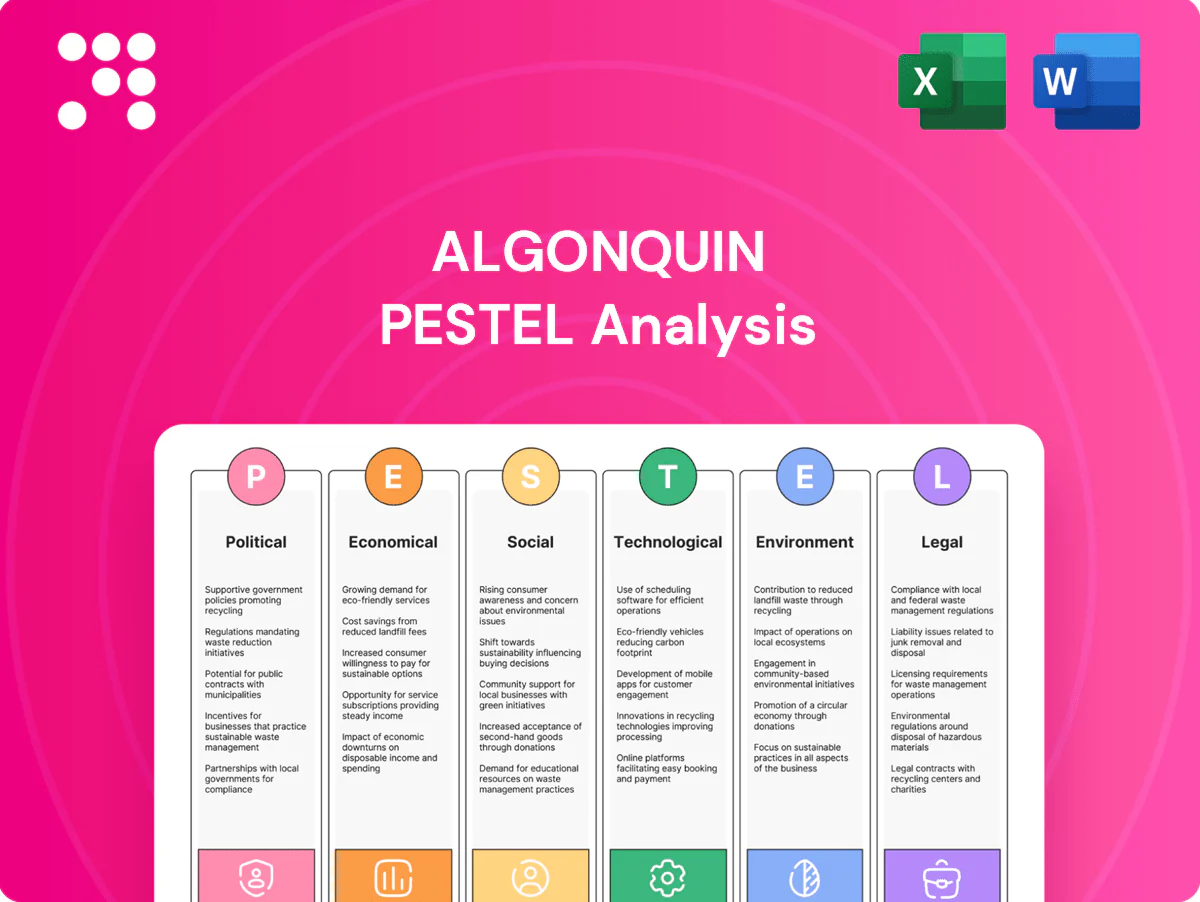
Algonquin PESTLE Analysis

Skip the Research. Get the Strategy.
Our PESTLE Analysis of Algonquin reveals how regulatory shifts, economic cycles, and environmental trends are reshaping the company’s risk and growth profile. Packed with actionable insights for investors and strategists, it highlights key threats and opportunity areas. Purchase the full report to access the complete, editable breakdown and make smarter decisions today.
Political factors

Multi-jurisdiction regulation
APUC operates across the U.S., Canada and select international markets, exposing it to divergent political priorities and regulatory philosophies. Shifts in state or provincial leadership materially affect rate approvals and infrastructure agendas, increasing timeline risk. A coordinated regulatory strategy is essential to stabilize returns. Political fragmentation raises compliance costs and can compress authorized returns.
Energy transition policies
Government incentives and mandates accelerate renewables while increasing scrutiny of gas networks; U.S. Inflation Reduction Act expanded clean energy tax credits (including ITC up to 30%) bolsters project economics and asset valuations. Canada targets a net-zero electricity grid by 2035, supporting transmission and storage demand. Policy reversals or credit step-downs would compress projected cash flows; active engagement with policymakers preserves long-term visibility.

Infrastructure permitting
Transmission, wind, solar, hydro and water assets depend on permitting certainty; US interconnection queues exceeded ~1,200 GW by 2024, straining siting timelines. Federal and state reforms (FERC/state rulemaking 2023–24) to speed interconnection and siting are materially important. Delays elevate carrying costs and can jeopardize PPA commercial operation dates, risking multi‑million dollar penalties. Strong stakeholder and community relations materially reduce veto and litigation risk.

Geopolitical supply risks
Global tensions in 2024 raised input costs for turbines, panels and transformers as shipping rates and component premiums spiked, extending delivery timelines and increasing capex volatility for developers like Algonquin.
Trade actions and tariffs in 2024–25 have repriced projects and pushed some module lead times beyond 12 months; diversified supplier networks, local content planning and selective political risk insurance are pragmatic mitigants.
- Supply-cost pressure: shipping and component premiums rose in 2024
- Tariff impact: trade measures in 2024–25 extended lead times to 12+ months
- Mitigation: diversify suppliers and plan local content
- Insurance: consider political risk cover for select markets
Municipal and tribal engagement
Local municipalities and Indigenous/Tribal nations shape land use and water rights; Canada's Indigenous population was 5.0% in the 2021 census and federal Impact Assessment Act (2019) formalizes consultation requirements, making early engagement essential. Co-development and benefit-sharing agreements have shortened dispute timelines and can accelerate approvals; misalignment often stops or shrinks projects.
- Municipal approvals affect zoning and permitting timelines
- Formal tribal agreements enable faster consent and shared revenues
- Early consultation reduces legal and reputational risk
APUC faces policy risk: >1,200 GW queue, ITC 30%, lead times 12+ months
APUC faces fragmented U.S./Canada policy risk; state/provincial rate shifts and permitting delays (US interconnection >1,200 GW in 2024) raise timeline and compliance costs. IRA clean energy credits (ITC up to 30%) and Canada’s 2035 net‑zero grid target support transmission and storage demand; tariff/supply shocks in 2024–25 increased lead times to 12+ months.
| Metric | Value |
|---|---|
| US interconnection queue (2024) | >1,200 GW |
| IRA ITC | up to 30% |
| Module lead times (2024–25) | 12+ months |
What is included in the product
 Detailed Word Document
Explores how Political, Economic, Social, Technological, Environmental and Legal forces uniquely affect Algonquin, with data-backed trends and region/industry specifics; designed for executives, consultants and entrepreneurs to identify threats, opportunities and forward-looking scenarios, and delivered in clean, report-ready format to support planning, funding and strategic decision-making.

 Customizable Excel Spreadsheet
A concise, visually segmented Algonquin PESTLE summary that removes research friction and is ready to drop into presentations or strategy packs. Shareable and editable for team alignment, it simplifies external risk discussions and speeds decision-making across regions and business lines.
Economic factors

Rate base growth
APUC’s earnings depend on ongoing expansion of its regulated rate base across gas, water and electric segments; the company reported regulated rate base of approximately CA$13.2 billion in 2024, up about 9% year-over-year.
Capital deployment cadence must align with allowed returns—typically mid-single-digit to low double-digit ROEs depending on jurisdiction—and with customer affordability constraints.
Prioritizing lower-risk, shorter-cycle investments (distribution upgrades, meter projects) stabilizes cash flows, while a balanced mix including contracted renewables smooths revenue volatility and supports long-term growth.
Interest rate sensitivity
Higher policy rates (US fed funds 5.25–5.50% and BoC ~5.00% mid-2025) elevate Algonquin’s financing costs and compress valuation multiples, pressuring yields on contracted assets. Gradual easing of 100–200 bps would materially improve project NPVs and refinancing outcomes. Active liability management and high fixed-rate coverage mitigate volatility. Regulatory pass-through of interest to consumers varies by US, Canadian and UK jurisdictions, affecting cash recovery timing.

Power prices and PPAs
Algonquin’s large share of long-term PPAs (typical tenor 15–20 years) limits merchant exposure, but repricing at PPA expiry can materially affect cash flows; Algonquin’s renewables fleet exceeds 5 GW of capacity under contract. Regional demand and capacity-auction outcomes (e.g., ISO/RTO price signals) drive recontracting economics, while investment-grade offtakers support cash-flow security. Portfolio diversification across regions and technologies reduces basis and curtailment risk.

Inflation and supply chain
Equipment, labor and materials inflation have raised Algonquin project and O&M costs; US CPI cooled to about 3.3% year‑over‑year in mid‑2025 but construction input prices remained elevated, keeping margins under pressure. Indexed tariffs and escalators in many PPAs have offset a portion of cost inflation, while strategic procurement and inventory buffering reduced lead‑time delays for critical transformers and turbines. Productivity tools, standardization and modular designs have protected margins by improving labor productivity and cutting installation hours.
- Inflation impact: higher O&M and capex
- PPA mitigant: indexed tariffs/escalators
- Supply mitigation: strategic procurement & inventory
- Margin defense: productivity tools & standardization
Customer affordability
Household income trends—US median household income was $74,580 in 2023 (US Census Bureau) amid a 2024 CPI of ~3.4% (BLS)—shape bill-payment capacity and rate-case optics for Algonquin’s regulated utilities. Targeted affordability programs and phased recovery mechanisms increase customer acceptance, while efficiency programs can reduce bills and enable capital investment. Clear, data-driven communication improves regulatory outcomes and arrears management.
- Household income: $74,580 (2023, US Census)
- Inflation: ~3.4% (2024, BLS)
- Affordability + phased recovery: higher acceptance
- Efficiency programs: lower bills, support capex
- Transparent communication: strengthens regulatory approvals
APUC faces policy risk: >1,200 GW queue, ITC 30%, lead times 12+ months
Algonquin’s earnings hinge on expanding a CA$13.2B regulated rate base (2024) and stable mid-single to low-double digit allowed ROEs across jurisdictions. Higher policy rates (US fed funds 5.25–5.50% and BoC ~5.00% mid‑2025) raise financing costs; refinancing upside if rates ease 100–200 bps. Renewables >5 GW contracted (15–20yr PPAs) and indexed tariffs partly offset inflationary pressure (US CPI ~3.3% mid‑2025).
| Metric | Value |
|---|---|
| Regulated rate base (2024) | CA$13.2B |
| Policy rates (mid‑2025) | US 5.25–5.50%, BoC ~5.00% |
| Renewables contracted | >5 GW (15–20yr PPAs) |
| US CPI (mid‑2025) | ~3.3% |
Preview Before You Purchase
Algonquin PESTLE Analysis
The preview shown here is the exact Algonquin PESTLE Analysis you’ll receive after purchase—fully formatted, professionally structured, and ready to use. The content, layout, and insights visible now match the downloadable file. No placeholders, no surprises; this is the final document.

Original: $10.00
-65%$10.00
$3.50Product Information
Product Information
Shipping & Returns
Shipping & Returns
Description
Skip the Research. Get the Strategy.
Our PESTLE Analysis of Algonquin reveals how regulatory shifts, economic cycles, and environmental trends are reshaping the company’s risk and growth profile. Packed with actionable insights for investors and strategists, it highlights key threats and opportunity areas. Purchase the full report to access the complete, editable breakdown and make smarter decisions today.
Political factors
Multi-jurisdiction regulation
APUC operates across the U.S., Canada and select international markets, exposing it to divergent political priorities and regulatory philosophies. Shifts in state or provincial leadership materially affect rate approvals and infrastructure agendas, increasing timeline risk. A coordinated regulatory strategy is essential to stabilize returns. Political fragmentation raises compliance costs and can compress authorized returns.
Energy transition policies
Government incentives and mandates accelerate renewables while increasing scrutiny of gas networks; U.S. Inflation Reduction Act expanded clean energy tax credits (including ITC up to 30%) bolsters project economics and asset valuations. Canada targets a net-zero electricity grid by 2035, supporting transmission and storage demand. Policy reversals or credit step-downs would compress projected cash flows; active engagement with policymakers preserves long-term visibility.
Infrastructure permitting
Transmission, wind, solar, hydro and water assets depend on permitting certainty; US interconnection queues exceeded ~1,200 GW by 2024, straining siting timelines. Federal and state reforms (FERC/state rulemaking 2023–24) to speed interconnection and siting are materially important. Delays elevate carrying costs and can jeopardize PPA commercial operation dates, risking multi‑million dollar penalties. Strong stakeholder and community relations materially reduce veto and litigation risk.
Geopolitical supply risks
Global tensions in 2024 raised input costs for turbines, panels and transformers as shipping rates and component premiums spiked, extending delivery timelines and increasing capex volatility for developers like Algonquin.
Trade actions and tariffs in 2024–25 have repriced projects and pushed some module lead times beyond 12 months; diversified supplier networks, local content planning and selective political risk insurance are pragmatic mitigants.
- Supply-cost pressure: shipping and component premiums rose in 2024
- Tariff impact: trade measures in 2024–25 extended lead times to 12+ months
- Mitigation: diversify suppliers and plan local content
- Insurance: consider political risk cover for select markets
Municipal and tribal engagement
Local municipalities and Indigenous/Tribal nations shape land use and water rights; Canada's Indigenous population was 5.0% in the 2021 census and federal Impact Assessment Act (2019) formalizes consultation requirements, making early engagement essential. Co-development and benefit-sharing agreements have shortened dispute timelines and can accelerate approvals; misalignment often stops or shrinks projects.
- Municipal approvals affect zoning and permitting timelines
- Formal tribal agreements enable faster consent and shared revenues
- Early consultation reduces legal and reputational risk
APUC faces policy risk: >1,200 GW queue, ITC 30%, lead times 12+ months
APUC faces fragmented U.S./Canada policy risk; state/provincial rate shifts and permitting delays (US interconnection >1,200 GW in 2024) raise timeline and compliance costs. IRA clean energy credits (ITC up to 30%) and Canada’s 2035 net‑zero grid target support transmission and storage demand; tariff/supply shocks in 2024–25 increased lead times to 12+ months.
| Metric | Value |
|---|---|
| US interconnection queue (2024) | >1,200 GW |
| IRA ITC | up to 30% |
| Module lead times (2024–25) | 12+ months |
What is included in the product
Detailed Word Document
Explores how Political, Economic, Social, Technological, Environmental and Legal forces uniquely affect Algonquin, with data-backed trends and region/industry specifics; designed for executives, consultants and entrepreneurs to identify threats, opportunities and forward-looking scenarios, and delivered in clean, report-ready format to support planning, funding and strategic decision-making.
Customizable Excel Spreadsheet
A concise, visually segmented Algonquin PESTLE summary that removes research friction and is ready to drop into presentations or strategy packs. Shareable and editable for team alignment, it simplifies external risk discussions and speeds decision-making across regions and business lines.
Economic factors
Rate base growth
APUC’s earnings depend on ongoing expansion of its regulated rate base across gas, water and electric segments; the company reported regulated rate base of approximately CA$13.2 billion in 2024, up about 9% year-over-year.
Capital deployment cadence must align with allowed returns—typically mid-single-digit to low double-digit ROEs depending on jurisdiction—and with customer affordability constraints.
Prioritizing lower-risk, shorter-cycle investments (distribution upgrades, meter projects) stabilizes cash flows, while a balanced mix including contracted renewables smooths revenue volatility and supports long-term growth.
Interest rate sensitivity
Higher policy rates (US fed funds 5.25–5.50% and BoC ~5.00% mid-2025) elevate Algonquin’s financing costs and compress valuation multiples, pressuring yields on contracted assets. Gradual easing of 100–200 bps would materially improve project NPVs and refinancing outcomes. Active liability management and high fixed-rate coverage mitigate volatility. Regulatory pass-through of interest to consumers varies by US, Canadian and UK jurisdictions, affecting cash recovery timing.
Power prices and PPAs
Algonquin’s large share of long-term PPAs (typical tenor 15–20 years) limits merchant exposure, but repricing at PPA expiry can materially affect cash flows; Algonquin’s renewables fleet exceeds 5 GW of capacity under contract. Regional demand and capacity-auction outcomes (e.g., ISO/RTO price signals) drive recontracting economics, while investment-grade offtakers support cash-flow security. Portfolio diversification across regions and technologies reduces basis and curtailment risk.
Inflation and supply chain
Equipment, labor and materials inflation have raised Algonquin project and O&M costs; US CPI cooled to about 3.3% year‑over‑year in mid‑2025 but construction input prices remained elevated, keeping margins under pressure. Indexed tariffs and escalators in many PPAs have offset a portion of cost inflation, while strategic procurement and inventory buffering reduced lead‑time delays for critical transformers and turbines. Productivity tools, standardization and modular designs have protected margins by improving labor productivity and cutting installation hours.
- Inflation impact: higher O&M and capex
- PPA mitigant: indexed tariffs/escalators
- Supply mitigation: strategic procurement & inventory
- Margin defense: productivity tools & standardization
Customer affordability
Household income trends—US median household income was $74,580 in 2023 (US Census Bureau) amid a 2024 CPI of ~3.4% (BLS)—shape bill-payment capacity and rate-case optics for Algonquin’s regulated utilities. Targeted affordability programs and phased recovery mechanisms increase customer acceptance, while efficiency programs can reduce bills and enable capital investment. Clear, data-driven communication improves regulatory outcomes and arrears management.
- Household income: $74,580 (2023, US Census)
- Inflation: ~3.4% (2024, BLS)
- Affordability + phased recovery: higher acceptance
- Efficiency programs: lower bills, support capex
- Transparent communication: strengthens regulatory approvals
APUC faces policy risk: >1,200 GW queue, ITC 30%, lead times 12+ months
Algonquin’s earnings hinge on expanding a CA$13.2B regulated rate base (2024) and stable mid-single to low-double digit allowed ROEs across jurisdictions. Higher policy rates (US fed funds 5.25–5.50% and BoC ~5.00% mid‑2025) raise financing costs; refinancing upside if rates ease 100–200 bps. Renewables >5 GW contracted (15–20yr PPAs) and indexed tariffs partly offset inflationary pressure (US CPI ~3.3% mid‑2025).
| Metric | Value |
|---|---|
| Regulated rate base (2024) | CA$13.2B |
| Policy rates (mid‑2025) | US 5.25–5.50%, BoC ~5.00% |
| Renewables contracted | >5 GW (15–20yr PPAs) |
| US CPI (mid‑2025) | ~3.3% |
Preview Before You Purchase
Algonquin PESTLE Analysis
The preview shown here is the exact Algonquin PESTLE Analysis you’ll receive after purchase—fully formatted, professionally structured, and ready to use. The content, layout, and insights visible now match the downloadable file. No placeholders, no surprises; this is the final document.











