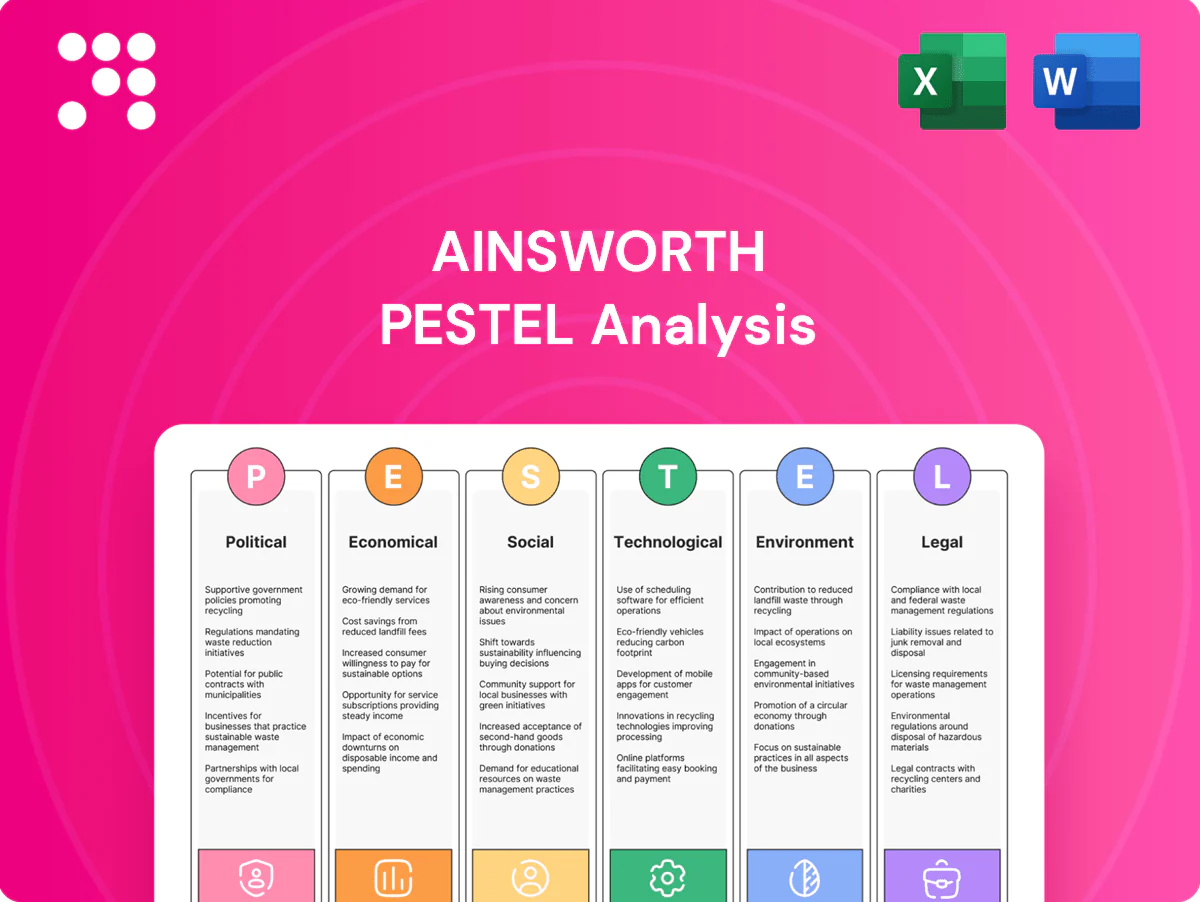
Ainsworth PESTLE Analysis

Your Shortcut to Market Insight Starts Here
Unlock strategic foresight with our Ainsworth PESTLE Analysis—concise, evidence-based insights into political, economic, social, technological, legal, and environmental forces shaping the company. Perfect for investors and strategists seeking actionable intelligence. Purchase the full report to access detailed risk assessments, growth opportunities, and editable charts for immediate implementation.
Political factors

Gambling policy shifts
Government stances on casino expansion or restrictions directly shape Ainsworths market access, with U.S. commercial gaming gross gaming revenue surpassing $58 billion in 2023 (American Gaming Association), underscoring high-stakes regulatory impact. Policy reversals can delay approvals and stall machine deployments, extending go-to-market timelines and tying up inventory. Ainsworth must track legislative agendas across the U.S., Australia, Latin America and Asia and engage proactively with regulators to mitigate shocks.
Trade and tariff dynamics
Import duties on electronics—OECD applied tariffs average ~3% for electrical goods, while US Section 301 measures can add up to 25%—directly compress margins and force retail price adjustments. Shifts in trade agreements change landed costs and can extend lead times as customs and certification processes shift. Diversifying suppliers and final-assembly locations reduces single-country concentration risk. Monitoring tariff exemptions for gaming equipment and temporary duty relief programs is essential.

Tourism and regional development priorities
Governments promoting tourism and integrated resorts have expanded slot floors, boosting demand for manufacturers like Ainsworth. Conversely, anti-gambling policies can halt or shrink projects, cutting order books and delaying rollouts. UNWTO reported international arrivals recovered to about 88% of 2019 levels in 2023, underpinning 2024 installations in pro-casino jurisdictions and accelerating Ainsworth deployments.

Public health and political sentiment
Political responses to problem gambling are driving tighter machine limits and reduced operating hours; heightened scrutiny in Australia in 2024–25 has seen multiple state reviews proposing caps on electronic gaming machines (EGMs) in pubs and clubs to curb losses and harm.
Ainsworth must align product approvals with harm-minimization objectives and demonstrate safer features—such as spend/time limits and pop-up messaging—to retain market access and political goodwill.
- Regulatory risk: state-led EGM caps proposed 2024–25
- Compliance: approvals tied to harm-minimization tech
- Reputation: safer features bolster political support
Government incentives and local manufacturing
Government incentives like Australia’s AU$1.3bn Modern Manufacturing Initiative and targeted grants reduce Ainsworth’s capital and operating costs and improve ROI; local content rules in many tenders favor majority-local value, directly influencing procurement decisions. Aligning manufacturing footprint with national policy priorities strengthens bids, while partnerships with local firms boost political acceptance and contract win rates.
- Incentives: AU$1.3bn national program
- Local content: tenders favor majority-local value
- Strategy: align footprint with policy to improve bids
- Partnerships: increase political acceptance
Tariffs up to 25% and AU$1.3bn aid reshape >US$58B casino market
Government casino policies, trade tariffs and harm-minimization rules directly affect Ainsworth’s access and margins: U.S. commercial GGR was >58B in 2023, OECD avg applied tariff for electrical goods ~3% while select US measures can add up to 25%, and AU’s AU$1.3bn Modern Manufacturing Initiative lowers local costs. State EGM caps proposed 2024–25 and UNWTO’s 2023 arrivals ~88% of 2019 drive installation demand.
| Factor | 2023–25 metric | Impact |
|---|---|---|
| Market size | US GGR >58B (2023) | Revenue opportunity |
| Tariffs | OECD ~3% / US up to 25% | Margin pressure |
What is included in the product
 Detailed Word Document
Explores how external macro-environmental factors uniquely affect Ainsworth across Political, Economic, Social, Technological, Environmental, and Legal dimensions, with each category expanded into detailed, business-specific subpoints and examples. Every section is backed by current data and forward-looking insights to support executives, consultants, and entrepreneurs in identifying risks, opportunities, and actionable strategies for funding, planning, and competitive advantage.

 Customizable Excel Spreadsheet
Ainsworth's PESTLE analysis delivers a clean, visually segmented summary that clarifies external risks and market positioning at a glance, and is easily editable and shareable for quick alignment across teams or inclusion in presentations.
Economic factors

Casino capex cycles
Operator capital expenditure drives cabinet refresh and game placements, and US commercial gaming revenue of roughly $53B in 2023 correlated with waves of machine orders that Ainsworth must track. During downturns operators extend replacement cycles, slowing orders and compressing supplier revenues. New property openings trigger step-ups in demand; Ainsworth must time product launches with capex upswings to capture order surges.
Interest rates and financing
Higher rates — US federal funds 5.25–5.50% (mid‑2025) and prime around 8.25–8.5% — raise operator borrowing costs and suppress floor investments, making leasing terms and vendor financing more important to preserve purchase activity. Ainsworth’s working capital needs climb as inventory carrying costs rise with higher rates, so flexible financing options help maintain sales velocity and dealer throughput.

Foreign exchange exposure
Revenue earned in USD, MXN and other currencies against predominantly AUD-denominated costs creates meaningful FX-driven volatility in reported earnings and pricing competitiveness for Ainsworth.
Movements in exchange rates can compress margins or require price adjustments in export markets, while local sourcing and matching local sales provide natural hedges that reduce translation and transaction risk.
Formal hedging programs—forward contracts and options—are used to stabilise margins and smooth earnings volatility across reporting periods.

Consumer discretionary trends
Disposable income and visitation patterns strongly drive slot play volumes; recessions compress GGR and reduce operator capital expenditure, while recoveries and tourism rebounds lift demand; Ainsworth benefits from resilient regional gaming markets and diversified operator relationships.
- Disposable income → slot volumes
- Recession → lower GGR, fewer purchases
- Recovery → higher demand
- Regional resilience aids Ainsworth
Inflation and supply chain costs
Tariffs up to 25% and AU$1.3bn aid reshape >US$58B casino market
Operator capex drives demand; US GGR ~$53B (2023) and new openings spike orders; higher rates (Fed 5.25–5.50% mid‑2025) raise borrowing costs and inventory carry; FX (AUD costs vs USD/MXN sales) and semiconductor costs ~+10% vs 2019 compress margins; hedging and vendor financing mitigate volatility.
| Metric | Value | Impact |
|---|---|---|
| US GGR 2023 | $53B | Order cycles |
| Fed funds (mid‑2025) | 5.25–5.50% | Higher capex cost |
| Semiconductor costs vs 2019 | +10% | COGS pressure |
Preview the Actual Deliverable
Ainsworth PESTLE Analysis
The preview shown here is the exact Ainsworth PESTLE Analysis document you’ll receive after purchase—fully formatted, professionally structured, and ready to use. What you see is the final file with complete political, economic, social, technological, legal, and environmental insights. No placeholders, no surprises—download immediately after checkout.

Product Information
Product Information
Shipping & Returns
Shipping & Returns
Description
Your Shortcut to Market Insight Starts Here
Unlock strategic foresight with our Ainsworth PESTLE Analysis—concise, evidence-based insights into political, economic, social, technological, legal, and environmental forces shaping the company. Perfect for investors and strategists seeking actionable intelligence. Purchase the full report to access detailed risk assessments, growth opportunities, and editable charts for immediate implementation.
Political factors
Gambling policy shifts
Government stances on casino expansion or restrictions directly shape Ainsworths market access, with U.S. commercial gaming gross gaming revenue surpassing $58 billion in 2023 (American Gaming Association), underscoring high-stakes regulatory impact. Policy reversals can delay approvals and stall machine deployments, extending go-to-market timelines and tying up inventory. Ainsworth must track legislative agendas across the U.S., Australia, Latin America and Asia and engage proactively with regulators to mitigate shocks.
Trade and tariff dynamics
Import duties on electronics—OECD applied tariffs average ~3% for electrical goods, while US Section 301 measures can add up to 25%—directly compress margins and force retail price adjustments. Shifts in trade agreements change landed costs and can extend lead times as customs and certification processes shift. Diversifying suppliers and final-assembly locations reduces single-country concentration risk. Monitoring tariff exemptions for gaming equipment and temporary duty relief programs is essential.
Tourism and regional development priorities
Governments promoting tourism and integrated resorts have expanded slot floors, boosting demand for manufacturers like Ainsworth. Conversely, anti-gambling policies can halt or shrink projects, cutting order books and delaying rollouts. UNWTO reported international arrivals recovered to about 88% of 2019 levels in 2023, underpinning 2024 installations in pro-casino jurisdictions and accelerating Ainsworth deployments.
Public health and political sentiment
Political responses to problem gambling are driving tighter machine limits and reduced operating hours; heightened scrutiny in Australia in 2024–25 has seen multiple state reviews proposing caps on electronic gaming machines (EGMs) in pubs and clubs to curb losses and harm.
Ainsworth must align product approvals with harm-minimization objectives and demonstrate safer features—such as spend/time limits and pop-up messaging—to retain market access and political goodwill.
- Regulatory risk: state-led EGM caps proposed 2024–25
- Compliance: approvals tied to harm-minimization tech
- Reputation: safer features bolster political support
Government incentives and local manufacturing
Government incentives like Australia’s AU$1.3bn Modern Manufacturing Initiative and targeted grants reduce Ainsworth’s capital and operating costs and improve ROI; local content rules in many tenders favor majority-local value, directly influencing procurement decisions. Aligning manufacturing footprint with national policy priorities strengthens bids, while partnerships with local firms boost political acceptance and contract win rates.
- Incentives: AU$1.3bn national program
- Local content: tenders favor majority-local value
- Strategy: align footprint with policy to improve bids
- Partnerships: increase political acceptance
Tariffs up to 25% and AU$1.3bn aid reshape >US$58B casino market
Government casino policies, trade tariffs and harm-minimization rules directly affect Ainsworth’s access and margins: U.S. commercial GGR was >58B in 2023, OECD avg applied tariff for electrical goods ~3% while select US measures can add up to 25%, and AU’s AU$1.3bn Modern Manufacturing Initiative lowers local costs. State EGM caps proposed 2024–25 and UNWTO’s 2023 arrivals ~88% of 2019 drive installation demand.
| Factor | 2023–25 metric | Impact |
|---|---|---|
| Market size | US GGR >58B (2023) | Revenue opportunity |
| Tariffs | OECD ~3% / US up to 25% | Margin pressure |
What is included in the product
Detailed Word Document
Explores how external macro-environmental factors uniquely affect Ainsworth across Political, Economic, Social, Technological, Environmental, and Legal dimensions, with each category expanded into detailed, business-specific subpoints and examples. Every section is backed by current data and forward-looking insights to support executives, consultants, and entrepreneurs in identifying risks, opportunities, and actionable strategies for funding, planning, and competitive advantage.
Customizable Excel Spreadsheet
Ainsworth's PESTLE analysis delivers a clean, visually segmented summary that clarifies external risks and market positioning at a glance, and is easily editable and shareable for quick alignment across teams or inclusion in presentations.
Economic factors
Casino capex cycles
Operator capital expenditure drives cabinet refresh and game placements, and US commercial gaming revenue of roughly $53B in 2023 correlated with waves of machine orders that Ainsworth must track. During downturns operators extend replacement cycles, slowing orders and compressing supplier revenues. New property openings trigger step-ups in demand; Ainsworth must time product launches with capex upswings to capture order surges.
Interest rates and financing
Higher rates — US federal funds 5.25–5.50% (mid‑2025) and prime around 8.25–8.5% — raise operator borrowing costs and suppress floor investments, making leasing terms and vendor financing more important to preserve purchase activity. Ainsworth’s working capital needs climb as inventory carrying costs rise with higher rates, so flexible financing options help maintain sales velocity and dealer throughput.
Foreign exchange exposure
Revenue earned in USD, MXN and other currencies against predominantly AUD-denominated costs creates meaningful FX-driven volatility in reported earnings and pricing competitiveness for Ainsworth.
Movements in exchange rates can compress margins or require price adjustments in export markets, while local sourcing and matching local sales provide natural hedges that reduce translation and transaction risk.
Formal hedging programs—forward contracts and options—are used to stabilise margins and smooth earnings volatility across reporting periods.
Consumer discretionary trends
Disposable income and visitation patterns strongly drive slot play volumes; recessions compress GGR and reduce operator capital expenditure, while recoveries and tourism rebounds lift demand; Ainsworth benefits from resilient regional gaming markets and diversified operator relationships.
- Disposable income → slot volumes
- Recession → lower GGR, fewer purchases
- Recovery → higher demand
- Regional resilience aids Ainsworth
Inflation and supply chain costs
Tariffs up to 25% and AU$1.3bn aid reshape >US$58B casino market
Operator capex drives demand; US GGR ~$53B (2023) and new openings spike orders; higher rates (Fed 5.25–5.50% mid‑2025) raise borrowing costs and inventory carry; FX (AUD costs vs USD/MXN sales) and semiconductor costs ~+10% vs 2019 compress margins; hedging and vendor financing mitigate volatility.
| Metric | Value | Impact |
|---|---|---|
| US GGR 2023 | $53B | Order cycles |
| Fed funds (mid‑2025) | 5.25–5.50% | Higher capex cost |
| Semiconductor costs vs 2019 | +10% | COGS pressure |
Preview the Actual Deliverable
Ainsworth PESTLE Analysis
The preview shown here is the exact Ainsworth PESTLE Analysis document you’ll receive after purchase—fully formatted, professionally structured, and ready to use. What you see is the final file with complete political, economic, social, technological, legal, and environmental insights. No placeholders, no surprises—download immediately after checkout.











