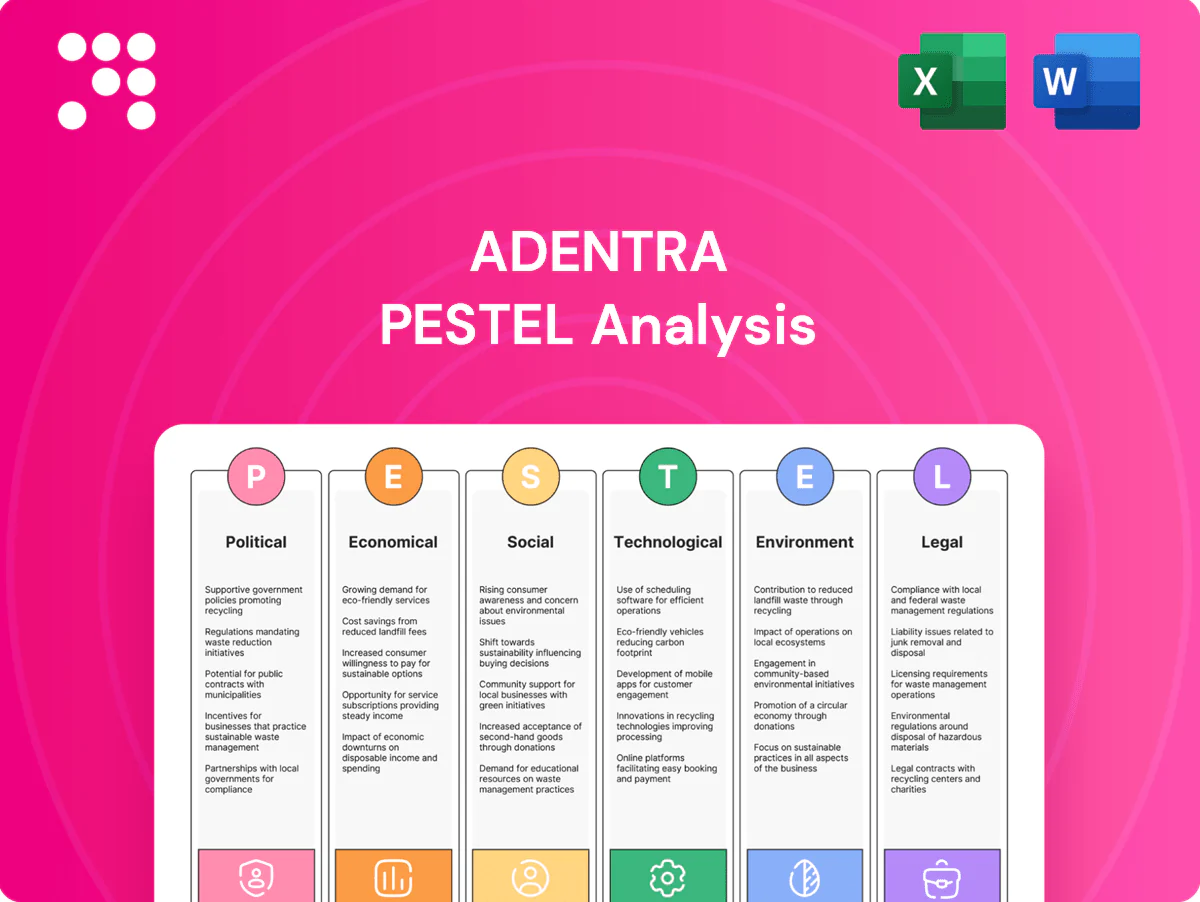
ADENTRA PESTLE Analysis

Make Smarter Strategic Decisions with a Complete PESTEL View
Unlock how political, economic, social, technological, legal and environmental forces are shaping ADENTRA’s strategic outlook with our concise PESTLE snapshot—perfect for investors and strategists. Gain actionable insights to spot risks and growth vectors. Purchase the full, downloadable PESTLE for the complete, editable analysis and immediately apply it to your decisions.
Political factors

Trade policy and tariffs
Import duties on wood, panels and hardware directly affect landed costs across the U.S.–Canada corridor; under USMCA (effective 2020) most industrial goods move tariff-free, but specific tariff lines still apply and create cost gaps. Shifts in U.S. or Canadian trade stance with Europe, Asia or Latin America can reprioritize sourcing and logistics. Tariff volatility forces periodic pricing resets and inventory hedging, while stable agreements improve margin predictability and firm customer commitments.
Infrastructure and housing incentives
Government housing and retrofit incentives—notably the US Infrastructure Investment and Jobs Act with roughly $550bn of new spending and the EU Recovery and Resilience Facility at €723.8bn—drive renovation and new-build activity, lifting demand for ADENTRA products. Public infrastructure outlays have supported non-residential orders, while policy pauses or budget cuts can shrink pipelines by 20–30% and delay cashflows. Regional programs force agile inventory allocation and sales focus to capture shifting project windows.

Buy-American/Buy-Canadian preferences
Buy-American/Buy-Canadian policies push public procurement toward North American suppliers, affecting brand assortments and supplier selection; North American public procurement represents hundreds of billions of dollars annually. Domestic content rules shift mix to regional producers and compliance alters bid eligibility and delivery timelines. Distributors must map SKUs to specific content thresholds to win contracts and avoid disqualification.

Political stability and cross-border logistics
Smooth U.S.–Canada relations underpin over $700 billion in annual bilateral trade (2024), with roughly 75% of overland freight moved by truck; border staffing, inspection intensity, or protests can push truck wait times from typical under 1 hour to 4+ hours during disruptions. Policy-driven trucking rules (hours-of-service, emissions) directly affect delivery reliability and operating cost. Contingency routing and nearshore inventory buffering cut exposure and preserve lead times.
- Trade value: >$700B (2024)
- Truck share: ~75% of overland freight
- Disruption wait spikes: 1h to 4+h
- Mitigation: contingency routes + nearshore buffering
Regional building code harmonization
Provincial and state political bodies determine code adoption pacing, creating uneven timelines that affect ADENTRA distributor readiness. Faster harmonization, as seen under the EU Construction Products Regulation across 27 member states, simplifies catalog standardization and training. Fragmentation increases complexity in stocking compliant SKUs, and targeted advocacy can influence adoption timetables to favor distributors.
- Provincial/state pacing
- Harmonization simplifies SKUs & training
- Fragmentation raises stocking complexity
- Advocacy can accelerate favorable timelines
US–Canada trade >$700B: USMCA tariffs and Buy-American rules tighten lead times
Political factors: import duties and specific tariff lines under USMCA (effective 2020) create landed-cost gaps; US–Canada trade >$700B (2024) with ~75% overland freight by truck so border policy alters lead times. Public spending (US IIJA ~$550bn; EU RRF €723.8bn) lifts renovation demand; Buy-American/Canadian rules shift procurement to regional suppliers and change SKU compliance needs.
| Factor | Metric | Impact |
|---|---|---|
| Trade | >$700B (2024); ~75% truck | Lead-time volatility |
| Public spend | IIJA ~$550bn; RRF €723.8bn | Demand uplift |
| Procurement rules | Buy-American/Canadian | SKU/content shifts |
What is included in the product
 Detailed Word Document
Explores how macro-environmental forces uniquely affect ADENTRA across Political, Economic, Social, Technological, Environmental, and Legal dimensions, with data-backed trends, industry-specific examples, forward-looking insights for scenario planning, and clean formatting ready for reports or investor materials.

 Customizable Excel Spreadsheet
ADENTRA PESTLE delivers a clean, visually segmented summary of external factors—easy to drop into presentations, edit with region- or business-specific notes, and share across teams—helping stakeholders quickly align on risks, opportunities, and market positioning during planning sessions.
Economic factors

Residential and commercial cycles
ADENTRA’s volumes track housing starts, renovations and non‑res construction activity; US housing starts ran near 1.3–1.5M annualized in 2024, supporting steady residential demand. Interest rates and affordability steer project timing and size—Freddie Mac’s 30‑yr fixed averaged ~6.9% in 2024, slowing some projects. Backlogs cushion downturns but unwind in slowdowns, while a diversified end‑market mix stabilizes revenue across cycles.
Interest rates and credit availability
Higher interest rates (US federal funds 5.25–5.50% in mid‑2024) raise builder financing costs and compress homeowner remodel budgets, prompting OEMs to delay orders and destock when credit tightens. Conversely, rate cuts revive demand and widen SKU breadth per project as lower mortgage and loan costs boost discretionary spend. Working capital terms and inventory turns become critical levers for margins and liquidity.

Input inflation and FX swings
Commodity input costs for wood-based panels, laminates and metals have driven supplier pricing volatility, with panel prices swinging about +/-15% year-on-year in 2024. USD/CAD averaged roughly 1.34 in 2024, materially altering import costs and cross-border margins. Surcharges and index-linked contracts enabled partial pass-through, while hedging and dynamic pricing protected gross profit.

Labor market constraints
Tight contractor and installer labor supply is delaying project completions and product pull-through, reducing throughput and extending installation backlogs; US private sector wage growth accelerated about 4.1% year‑over‑year in 2024 per BLS, pressuring warehouse and delivery service costs. Automation and targeted upskilling are reducing bottlenecks, and consistent service levels are becoming a key differentiator when labor is scarce.
- Labor scarcity: longer install lead times and slower pull-through
- Wage pressure: ~4.1% YoY wage growth (BLS 2024) raises operating costs
- Mitigation: automation + training improve throughput
- Strategic edge: reliable service levels drive competitive advantage
Consolidation and scale economics
Industry consolidation among distributors and dealers benefits scale players that secure preferential supplier terms and higher fill-rate reliability, enabling tighter inventory turns and margin resilience. Mergers and acquisitions accelerate footprint and category expansion, but realized synergies and ROIC depend critically on integration discipline, systems harmonization and supplier renegotiation. Larger networks therefore convert scale into competitive advantage only with rigorous post-merger execution.
- Scale: better supplier terms and fill rates
- M&A: faster footprint & category growth
- Integration: drives synergy capture and ROIC
US–Canada trade >$700B: USMCA tariffs and Buy-American rules tighten lead times
ADENTRA volumes follow US housing starts (~1.4M annualized in 2024) and renovation cycles; 30‑yr mortgage avg ~6.9% in 2024 tightening affordability. USD/CAD ~1.34 in 2024 affects import costs; commodity panel swings ~±15% YoY. Wage growth ~4.1% (BLS 2024) raises installation and logistics costs, favoring scale, automation and tight working‑capital management.
| Metric | 2024 |
|---|---|
| US housing starts | ~1.4M |
| 30‑yr mortgage | ~6.9% |
| USD/CAD | ~1.34 |
| Panel price volatility | ±15% YoY |
| Wage growth | ~4.1% YoY |
What You See Is What You Get
ADENTRA PESTLE Analysis
The ADENTRA PESTLE Analysis preview shown here is the exact document you’ll receive after purchase—fully formatted and ready to use. It contains the complete political, economic, social, technological, legal, and environmental assessment. The layout, content, and structure visible are exactly what you’ll download immediately after buying. No placeholders, no surprises.

Product Information
Product Information
Shipping & Returns
Shipping & Returns
Description
Make Smarter Strategic Decisions with a Complete PESTEL View
Unlock how political, economic, social, technological, legal and environmental forces are shaping ADENTRA’s strategic outlook with our concise PESTLE snapshot—perfect for investors and strategists. Gain actionable insights to spot risks and growth vectors. Purchase the full, downloadable PESTLE for the complete, editable analysis and immediately apply it to your decisions.
Political factors
Trade policy and tariffs
Import duties on wood, panels and hardware directly affect landed costs across the U.S.–Canada corridor; under USMCA (effective 2020) most industrial goods move tariff-free, but specific tariff lines still apply and create cost gaps. Shifts in U.S. or Canadian trade stance with Europe, Asia or Latin America can reprioritize sourcing and logistics. Tariff volatility forces periodic pricing resets and inventory hedging, while stable agreements improve margin predictability and firm customer commitments.
Infrastructure and housing incentives
Government housing and retrofit incentives—notably the US Infrastructure Investment and Jobs Act with roughly $550bn of new spending and the EU Recovery and Resilience Facility at €723.8bn—drive renovation and new-build activity, lifting demand for ADENTRA products. Public infrastructure outlays have supported non-residential orders, while policy pauses or budget cuts can shrink pipelines by 20–30% and delay cashflows. Regional programs force agile inventory allocation and sales focus to capture shifting project windows.
Buy-American/Buy-Canadian preferences
Buy-American/Buy-Canadian policies push public procurement toward North American suppliers, affecting brand assortments and supplier selection; North American public procurement represents hundreds of billions of dollars annually. Domestic content rules shift mix to regional producers and compliance alters bid eligibility and delivery timelines. Distributors must map SKUs to specific content thresholds to win contracts and avoid disqualification.
Political stability and cross-border logistics
Smooth U.S.–Canada relations underpin over $700 billion in annual bilateral trade (2024), with roughly 75% of overland freight moved by truck; border staffing, inspection intensity, or protests can push truck wait times from typical under 1 hour to 4+ hours during disruptions. Policy-driven trucking rules (hours-of-service, emissions) directly affect delivery reliability and operating cost. Contingency routing and nearshore inventory buffering cut exposure and preserve lead times.
- Trade value: >$700B (2024)
- Truck share: ~75% of overland freight
- Disruption wait spikes: 1h to 4+h
- Mitigation: contingency routes + nearshore buffering
Regional building code harmonization
Provincial and state political bodies determine code adoption pacing, creating uneven timelines that affect ADENTRA distributor readiness. Faster harmonization, as seen under the EU Construction Products Regulation across 27 member states, simplifies catalog standardization and training. Fragmentation increases complexity in stocking compliant SKUs, and targeted advocacy can influence adoption timetables to favor distributors.
- Provincial/state pacing
- Harmonization simplifies SKUs & training
- Fragmentation raises stocking complexity
- Advocacy can accelerate favorable timelines
US–Canada trade >$700B: USMCA tariffs and Buy-American rules tighten lead times
Political factors: import duties and specific tariff lines under USMCA (effective 2020) create landed-cost gaps; US–Canada trade >$700B (2024) with ~75% overland freight by truck so border policy alters lead times. Public spending (US IIJA ~$550bn; EU RRF €723.8bn) lifts renovation demand; Buy-American/Canadian rules shift procurement to regional suppliers and change SKU compliance needs.
| Factor | Metric | Impact |
|---|---|---|
| Trade | >$700B (2024); ~75% truck | Lead-time volatility |
| Public spend | IIJA ~$550bn; RRF €723.8bn | Demand uplift |
| Procurement rules | Buy-American/Canadian | SKU/content shifts |
What is included in the product
Detailed Word Document
Explores how macro-environmental forces uniquely affect ADENTRA across Political, Economic, Social, Technological, Environmental, and Legal dimensions, with data-backed trends, industry-specific examples, forward-looking insights for scenario planning, and clean formatting ready for reports or investor materials.
Customizable Excel Spreadsheet
ADENTRA PESTLE delivers a clean, visually segmented summary of external factors—easy to drop into presentations, edit with region- or business-specific notes, and share across teams—helping stakeholders quickly align on risks, opportunities, and market positioning during planning sessions.
Economic factors
Residential and commercial cycles
ADENTRA’s volumes track housing starts, renovations and non‑res construction activity; US housing starts ran near 1.3–1.5M annualized in 2024, supporting steady residential demand. Interest rates and affordability steer project timing and size—Freddie Mac’s 30‑yr fixed averaged ~6.9% in 2024, slowing some projects. Backlogs cushion downturns but unwind in slowdowns, while a diversified end‑market mix stabilizes revenue across cycles.
Interest rates and credit availability
Higher interest rates (US federal funds 5.25–5.50% in mid‑2024) raise builder financing costs and compress homeowner remodel budgets, prompting OEMs to delay orders and destock when credit tightens. Conversely, rate cuts revive demand and widen SKU breadth per project as lower mortgage and loan costs boost discretionary spend. Working capital terms and inventory turns become critical levers for margins and liquidity.
Input inflation and FX swings
Commodity input costs for wood-based panels, laminates and metals have driven supplier pricing volatility, with panel prices swinging about +/-15% year-on-year in 2024. USD/CAD averaged roughly 1.34 in 2024, materially altering import costs and cross-border margins. Surcharges and index-linked contracts enabled partial pass-through, while hedging and dynamic pricing protected gross profit.
Labor market constraints
Tight contractor and installer labor supply is delaying project completions and product pull-through, reducing throughput and extending installation backlogs; US private sector wage growth accelerated about 4.1% year‑over‑year in 2024 per BLS, pressuring warehouse and delivery service costs. Automation and targeted upskilling are reducing bottlenecks, and consistent service levels are becoming a key differentiator when labor is scarce.
- Labor scarcity: longer install lead times and slower pull-through
- Wage pressure: ~4.1% YoY wage growth (BLS 2024) raises operating costs
- Mitigation: automation + training improve throughput
- Strategic edge: reliable service levels drive competitive advantage
Consolidation and scale economics
Industry consolidation among distributors and dealers benefits scale players that secure preferential supplier terms and higher fill-rate reliability, enabling tighter inventory turns and margin resilience. Mergers and acquisitions accelerate footprint and category expansion, but realized synergies and ROIC depend critically on integration discipline, systems harmonization and supplier renegotiation. Larger networks therefore convert scale into competitive advantage only with rigorous post-merger execution.
- Scale: better supplier terms and fill rates
- M&A: faster footprint & category growth
- Integration: drives synergy capture and ROIC
US–Canada trade >$700B: USMCA tariffs and Buy-American rules tighten lead times
ADENTRA volumes follow US housing starts (~1.4M annualized in 2024) and renovation cycles; 30‑yr mortgage avg ~6.9% in 2024 tightening affordability. USD/CAD ~1.34 in 2024 affects import costs; commodity panel swings ~±15% YoY. Wage growth ~4.1% (BLS 2024) raises installation and logistics costs, favoring scale, automation and tight working‑capital management.
| Metric | 2024 |
|---|---|
| US housing starts | ~1.4M |
| 30‑yr mortgage | ~6.9% |
| USD/CAD | ~1.34 |
| Panel price volatility | ±15% YoY |
| Wage growth | ~4.1% YoY |
What You See Is What You Get
ADENTRA PESTLE Analysis
The ADENTRA PESTLE Analysis preview shown here is the exact document you’ll receive after purchase—fully formatted and ready to use. It contains the complete political, economic, social, technological, legal, and environmental assessment. The layout, content, and structure visible are exactly what you’ll download immediately after buying. No placeholders, no surprises.











