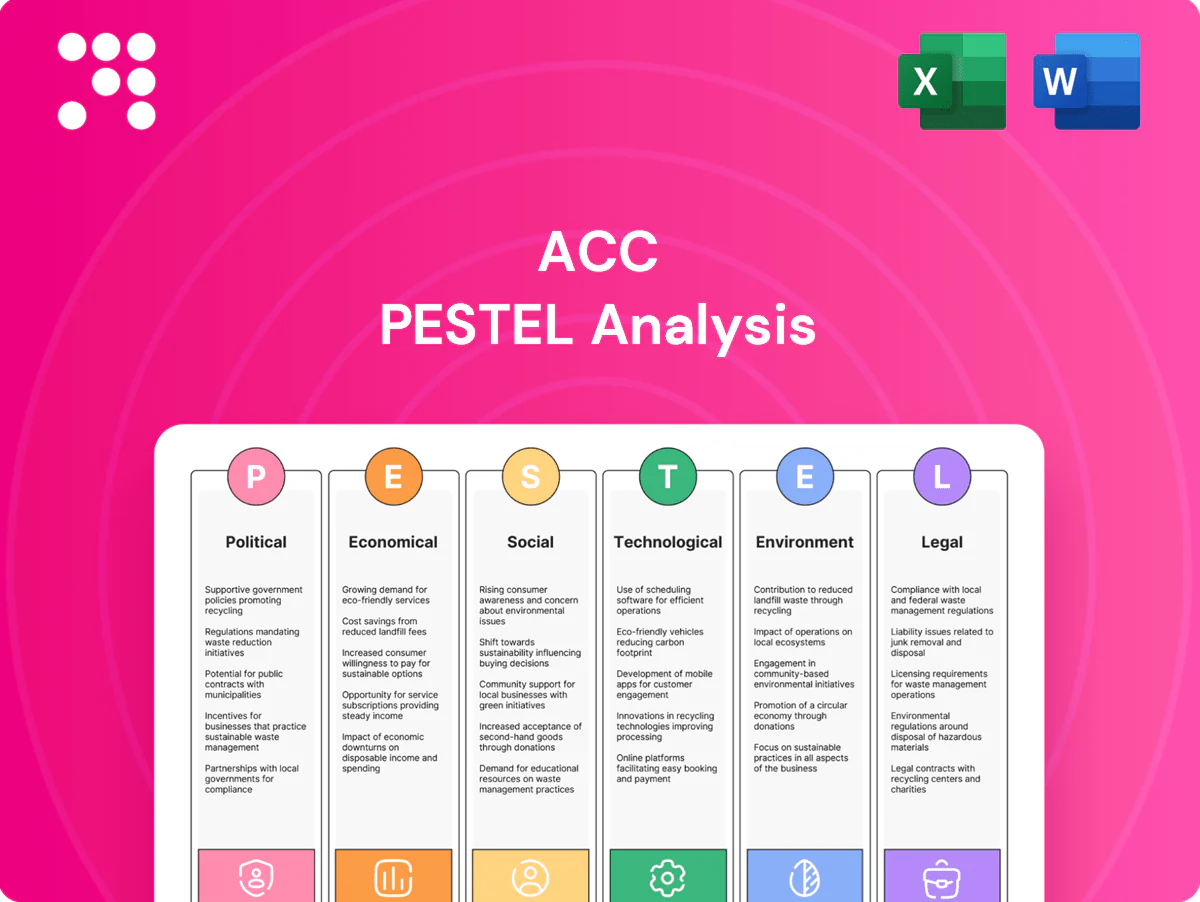
ACC PESTLE Analysis

Skip the Research. Get the Strategy.
Unlock how political shifts, economic trends, social change, technology and regulation converge to shape ACC’s future with our concise PESTLE overview. Ideal for investors and strategists, this snapshot reveals key external risks and opportunities. Purchase the full PESTLE to access in-depth, actionable intelligence and ready-to-use insights.
Political factors

Infrastructure push
Government-led capex on roads, rail and urban infrastructure directly lifts cement demand for ACC; Budget 2024-25 raised capital expenditure to about INR 11.1 lakh crore, creating multi-year visibility for large projects. Flagship schemes and NHAI/railway award pipelines support steady volumes, but execution pace and election-year spending can cause quarterly volatility. Close engagement with public agencies helps ACC secure multi-year supply contracts and advance off-take agreements.
Limestone and mining policy
Limestone allocation, auction norms and state royalties (often adjusted by 2–5 percentage points in recent years) directly shape ACC's raw-material security and unit costs; India’s cement capacity near 560 MTPA (FY24) heightens competition for deposits. Stable long-duration leases cut supply risk and logistics spend, supporting margin stability. Sudden royalty hikes or auction rule shifts compress EBITDA; proactive compliance and multi-year reserve planning are essential.

GST and indirect taxes
GST on cement remains at 28%, directly influencing retail pricing and affordability; monthly GST mop-up averaged about Rs 1.8–1.9 lakh crore in 2024–25, keeping indirect tax policy tightly linked to demand. Input tax credits and compliance efficiency materially affect ACCs working capital through timing of ITC refunds and e-way bill/processes. Any rate rationalization could lift volume but compress net realization unless fully passed through, so ACC must optimize tax planning and state-level filings to protect margins.

Logistics and rail policy
Rail freight rates and wagon availability directly shape ACCs inland distribution economics; Indian Railways moved ~1.4 billion tonnes in FY23 with freight earnings ~₹1.45 lakh crore, keeping rail a cost-competitive channel. Policy incentives for coastal shipping and multimodal hubs (push to expand DFCs and ports) can cut delivered cost and transit time. Captive rail sidings and logistics partnerships enable efficient plant-to-market reach and lower inventory days.
- Rail freight volume: ~1.4 billion tonnes (FY23)
- Freight earnings: ~₹1.45 lakh crore (FY23)
- Policy levers: DFCs, coastal shipping, multimodal hubs
- ACC edge: captive sidings, logistics partnerships
State-level permits
State-level permits for plant expansion, power, water and transport in India are governed by state authorities under the federal framework (Constitution Schedule VII), producing wide inter-state variability; administrative timelines therefore directly influence project execution and cashflow forecasts. Stable local governance reduces shutdown risk, while proactive community relations lower litigation and social-blockage incidents.
- Permits governed by state bodies (Schedule VII)
- Timelines vary—affect project schedules
- Stable governance = fewer disruptions
- Community engagement de-risks approvals
Capex fuels cement demand; GST 28% and rail costs influence margins
Government capex (Budget 2024-25: INR 11.1 lakh crore) and NHAI/rail awards drive multi-year demand, but election-year spending and execution pace cause volatility. Limestone allocation rules, state royalty moves (±2–5 pp) and ~560 MTPA capacity (FY24) affect raw-material security and margins. GST at 28% and rail logistics (1.4 bn t moved, freight earnings ₹1.45 lakh crore FY23) shape pricing and distribution costs.
| Indicator | Value |
|---|---|
| Budget capex 2024-25 | INR 11.1 lakh crore |
| India cement capacity FY24 | ~560 MTPA |
| GST on cement | 28% |
| Rail freight (vol) | 1.4 bn t (FY23) |
| Rail freight earnings | ₹1.45 lakh crore (FY23) |
What is included in the product
 Detailed Word Document
Explores how external macro-environmental factors uniquely affect the ACC across six dimensions—Political, Economic, Social, Technological, Environmental, and Legal—using data-backed insights and forward-looking implications. Designed for executives, consultants, and investors, it’s formatted for easy inclusion in plans, decks, or reports.

 Customizable Excel Spreadsheet
A concise, visually segmented ACC PESTLE summary that’s easily dropped into slides or shared across teams, allowing quick edits for regional or business-line context and supporting rapid alignment on external risks and market positioning during planning sessions.
Economic factors

Capex cycle and housing
Macro growth (India GDP ~7.2% in FY24) and housing starts plus private capex remain primary drivers of cement volumes; industry demand grew about 5% in 2024. Affordable housing schemes such as PMAY (over 12m houses delivered by 2024) underpin mass-market volume. Weak cycles compress pricing power and utilization, while ACC’s diverse product mix and expanding RMC footprint enable capture across segments.
Energy and fuel costs
Coal, petcoke and power tariffs are major cost drivers for ACC, with fuel and power typically around 25% of cement production cost. Volatility in imported coal (Newcastle averaged about $150/t in 2024) and uncertainty in domestic linkage availability pressure unit economics. Fuel‑mix optimization and thermal efficiency gains help protect margins. Degree of pass‑through depends on local competitive intensity and regional tariff structures.

Interest rates and credit
Rate cuts (RBI repo at 6.50% in July 2025) typically stimulate real estate and infrastructure, lifting cement consumption; ACC benefits from volume recovery. Higher rates raise financing costs for ACC and customers, squeezing margins and project starts. Credit availability affects dealer inventory and contractor cash flows, so prudent leverage and active treasury management are key to liquidity and working-capital resilience.

Input material availability
Supply of fly ash (~230 Mt/year India, CEA 2023) and blast-furnace slag (India crude steel ~125 Mt in 2023, worldsteel) directly shapes ACCs blended cement output and clinker substitution rates (typical SCM substitution 20–35%). Steel and power sector cycles drive SCM availability and price volatility; outages or higher imports push clinker share up, raising CO2 intensity. Long-term sourcing and offtake contracts with power/steel players stabilize supply and contain input cost spikes.
- Fly ash India ~230 Mt (CEA 2023)
- Crude steel India ~125 Mt (2023)
- Typical SCM substitution 20–35%
- Long-term sourcing reduces supply and price risk
Commodity and FX swings
Imported equipment, fuel and spares expose ACC to currency risk as the INR traded near 83.5 per USD in 2024–25, lifting landed costs for imports; Brent averaged about 85 USD/bbl in 2024, keeping fuel-linked costs elevated.
Commodity price swings have shifted capex timing and operating costs; hedging and staggered procurement reduce volatility while disciplined pricing preserves EBITDA margins.
- FX exposure: INR ~83.5/USD (2024–25)
- Fuel backdrop: Brent ~85 USD/bbl (2024)
- Mitigants: hedging, staggered procurement
- Outcome: pricing discipline sustains margins
Capex fuels cement demand; GST 28% and rail costs influence margins
India GDP ~7.2% (FY24) and housing starts plus private capex drive cement volumes; 2024 industry demand grew ~5%, PMAY delivered >12m houses by 2024. Fuel/power (~25% of cost) and imported coal volatility (Newcastle ~$150/t in 2024) squeeze margins; hedging and efficiency mitigate. RBI repo 6.50% (Jul 2025) affects real estate finance, volumes and working-capital costs for ACC.
| Metric | Value |
|---|---|
| India GDP (FY24) | ~7.2% |
| Industry demand 2024 | ~5% |
| Repo (Jul 2025) | 6.50% |
| Newcastle 2024 | ~$150/t |
Full Version Awaits
ACC PESTLE Analysis
The preview shown here is the exact ACC PESTLE Analysis document you’ll receive after purchase—fully formatted and ready to use. The layout, content, and structure visible are identical to the file you’ll download immediately after payment. No placeholders, no teasers—this is the real, finished report.

Original: $10.00
-65%$10.00
$3.50Product Information
Product Information
Shipping & Returns
Shipping & Returns
Description
Skip the Research. Get the Strategy.
Unlock how political shifts, economic trends, social change, technology and regulation converge to shape ACC’s future with our concise PESTLE overview. Ideal for investors and strategists, this snapshot reveals key external risks and opportunities. Purchase the full PESTLE to access in-depth, actionable intelligence and ready-to-use insights.
Political factors
Infrastructure push
Government-led capex on roads, rail and urban infrastructure directly lifts cement demand for ACC; Budget 2024-25 raised capital expenditure to about INR 11.1 lakh crore, creating multi-year visibility for large projects. Flagship schemes and NHAI/railway award pipelines support steady volumes, but execution pace and election-year spending can cause quarterly volatility. Close engagement with public agencies helps ACC secure multi-year supply contracts and advance off-take agreements.
Limestone and mining policy
Limestone allocation, auction norms and state royalties (often adjusted by 2–5 percentage points in recent years) directly shape ACC's raw-material security and unit costs; India’s cement capacity near 560 MTPA (FY24) heightens competition for deposits. Stable long-duration leases cut supply risk and logistics spend, supporting margin stability. Sudden royalty hikes or auction rule shifts compress EBITDA; proactive compliance and multi-year reserve planning are essential.
GST and indirect taxes
GST on cement remains at 28%, directly influencing retail pricing and affordability; monthly GST mop-up averaged about Rs 1.8–1.9 lakh crore in 2024–25, keeping indirect tax policy tightly linked to demand. Input tax credits and compliance efficiency materially affect ACCs working capital through timing of ITC refunds and e-way bill/processes. Any rate rationalization could lift volume but compress net realization unless fully passed through, so ACC must optimize tax planning and state-level filings to protect margins.
Logistics and rail policy
Rail freight rates and wagon availability directly shape ACCs inland distribution economics; Indian Railways moved ~1.4 billion tonnes in FY23 with freight earnings ~₹1.45 lakh crore, keeping rail a cost-competitive channel. Policy incentives for coastal shipping and multimodal hubs (push to expand DFCs and ports) can cut delivered cost and transit time. Captive rail sidings and logistics partnerships enable efficient plant-to-market reach and lower inventory days.
- Rail freight volume: ~1.4 billion tonnes (FY23)
- Freight earnings: ~₹1.45 lakh crore (FY23)
- Policy levers: DFCs, coastal shipping, multimodal hubs
- ACC edge: captive sidings, logistics partnerships
State-level permits
State-level permits for plant expansion, power, water and transport in India are governed by state authorities under the federal framework (Constitution Schedule VII), producing wide inter-state variability; administrative timelines therefore directly influence project execution and cashflow forecasts. Stable local governance reduces shutdown risk, while proactive community relations lower litigation and social-blockage incidents.
- Permits governed by state bodies (Schedule VII)
- Timelines vary—affect project schedules
- Stable governance = fewer disruptions
- Community engagement de-risks approvals
Capex fuels cement demand; GST 28% and rail costs influence margins
Government capex (Budget 2024-25: INR 11.1 lakh crore) and NHAI/rail awards drive multi-year demand, but election-year spending and execution pace cause volatility. Limestone allocation rules, state royalty moves (±2–5 pp) and ~560 MTPA capacity (FY24) affect raw-material security and margins. GST at 28% and rail logistics (1.4 bn t moved, freight earnings ₹1.45 lakh crore FY23) shape pricing and distribution costs.
| Indicator | Value |
|---|---|
| Budget capex 2024-25 | INR 11.1 lakh crore |
| India cement capacity FY24 | ~560 MTPA |
| GST on cement | 28% |
| Rail freight (vol) | 1.4 bn t (FY23) |
| Rail freight earnings | ₹1.45 lakh crore (FY23) |
What is included in the product
Detailed Word Document
Explores how external macro-environmental factors uniquely affect the ACC across six dimensions—Political, Economic, Social, Technological, Environmental, and Legal—using data-backed insights and forward-looking implications. Designed for executives, consultants, and investors, it’s formatted for easy inclusion in plans, decks, or reports.
Customizable Excel Spreadsheet
A concise, visually segmented ACC PESTLE summary that’s easily dropped into slides or shared across teams, allowing quick edits for regional or business-line context and supporting rapid alignment on external risks and market positioning during planning sessions.
Economic factors
Capex cycle and housing
Macro growth (India GDP ~7.2% in FY24) and housing starts plus private capex remain primary drivers of cement volumes; industry demand grew about 5% in 2024. Affordable housing schemes such as PMAY (over 12m houses delivered by 2024) underpin mass-market volume. Weak cycles compress pricing power and utilization, while ACC’s diverse product mix and expanding RMC footprint enable capture across segments.
Energy and fuel costs
Coal, petcoke and power tariffs are major cost drivers for ACC, with fuel and power typically around 25% of cement production cost. Volatility in imported coal (Newcastle averaged about $150/t in 2024) and uncertainty in domestic linkage availability pressure unit economics. Fuel‑mix optimization and thermal efficiency gains help protect margins. Degree of pass‑through depends on local competitive intensity and regional tariff structures.
Interest rates and credit
Rate cuts (RBI repo at 6.50% in July 2025) typically stimulate real estate and infrastructure, lifting cement consumption; ACC benefits from volume recovery. Higher rates raise financing costs for ACC and customers, squeezing margins and project starts. Credit availability affects dealer inventory and contractor cash flows, so prudent leverage and active treasury management are key to liquidity and working-capital resilience.
Input material availability
Supply of fly ash (~230 Mt/year India, CEA 2023) and blast-furnace slag (India crude steel ~125 Mt in 2023, worldsteel) directly shapes ACCs blended cement output and clinker substitution rates (typical SCM substitution 20–35%). Steel and power sector cycles drive SCM availability and price volatility; outages or higher imports push clinker share up, raising CO2 intensity. Long-term sourcing and offtake contracts with power/steel players stabilize supply and contain input cost spikes.
- Fly ash India ~230 Mt (CEA 2023)
- Crude steel India ~125 Mt (2023)
- Typical SCM substitution 20–35%
- Long-term sourcing reduces supply and price risk
Commodity and FX swings
Imported equipment, fuel and spares expose ACC to currency risk as the INR traded near 83.5 per USD in 2024–25, lifting landed costs for imports; Brent averaged about 85 USD/bbl in 2024, keeping fuel-linked costs elevated.
Commodity price swings have shifted capex timing and operating costs; hedging and staggered procurement reduce volatility while disciplined pricing preserves EBITDA margins.
- FX exposure: INR ~83.5/USD (2024–25)
- Fuel backdrop: Brent ~85 USD/bbl (2024)
- Mitigants: hedging, staggered procurement
- Outcome: pricing discipline sustains margins
Capex fuels cement demand; GST 28% and rail costs influence margins
India GDP ~7.2% (FY24) and housing starts plus private capex drive cement volumes; 2024 industry demand grew ~5%, PMAY delivered >12m houses by 2024. Fuel/power (~25% of cost) and imported coal volatility (Newcastle ~$150/t in 2024) squeeze margins; hedging and efficiency mitigate. RBI repo 6.50% (Jul 2025) affects real estate finance, volumes and working-capital costs for ACC.
| Metric | Value |
|---|---|
| India GDP (FY24) | ~7.2% |
| Industry demand 2024 | ~5% |
| Repo (Jul 2025) | 6.50% |
| Newcastle 2024 | ~$150/t |
Full Version Awaits
ACC PESTLE Analysis
The preview shown here is the exact ACC PESTLE Analysis document you’ll receive after purchase—fully formatted and ready to use. The layout, content, and structure visible are identical to the file you’ll download immediately after payment. No placeholders, no teasers—this is the real, finished report.











