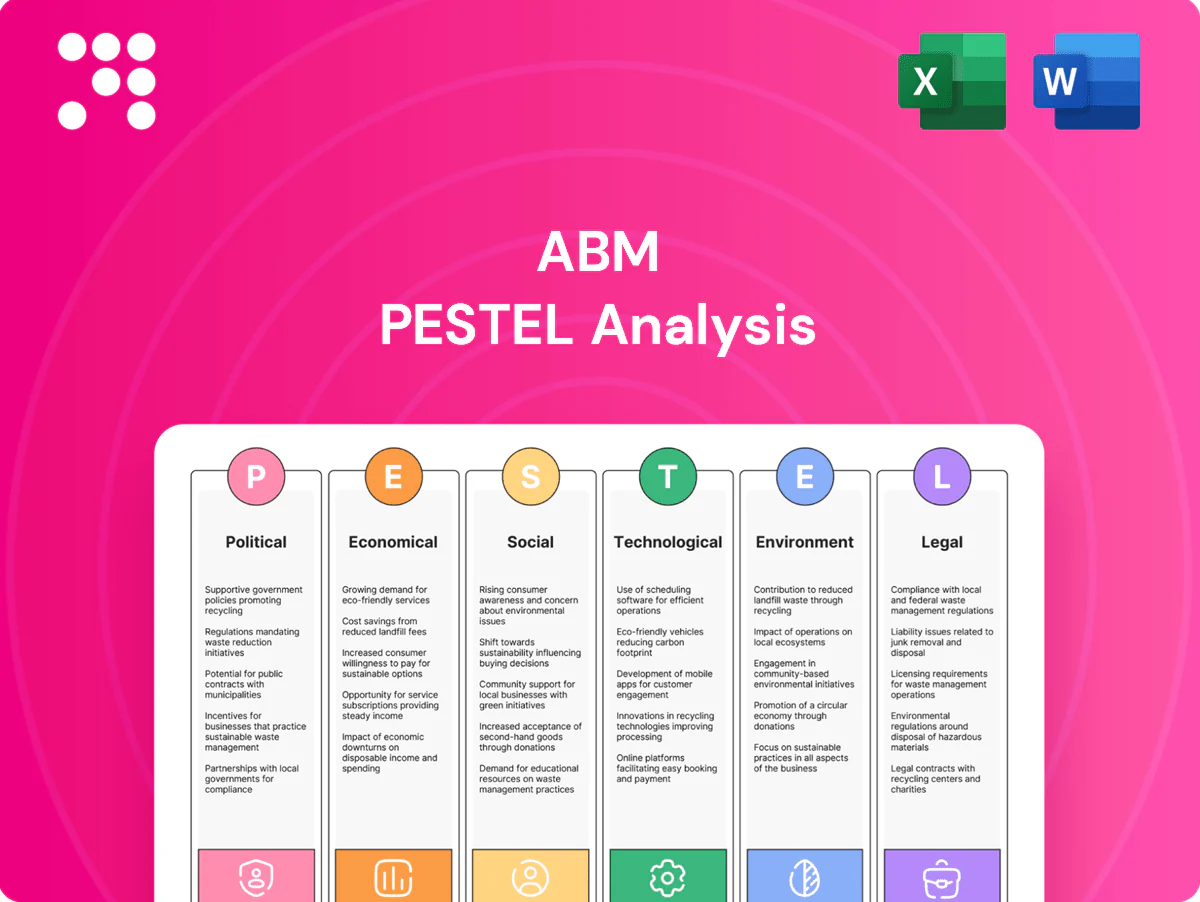
ABM PESTLE Analysis

Plan Smarter. Present Sharper. Compete Stronger.
Unlock how political, economic, social, technological, legal, and environmental forces shape ABM’s strategy and risks in our concise PESTLE briefing—perfect for investors and planners. Get the full, editable analysis to make data-driven decisions and download instantly.
Political factors

Public-sector outsourcing
Government agencies increasingly outsource facility services to cut costs and meet performance mandates; U.S. federal discretionary spending was about $1.7 trillion in 2024, shaping overall procurement capacity that affects ABM’s pipeline. Shifts in public procurement priorities can quickly expand or contract bid opportunities. Election cycles and delayed budget approvals in 2024 often postponed awards, while stable relationships and strong contract compliance support retention and renewals.
Infrastructure and building policy
Federal and state funding under the 2021 Bipartisan Infrastructure Law (total $1.2 trillion, $550 billion new) and the 2022 Inflation Reduction Act (~$369 billion clean energy) is driving school, airport and hospital facilities demand and retrofit pipelines.
Energy-efficiency and modernization programs create sustained retrofit and maintenance revenue, while funding delays or reallocations shift backlog timing and cashflow.
Local code updates frequently trigger new service needs and capital projects for ABM.

Labor and immigration stance
Political views on immigration shape frontline labor availability—immigrants made up about 17% of the US workforce in 2023, concentrating in healthcare, hospitality and construction. Stricter enforcement raises compliance costs and delays onboarding, shrinking hiring pools and raising turnover. Changes to visa programs, such as the H-2B annual cap of 66,000, directly tighten or ease short-term labor supply, while public sentiment influences client expectations on workforce practices.

Urban governance and safety
- Policy-driven demand: zoning/transit changes
- Revitalization: boosts janitorial/parking/security
- Disorder raises incident & insurance costs
- Municipal partnerships = multi-site contracts
Trade and procurement rules
Buy American and local-content rules raise sourcing costs and bias suppliers: the federal Buy America preference often requires ~55% domestic content for infrastructure procurements, shifting spend to higher-cost domestic equipment and parts. Section 232 steel and 10% aluminum tariffs remain, and tariffs/sanctions can raise machine and chemical input prices by double-digit percentages in volatile sectors. Public tender rules set bid structures and slim margins; strict compliance regimes cut win rates and increase delivery risk for noncompliant vendors.
- Buy America ~55% domestic content
- Section 232: 25% steel, 10% aluminum tariffs
- Tariffs/sanctions can drive double-digit input price increases
- Public tenders compress margins and raise compliance costs
Federal outsourcing and $1.7T spend drive retrofit demand amid labor shortages
Government outsourcing and $1.7T federal discretionary spend in 2024 shape ABM’s bid pipeline, with election cycles and delayed budgets affecting award timing. Infrastructure & clean-energy laws (BIL $1.2T, IRA ~$369B) sustain retrofit demand; Buy America (~55% domestic) and Section 232 tariffs raise input costs. Labor tightness (immigrants ~17% workforce 2023; H-2B cap 66,000) pressures staffing; office occupancy ~52% in 2024 supports urban services.
| Metric | Value |
|---|---|
| Federal discretionary (2024) | $1.7T |
| BIL (total/new) | $1.2T / $550B new |
| IRA (clean energy) | ~$369B |
| Office occupancy (2024) | ~52% |
| Immigrant share (2023) | ~17% |
| H-2B cap | 66,000 |
| Buy America domestic ~ | 55% |
What is included in the product
 Detailed Word Document
Explores how external macro-environmental factors uniquely affect the ABM across Political, Economic, Social, Technological, Environmental, and Legal dimensions, with each category expanded into actionable sub-points and real-world examples. Every section is data-backed, forward-looking, and formatted for direct use in business plans, investor materials, and strategic scenario planning.

 Customizable Excel Spreadsheet
The ABM PESTLE Analysis condenses external risk and market drivers into a visually segmented, editable summary that teams can drop into presentations, share for quick alignment, and use to guide account-level planning and stakeholder discussions.
Economic factors

GDP and occupancy cycles
Facility service demand closely tracks macro growth and building occupancy: U.S. real GDP rose about 2.5% in 2024 (BEA), supporting higher service volumes as office utilization recovered to roughly 60% of pre‑pandemic levels in 2024 (Kastle). Retail footfall and travel volumes—TSA checkpoint throughput averaged near 95% of 2019 in 2024—increase scope, while downturns compress discretionary services and push cost cuts. ABM’s exposure across healthcare, aviation, education and commercial facilities helps smooth cyclicality.
Wage inflation
Labor represents roughly 60–70% of costs in janitorial and security, making wage inflation a primary margin risk; US unemployment averaged about 3.7% in 2024 and average hourly earnings rose ~4.1% year‑over‑year, tightening labor markets and pushing overtime. Pricing discipline and index‑linked contracts are crucial to preserve margins, while productivity tools and automation can cut labor hours up to ~15%, partially offsetting wage pressure.

Interest rates and capex
Higher benchmark rates (US Fed funds target 5.25–5.50% in July 2025) can delay client capex and retrofits, stretching sales cycles as borrowing and leasing costs rise. Lower rates historically spur energy projects and upgrades, increasing demand for maintenance. ABM’s energy solutions are often financed via guaranteed energy savings or ESCO models, easing approval. Working capital and credit spreads track Treasury/loan yields (10y ~4.1% July 2025), raising carrying costs.

Input and energy costs
Volatility in chemicals, equipment, fuel and utilities materially raises ABM's cost-to-serve; Brent averaged about $86/barrel in 2024 and global LNG/electricity shortages pushed industrial power prices up in parts of Europe by ~6% in 2024, increasing input spend and margin pressure. Fuel costs directly inflate mobile crews and parking operations, while supplier agreements and hedging have limited peak spikes. Efficient routing and fleet electrification (EV adoption up ~40% for light commercial vans 2024–25 in some markets) reduce exposure and lower operating cost per stop.
- Fuel: Brent ~$86/b 2024
- Power: industrial electricity +~6% in EU 2024
- Hedging/supplier contracts: reduce volatility
- Efficiency: routing + electrification cut exposure (EV van uptake ~40% 2024–25 in select regions)
Client cost optimization
Enterprises intensified opex cuts amid 2024 uncertainty, with over 60% prioritizing cost optimization; integrated services and bundled contracts reduce TCO through vendor consolidation and volume discounts. Outcome-based pricing ties fees to measurable results, improving retention and incentives, while heightened competitive intensity erodes pricing power and margins.
- Priority: >60% enterprises focused on opex cuts in 2024
- Bundle effect: lower TCO via consolidation
- Outcome-based: boosts retention, aligns incentives
- Risk: competitive intensity compresses pricing power
Federal outsourcing and $1.7T spend drive retrofit demand amid labor shortages
Facility demand follows GDP (~2.5% US real GDP 2024) and occupancy (~60% office util. 2024), with diversification across healthcare/aviation/education smoothing cycles. Labor (60–70% of costs) faces wage pressure—unemployment ~3.7% and AHE +4.1% in 2024—while automation can reduce hours ~15%. Higher rates (Fed funds 5.25–5.50% Jul 2025; 10y ~4.1%) and energy (Brent ~$86/b 2024) raise costs.
| Metric | 2024/25 |
|---|---|
| US real GDP | ~2.5% (2024) |
| Office utilization | ~60% (2024) |
| Unemployment | ~3.7% (2024) |
| Fed funds | 5.25–5.50% (Jul 2025) |
| Brent | ~$86/b (2024) |
Preview Before You Purchase
ABM PESTLE Analysis
The preview shown here is the exact ABM PESTLE Analysis document you’ll receive after purchase—fully formatted and ready to use. The content, layout, and structure visible are final with no placeholders or edits. After checkout you’ll instantly download this same professionally structured file. What you see is what you’ll get.

Product Information
Product Information
Shipping & Returns
Shipping & Returns
Description
Plan Smarter. Present Sharper. Compete Stronger.
Unlock how political, economic, social, technological, legal, and environmental forces shape ABM’s strategy and risks in our concise PESTLE briefing—perfect for investors and planners. Get the full, editable analysis to make data-driven decisions and download instantly.
Political factors
Public-sector outsourcing
Government agencies increasingly outsource facility services to cut costs and meet performance mandates; U.S. federal discretionary spending was about $1.7 trillion in 2024, shaping overall procurement capacity that affects ABM’s pipeline. Shifts in public procurement priorities can quickly expand or contract bid opportunities. Election cycles and delayed budget approvals in 2024 often postponed awards, while stable relationships and strong contract compliance support retention and renewals.
Infrastructure and building policy
Federal and state funding under the 2021 Bipartisan Infrastructure Law (total $1.2 trillion, $550 billion new) and the 2022 Inflation Reduction Act (~$369 billion clean energy) is driving school, airport and hospital facilities demand and retrofit pipelines.
Energy-efficiency and modernization programs create sustained retrofit and maintenance revenue, while funding delays or reallocations shift backlog timing and cashflow.
Local code updates frequently trigger new service needs and capital projects for ABM.
Labor and immigration stance
Political views on immigration shape frontline labor availability—immigrants made up about 17% of the US workforce in 2023, concentrating in healthcare, hospitality and construction. Stricter enforcement raises compliance costs and delays onboarding, shrinking hiring pools and raising turnover. Changes to visa programs, such as the H-2B annual cap of 66,000, directly tighten or ease short-term labor supply, while public sentiment influences client expectations on workforce practices.
Urban governance and safety
- Policy-driven demand: zoning/transit changes
- Revitalization: boosts janitorial/parking/security
- Disorder raises incident & insurance costs
- Municipal partnerships = multi-site contracts
Trade and procurement rules
Buy American and local-content rules raise sourcing costs and bias suppliers: the federal Buy America preference often requires ~55% domestic content for infrastructure procurements, shifting spend to higher-cost domestic equipment and parts. Section 232 steel and 10% aluminum tariffs remain, and tariffs/sanctions can raise machine and chemical input prices by double-digit percentages in volatile sectors. Public tender rules set bid structures and slim margins; strict compliance regimes cut win rates and increase delivery risk for noncompliant vendors.
- Buy America ~55% domestic content
- Section 232: 25% steel, 10% aluminum tariffs
- Tariffs/sanctions can drive double-digit input price increases
- Public tenders compress margins and raise compliance costs
Federal outsourcing and $1.7T spend drive retrofit demand amid labor shortages
Government outsourcing and $1.7T federal discretionary spend in 2024 shape ABM’s bid pipeline, with election cycles and delayed budgets affecting award timing. Infrastructure & clean-energy laws (BIL $1.2T, IRA ~$369B) sustain retrofit demand; Buy America (~55% domestic) and Section 232 tariffs raise input costs. Labor tightness (immigrants ~17% workforce 2023; H-2B cap 66,000) pressures staffing; office occupancy ~52% in 2024 supports urban services.
| Metric | Value |
|---|---|
| Federal discretionary (2024) | $1.7T |
| BIL (total/new) | $1.2T / $550B new |
| IRA (clean energy) | ~$369B |
| Office occupancy (2024) | ~52% |
| Immigrant share (2023) | ~17% |
| H-2B cap | 66,000 |
| Buy America domestic ~ | 55% |
What is included in the product
Detailed Word Document
Explores how external macro-environmental factors uniquely affect the ABM across Political, Economic, Social, Technological, Environmental, and Legal dimensions, with each category expanded into actionable sub-points and real-world examples. Every section is data-backed, forward-looking, and formatted for direct use in business plans, investor materials, and strategic scenario planning.
Customizable Excel Spreadsheet
The ABM PESTLE Analysis condenses external risk and market drivers into a visually segmented, editable summary that teams can drop into presentations, share for quick alignment, and use to guide account-level planning and stakeholder discussions.
Economic factors
GDP and occupancy cycles
Facility service demand closely tracks macro growth and building occupancy: U.S. real GDP rose about 2.5% in 2024 (BEA), supporting higher service volumes as office utilization recovered to roughly 60% of pre‑pandemic levels in 2024 (Kastle). Retail footfall and travel volumes—TSA checkpoint throughput averaged near 95% of 2019 in 2024—increase scope, while downturns compress discretionary services and push cost cuts. ABM’s exposure across healthcare, aviation, education and commercial facilities helps smooth cyclicality.
Wage inflation
Labor represents roughly 60–70% of costs in janitorial and security, making wage inflation a primary margin risk; US unemployment averaged about 3.7% in 2024 and average hourly earnings rose ~4.1% year‑over‑year, tightening labor markets and pushing overtime. Pricing discipline and index‑linked contracts are crucial to preserve margins, while productivity tools and automation can cut labor hours up to ~15%, partially offsetting wage pressure.
Interest rates and capex
Higher benchmark rates (US Fed funds target 5.25–5.50% in July 2025) can delay client capex and retrofits, stretching sales cycles as borrowing and leasing costs rise. Lower rates historically spur energy projects and upgrades, increasing demand for maintenance. ABM’s energy solutions are often financed via guaranteed energy savings or ESCO models, easing approval. Working capital and credit spreads track Treasury/loan yields (10y ~4.1% July 2025), raising carrying costs.
Input and energy costs
Volatility in chemicals, equipment, fuel and utilities materially raises ABM's cost-to-serve; Brent averaged about $86/barrel in 2024 and global LNG/electricity shortages pushed industrial power prices up in parts of Europe by ~6% in 2024, increasing input spend and margin pressure. Fuel costs directly inflate mobile crews and parking operations, while supplier agreements and hedging have limited peak spikes. Efficient routing and fleet electrification (EV adoption up ~40% for light commercial vans 2024–25 in some markets) reduce exposure and lower operating cost per stop.
- Fuel: Brent ~$86/b 2024
- Power: industrial electricity +~6% in EU 2024
- Hedging/supplier contracts: reduce volatility
- Efficiency: routing + electrification cut exposure (EV van uptake ~40% 2024–25 in select regions)
Client cost optimization
Enterprises intensified opex cuts amid 2024 uncertainty, with over 60% prioritizing cost optimization; integrated services and bundled contracts reduce TCO through vendor consolidation and volume discounts. Outcome-based pricing ties fees to measurable results, improving retention and incentives, while heightened competitive intensity erodes pricing power and margins.
- Priority: >60% enterprises focused on opex cuts in 2024
- Bundle effect: lower TCO via consolidation
- Outcome-based: boosts retention, aligns incentives
- Risk: competitive intensity compresses pricing power
Federal outsourcing and $1.7T spend drive retrofit demand amid labor shortages
Facility demand follows GDP (~2.5% US real GDP 2024) and occupancy (~60% office util. 2024), with diversification across healthcare/aviation/education smoothing cycles. Labor (60–70% of costs) faces wage pressure—unemployment ~3.7% and AHE +4.1% in 2024—while automation can reduce hours ~15%. Higher rates (Fed funds 5.25–5.50% Jul 2025; 10y ~4.1%) and energy (Brent ~$86/b 2024) raise costs.
| Metric | 2024/25 |
|---|---|
| US real GDP | ~2.5% (2024) |
| Office utilization | ~60% (2024) |
| Unemployment | ~3.7% (2024) |
| Fed funds | 5.25–5.50% (Jul 2025) |
| Brent | ~$86/b (2024) |
Preview Before You Purchase
ABM PESTLE Analysis
The preview shown here is the exact ABM PESTLE Analysis document you’ll receive after purchase—fully formatted and ready to use. The content, layout, and structure visible are final with no placeholders or edits. After checkout you’ll instantly download this same professionally structured file. What you see is what you’ll get.











